Location Intelligence Software
Location intelligence puts your business data on a map instead of in a spreadsheet. Maptive plots your records, layers market and census data underneath, and surfaces the patterns rows hide.
No credit card required
- Plot any spreadsheet on a map
- Layer 50+ US Census variables
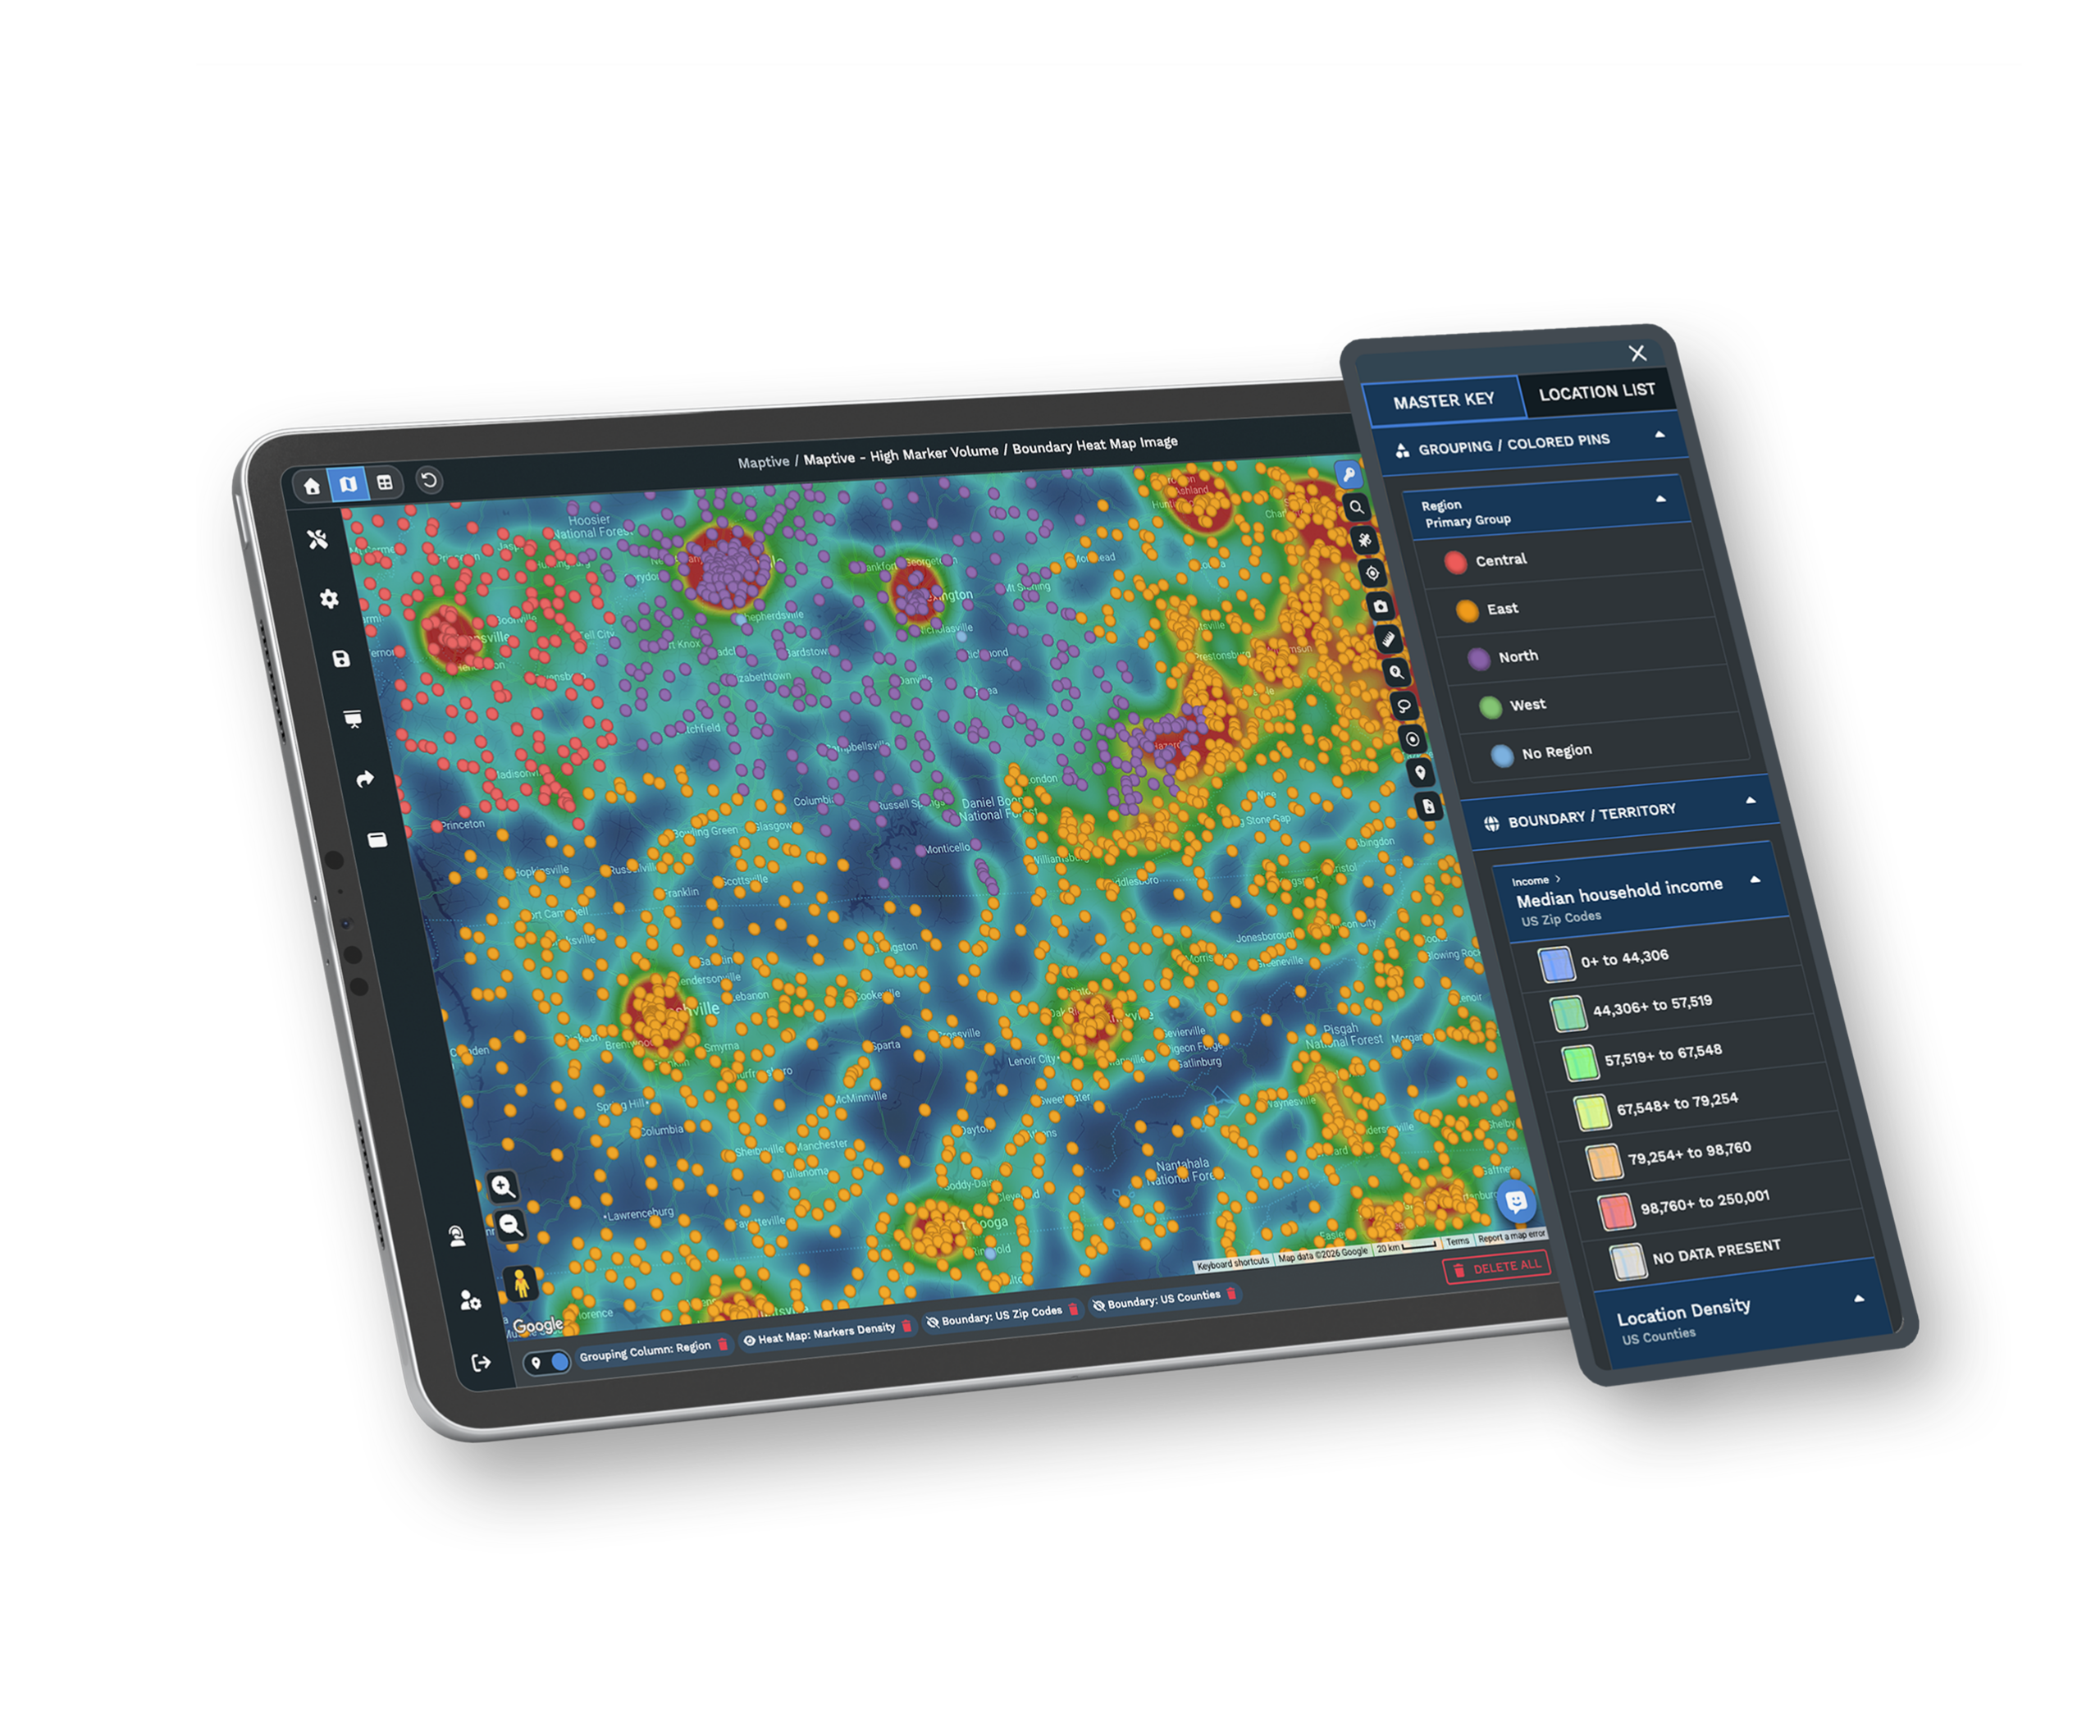
- Heat maps reveal hotspots
- Radius & drive-time rings
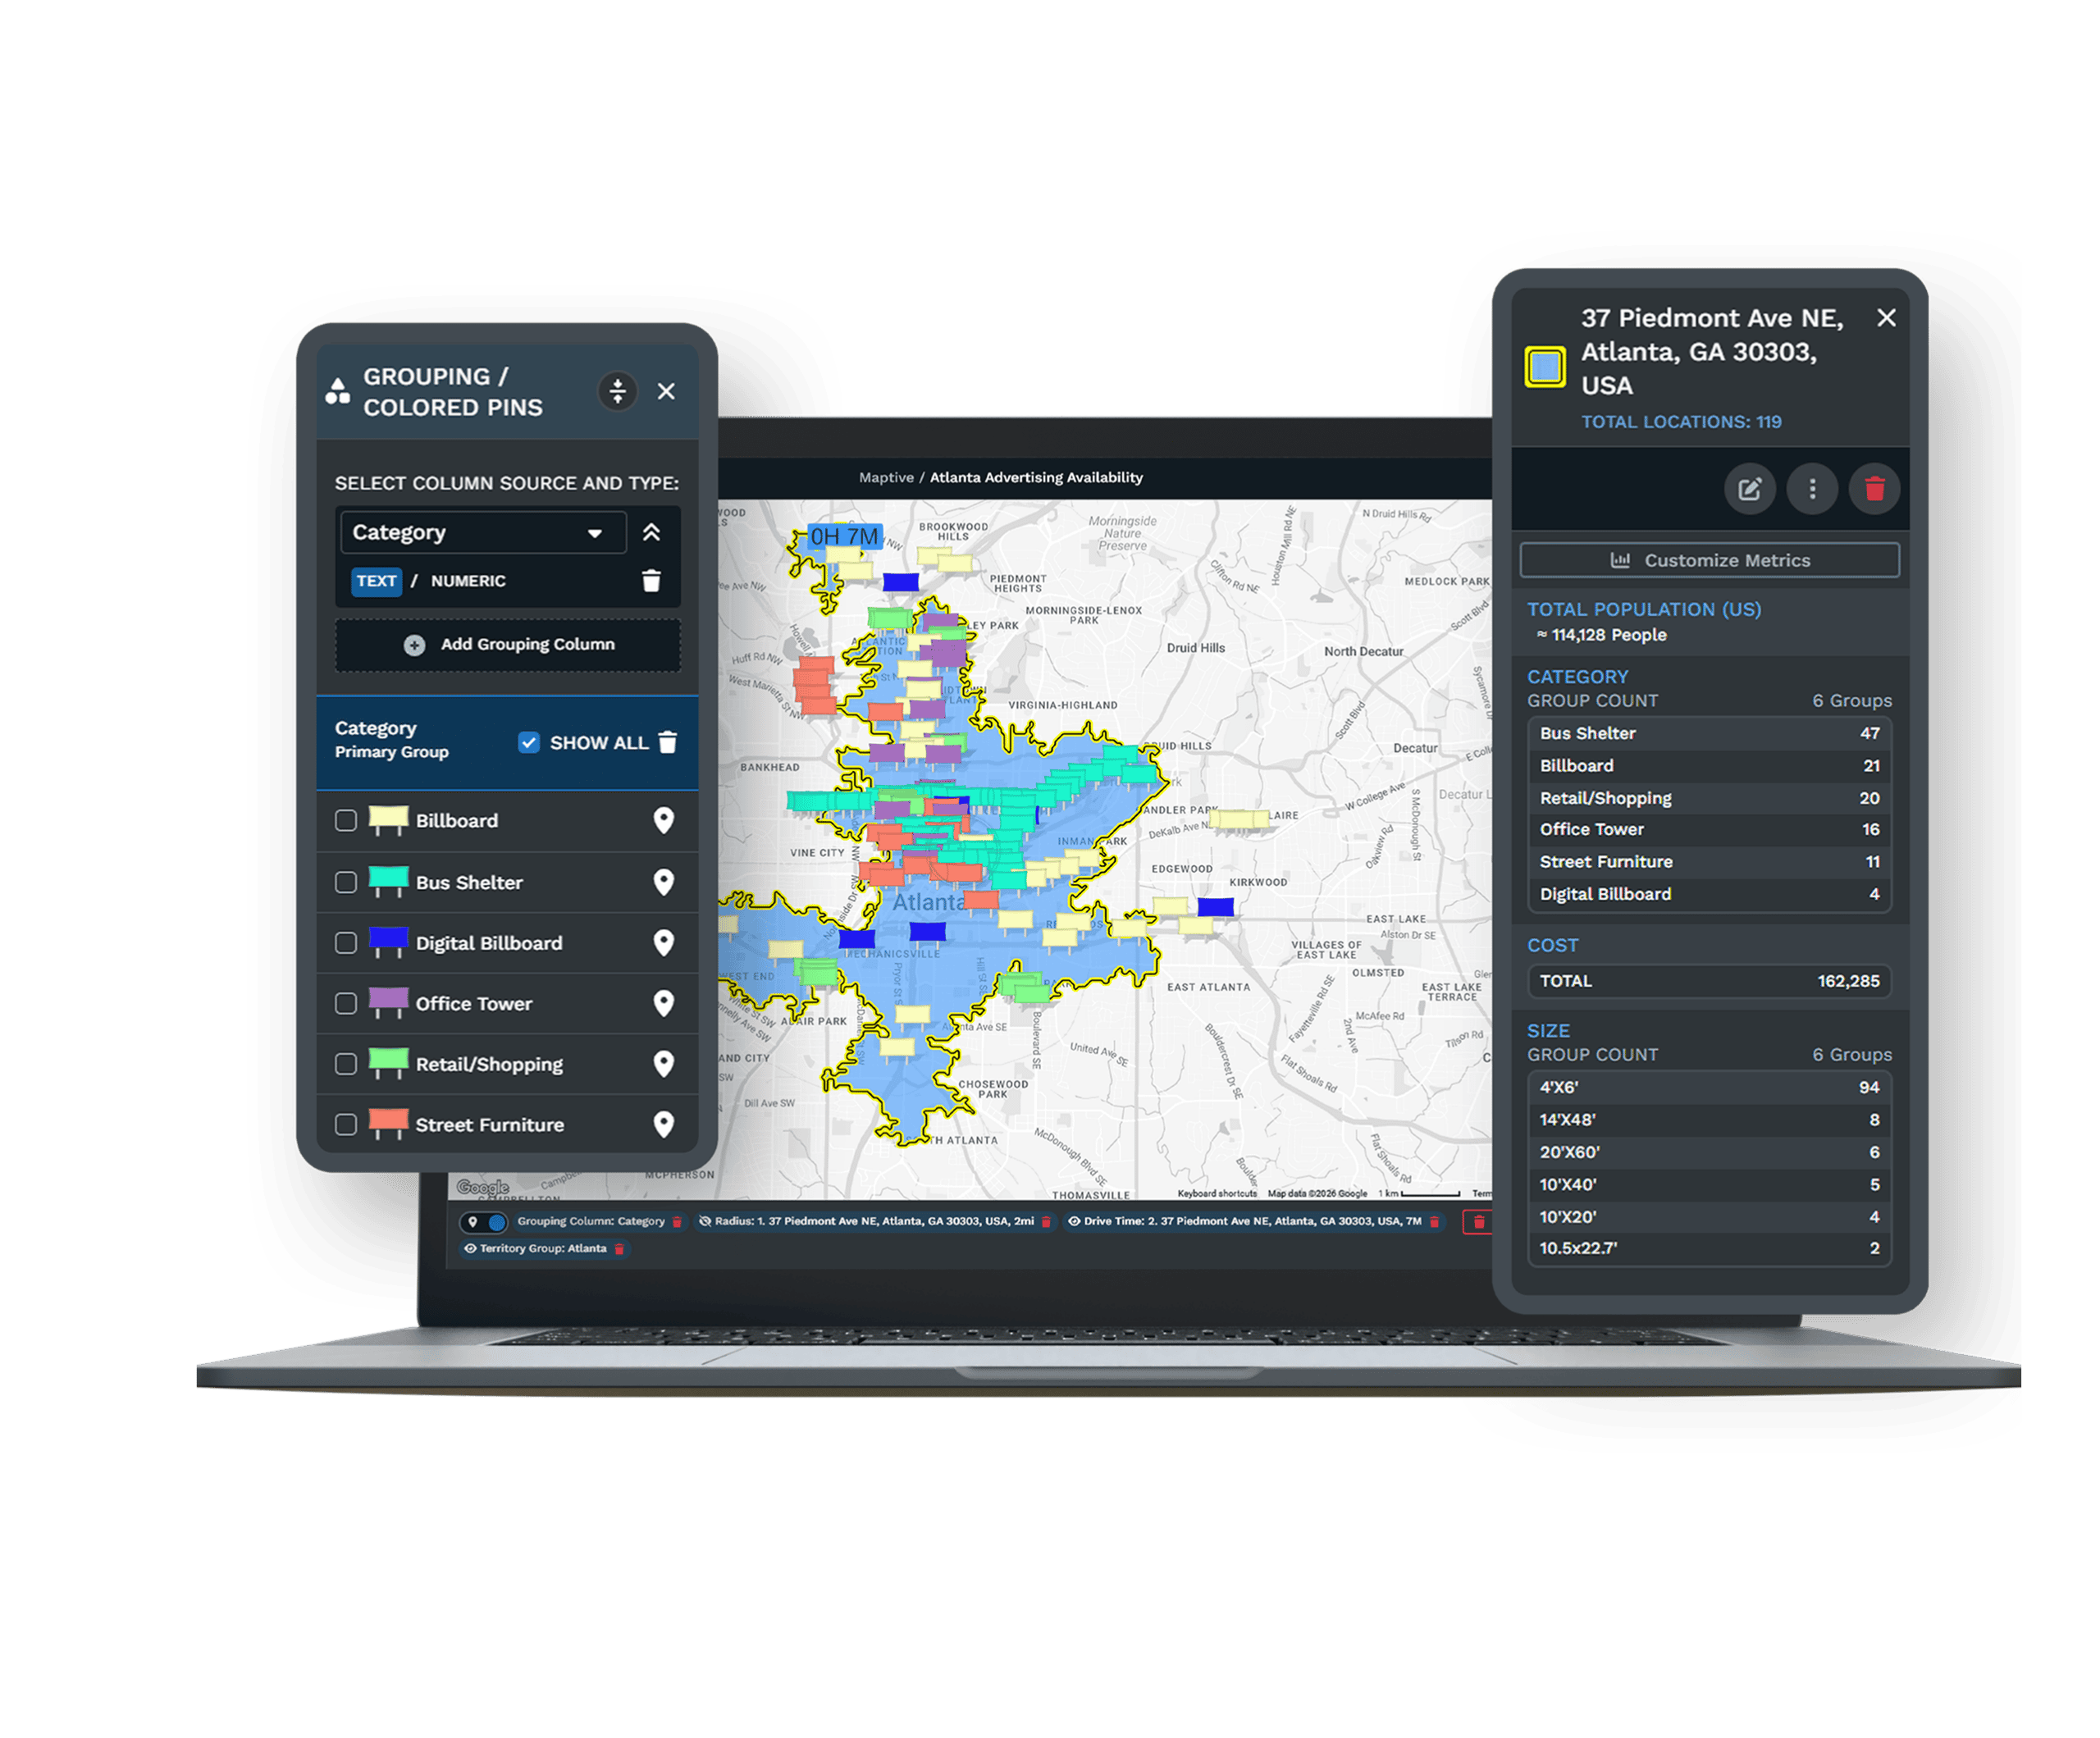
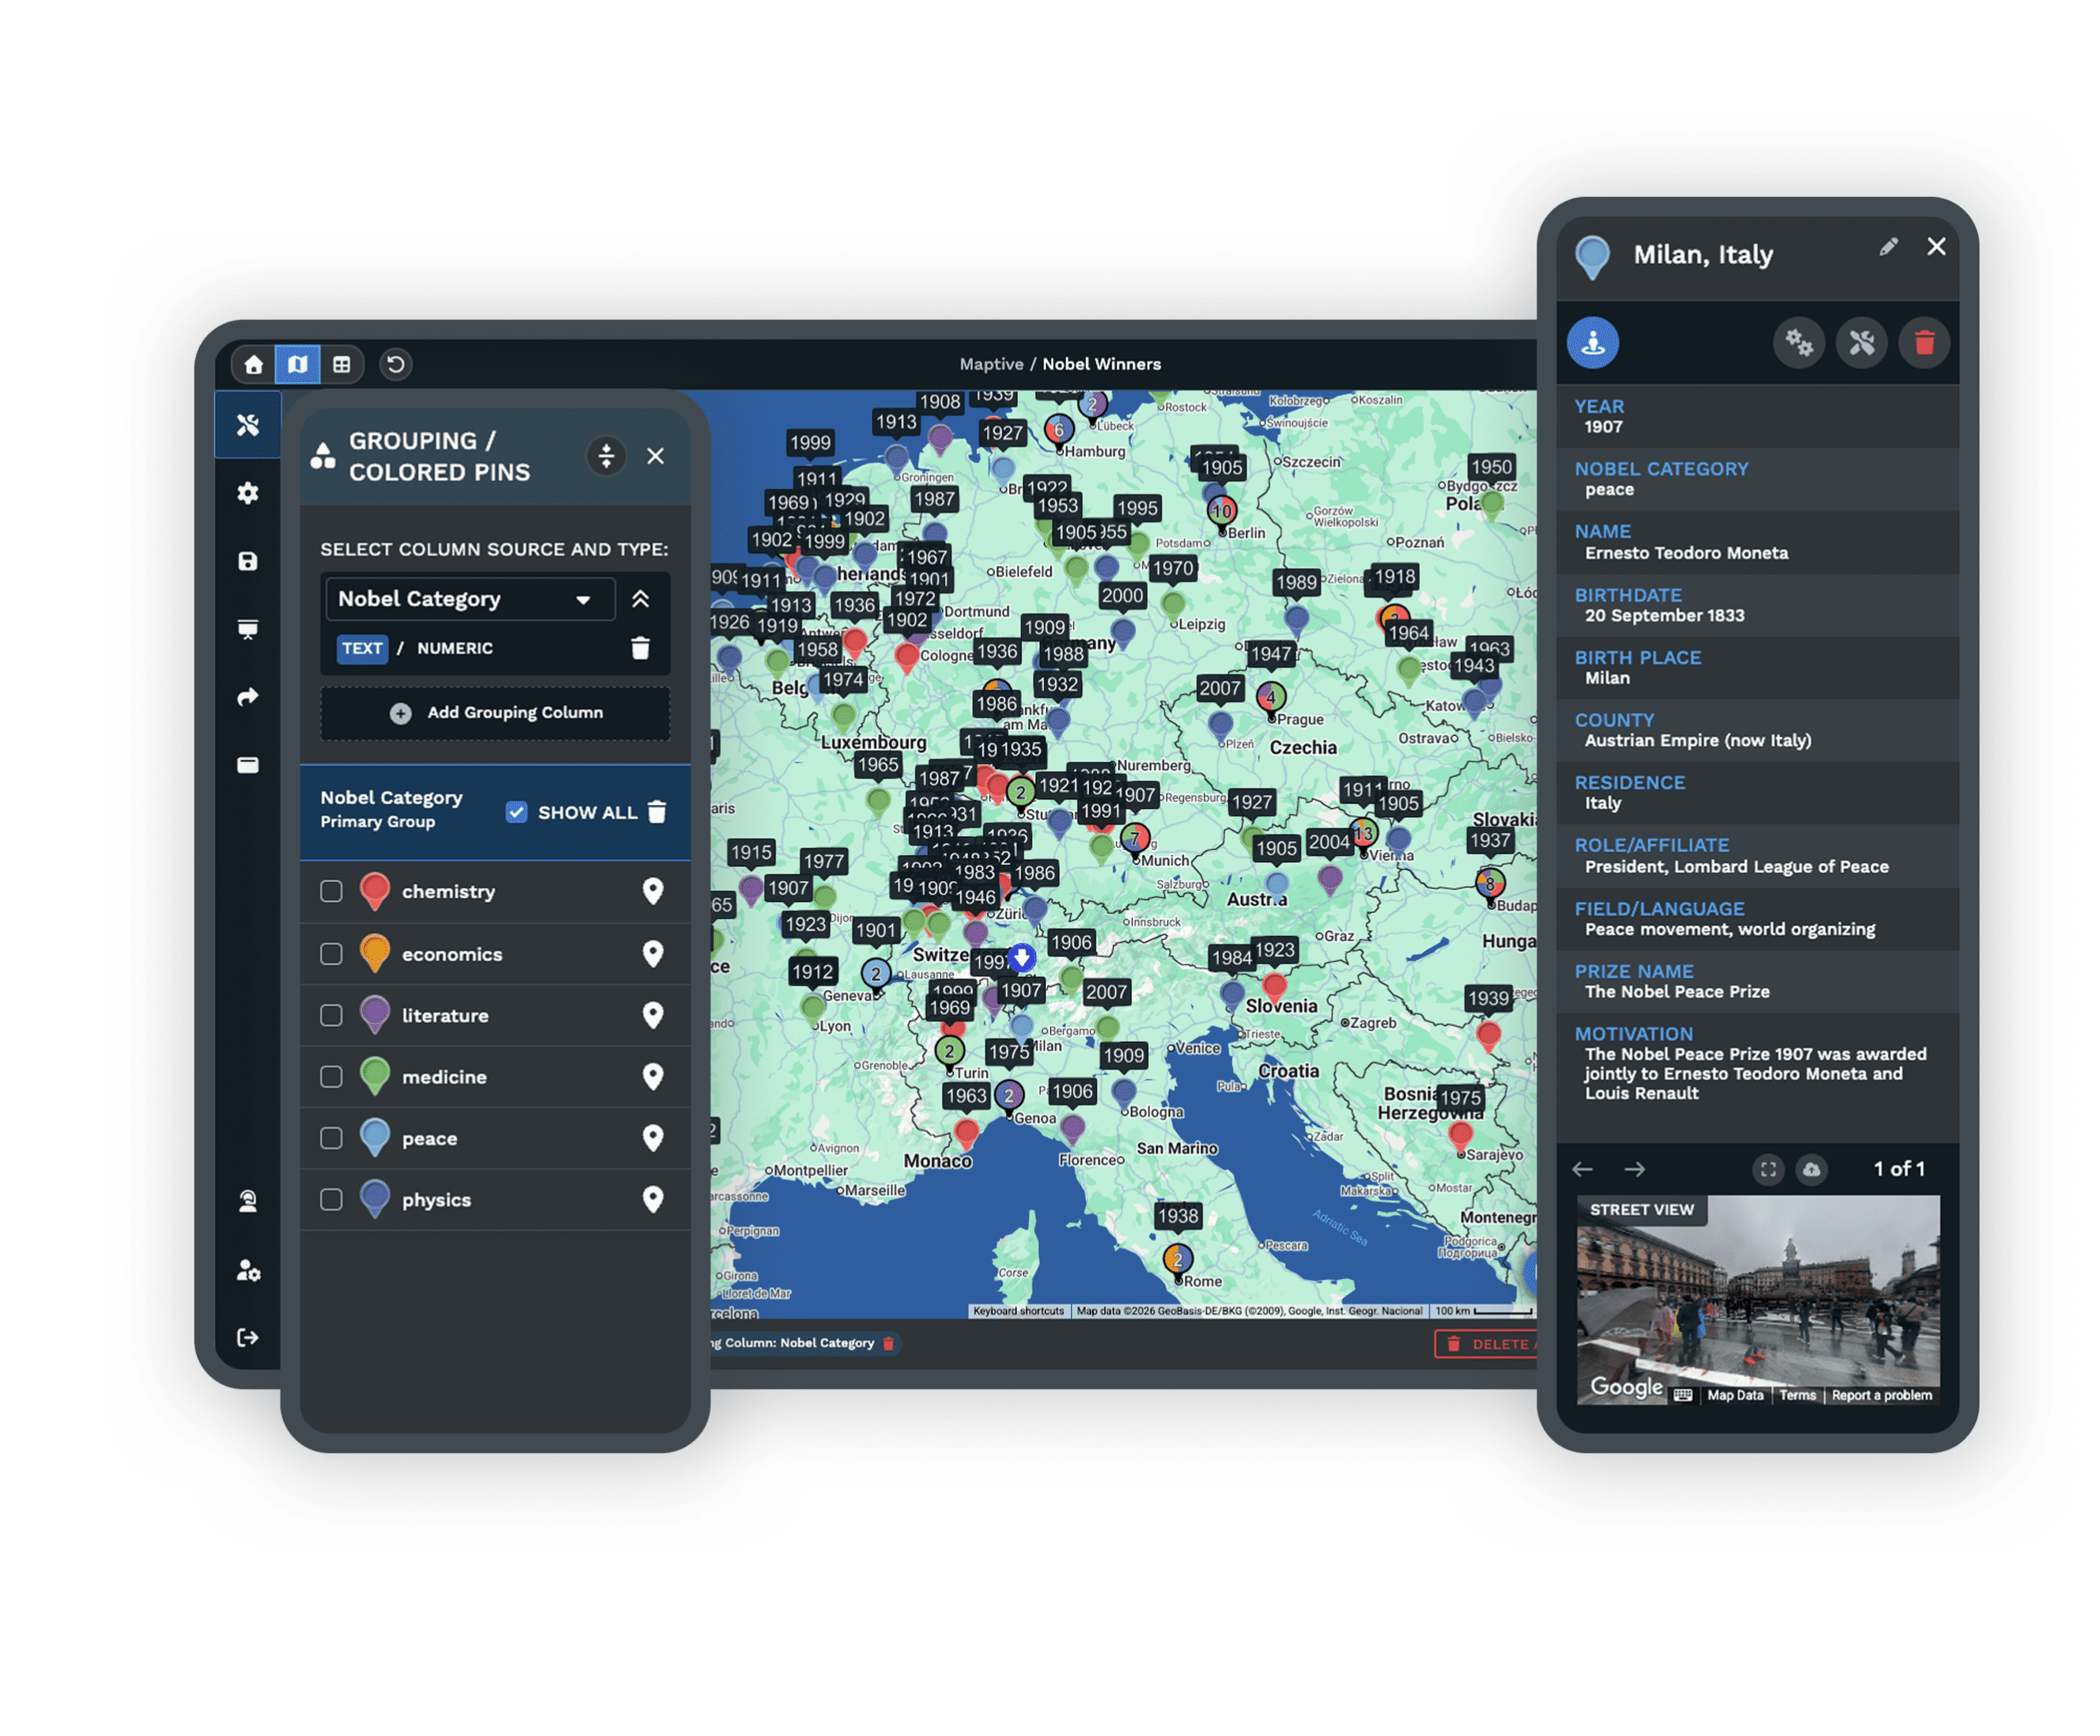
- Color-code & filter by any field
- Spot clusters rows hide
- Plot any spreadsheet on a map
- Layer 50+ US Census variables
- Heat maps reveal hotspots
- Radius & drive-time rings
- Color-code & filter by any field
- Spot clusters rows hide
Trusted by teams at


Gains Teams See From Location Data
Census and market layers sit on the same map as your records, so the read that took days takes an afternoon.
Seeing volume by geography exposes the regions carrying twice the load of the ones beside them.
Targeting effort where demand concentrates, rather than across a flat map, lifts the response rate.
Reading a Market by Location
| 01 | Plot Your Data on a Real MapDrop in an Excel file, a CSV, or a Google Sheet and up to 200,000 records appear on an interactive map. The geocoding engine corrects messy addresses and missing ZIP codes as the data loads. |
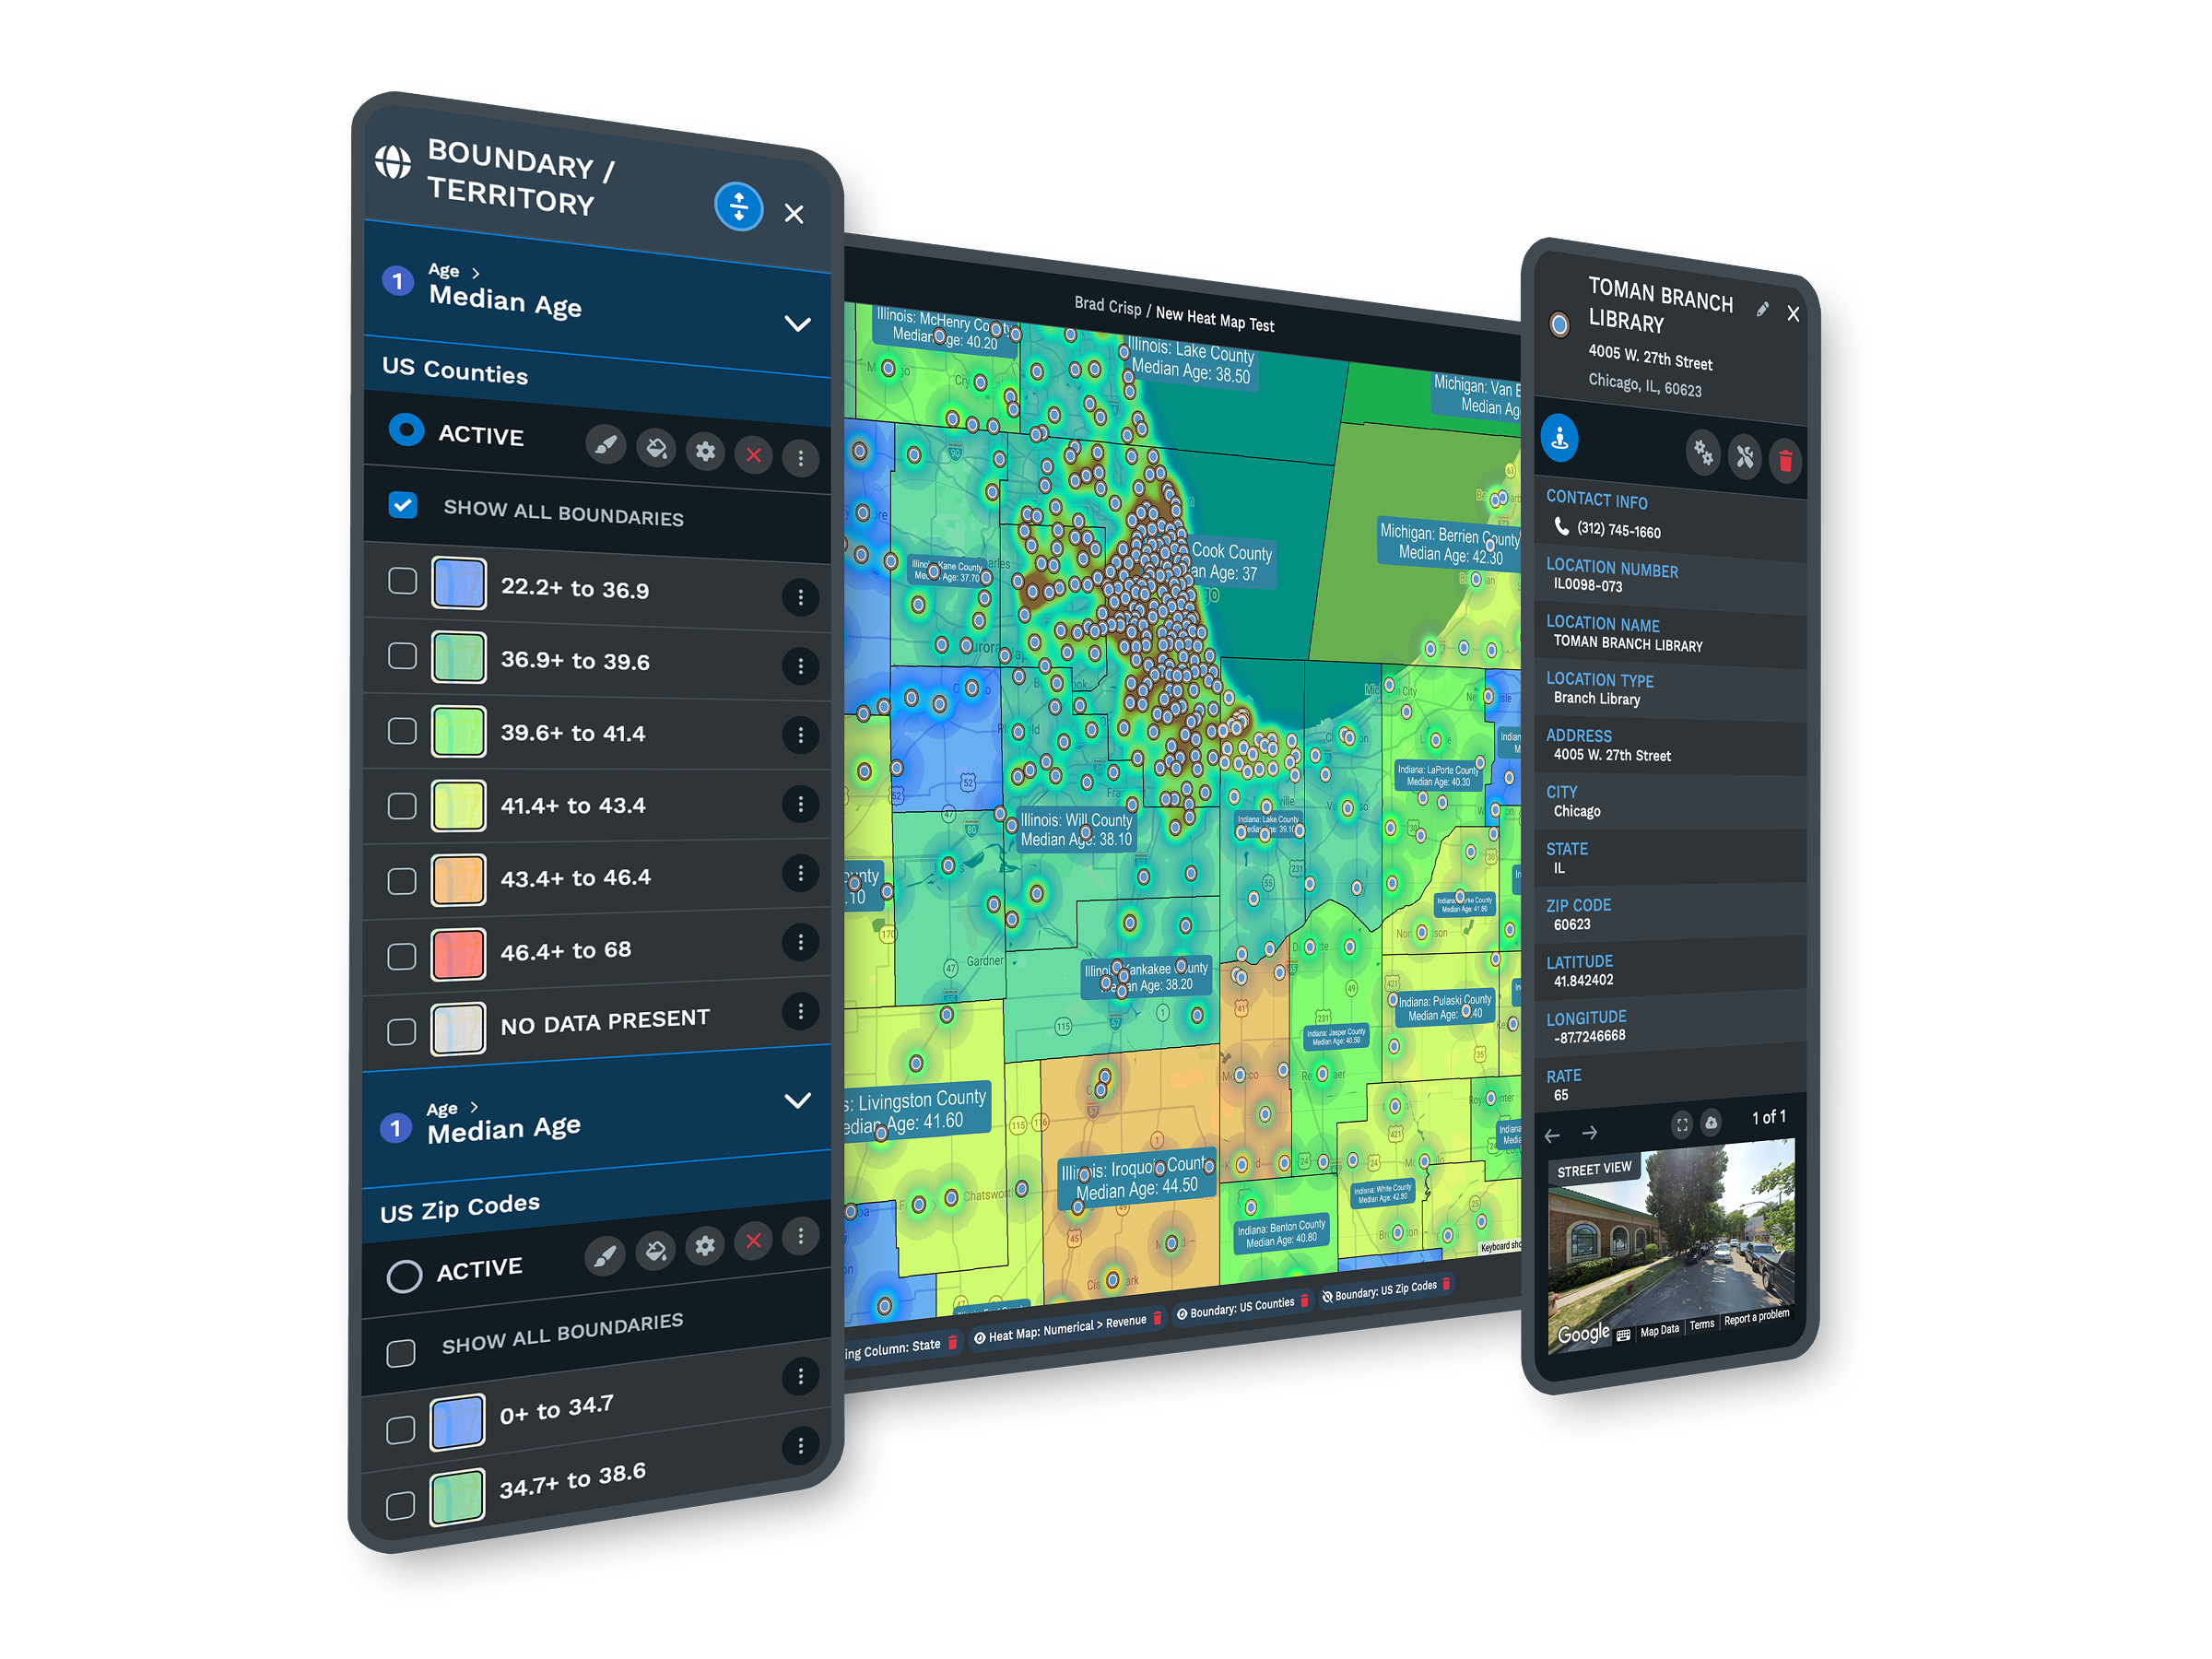
| 02 | Census Demographics Under Every PinMore than 50 census variables, from household income to population density, sit under each record at five geographic levels. A growing library of market data categories adds spending and household detail alongside them. |
| 03 | Heat Maps for ConcentrationWeight any numeric column by sales, account count, or value, then tune the radius until the clusters your team has been missing show plainly on the map. |
| 04 | Drive-Time Polygons for ReachDraw service areas on real road networks, so a 25-minute window means a 25-minute drive. Stack them around current and proposed sites to see where coverage overlaps or leaves a gap. |
| 05 | Shared Views Without Full AccessSend a password-protected link with the tools and data columns you choose to expose. Leadership reads the recommendation without a login, and partners see only what you want them to. |
Turning Records Into Decisions
From Raw Records to a Defensible Read
A spreadsheet tells you how much each account is worth. It cannot tell you that your best customers cluster in three ZIP codes while a fourth, with the same income profile, has no coverage at all. Maptive gives that view from one upload. The first map is ready in minutes, and from there the analysis grows in layers, with demographics and market data bringing context down to the block group so each record reads against the market around it rather than in isolation.
Reading Performance Against Demand
The point of location intelligence is a decision someone can defend in a planning meeting. Instead of ranking accounts by revenue alone, you measure each one against the demand around it. A region pulling strong numbers in a thin market is performing better than a region pulling the same numbers where the market potential is far higher. That comparison only appears when your performance data and the market data sit on the same screen, and it is what reorders a list of priorities into a plan.
Proven Across Government and the Fortune 500
Enterprise Teams Already Mapping
Amazon, General Electric, Coca-Cola, and the US Department of Energy run their spatial work on Maptive, each after its own security review. The same platform serves a small operations team and a global enterprise, with no analysis locked behind a higher tier.
Built on Proven Infrastructure
Maptive runs on Google Maps Platform infrastructure with WebGL rendering, so a map with 200,000 markers stays responsive while you work. Census data refreshes from official US and Canadian government sources, and 256-bit SSL, single sign-on, and role-based access protect what you upload.
Expert Help With Messy Data
Pulling a clean answer from a large, messy dataset is slow work on your own. The US and Canada support team picks up the phone, chat, or email in under 15 minutes, with a 9.7 out of 10 rating, and stays with your team through the first map.
Free trial, full platform, no credit card
Try Location Intelligence Free
Start a ten-day free trial with no credit card. Upload a spreadsheet, paste from your clipboard, or sync a live Google Sheet, and a working map is ready before the meeting ends. Every analysis tool is unlocked from the first login, so you can test location intelligence against your own data rather than a demo set.
Walk Through Your Own Data With Us
If you would rather see the platform applied to your own records first, a Maptive specialist will load a sample of your data and show the demographic, heat-map, and drive-time tools working on it. This suits teams running a structured evaluation or needing sign-off before a trial. Bring the questions your analysts and IT reviewers will ask, and the session answers them against your real data.
Explore Every Location Intelligence Workflow
The many ways teams turn a spreadsheet into a decision they can defend, each on the same Maptive map.
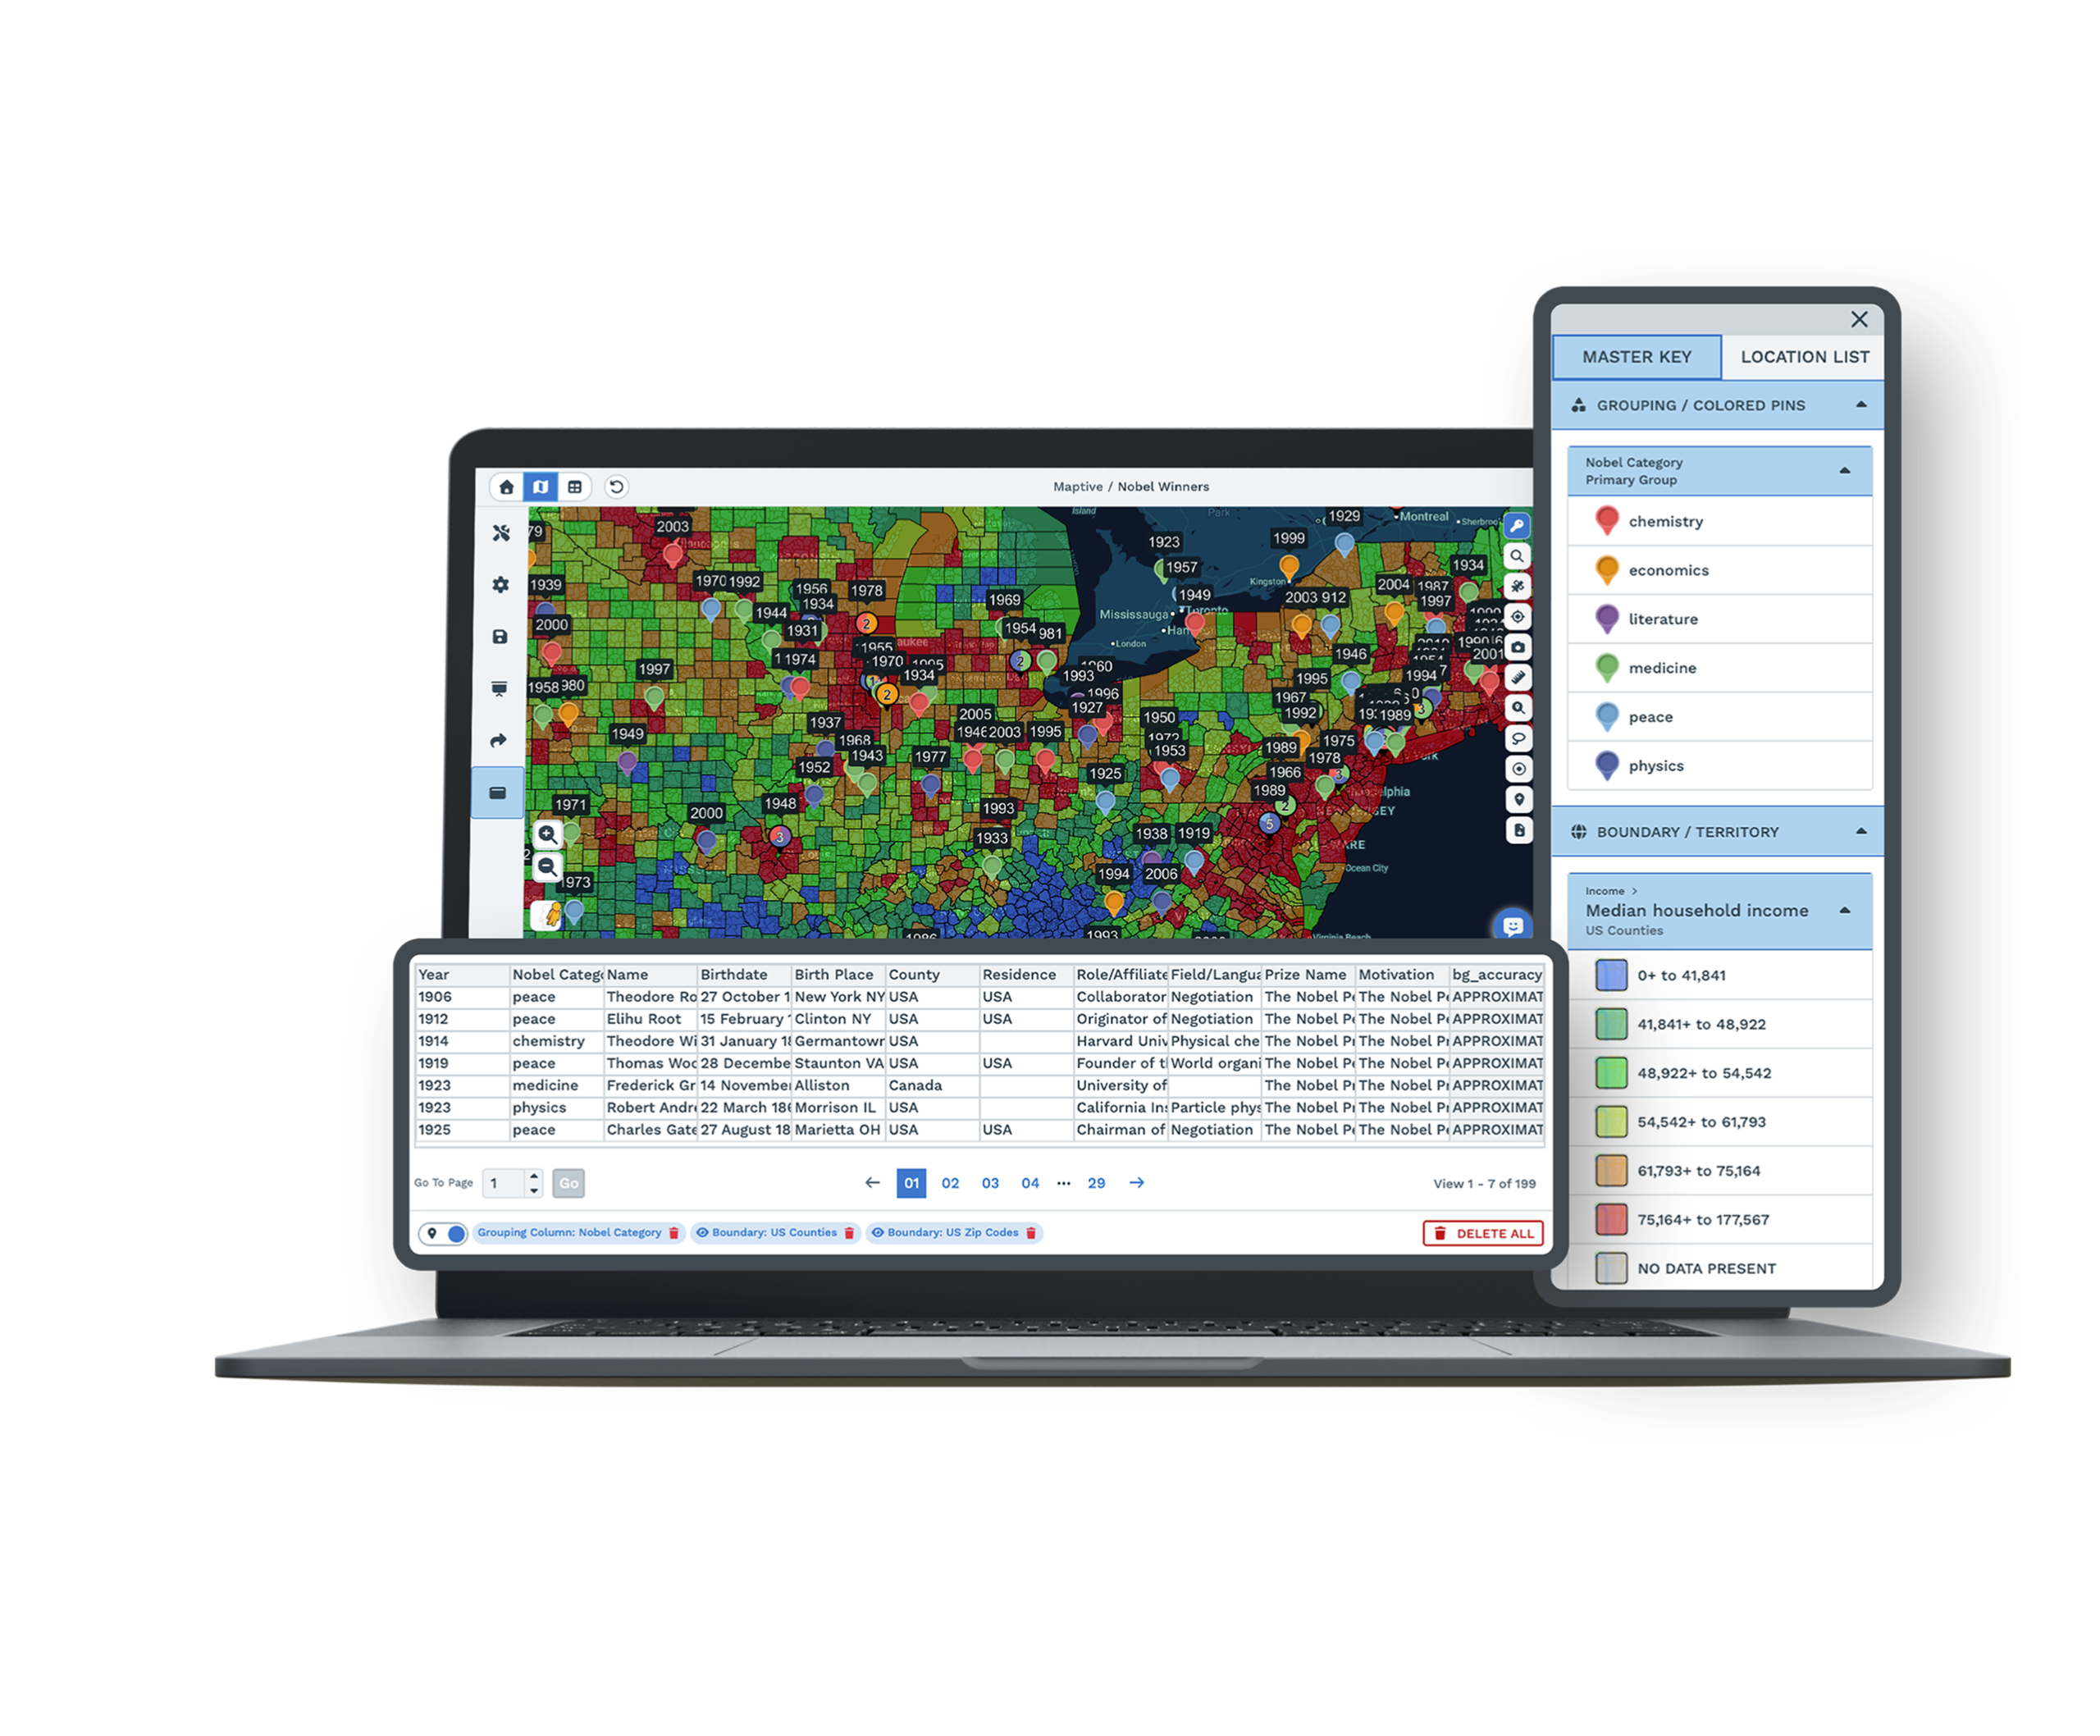
Overlay Census Demographics
Shade ZIP codes, counties, or states by income, age, or population around your accounts.
Learn more →Shade a Choropleth Map
Color ZIP codes, counties, or states straight from a numeric column in your spreadsheet.
Learn more →Customer Density Heat Map
Drop a smooth density gradient over your points to read where customers concentrate.
Learn more →Find Market Gaps
Shade every ZIP by your best-customer profile, then read the same-profile areas with no coverage.
Learn more →Layer Multiple Datasets
Stack a boundary fill, a heat map, and colored pins on one map and toggle each layer.
Learn more →Demographics in a Radius
Drop a radius or drive-time area and read the census population and income inside it.
Learn more →Define a Trade Area
Turn a set of ZIP codes or counties into one named catchment and read who is inside.
Learn more →Map Competitor Overlap
Plot your sites and theirs on one map to read overlap, saturation, and white space.
Learn more →Presentation-Ready Maps
Export a clean PNG or PDF with the interface stripped, ready to drop into a slide.
Learn more →Branded Investor Deck Maps
Build print-ready, brand-colored maps of a target's footprint for a CIM or pitch deck.
Learn more →Compare Two Markets
Ring two candidate towns, read the demographics inside each, and compare them number by number.
Learn more →Count Facilities in a Radius
Count hospitals, clinics, or dealers inside any radius and shade a market by density.
Learn more →Sales-Weighted Heat Map
Weight the heat by a revenue column so the hot spots follow value, not head count.
Learn more →Map Your Workforce
Heat-map where employees live and count who falls inside the drive-time of each office site.
Learn more →Sentiment Gradient Map
Turn scaled survey scores into a smooth gradient that reads how an area is leaning.
Learn more →Crime & Incident Hotspots
Heat incident data into hotspots and count what falls within a radius of each site.
Learn more →Disease Prevalence Map
Plot case data as dots, heat, and shaded regions to read local positivity at a glance.
Learn more →Ad Inventory Demographics
Shade the ZIP codes under your billboards and stations by income or ethnicity.
Learn more →ZIP Micro-Segments
Drop below the ZIP boundary and shade each tract by income and age to find sub-segments.
Learn more →Casino Player Analytics
Map carded-player revenue by geography with heat maps and revenue-shaded zones.
Learn more →Frequently Asked Questions
What is location intelligence software?
Location intelligence software puts your business data on a map and layers market and demographic data underneath, so you can read patterns by geography instead of scanning rows. Maptive plots your records, adds census and market context, and turns a flat spreadsheet into a view you can filter, analyze, and share. Sales, operations, and analytics teams use it to decide where to expand, where coverage is thin, and where demand sits unserved, all without a GIS department.
How is location intelligence different from location analytics?
The two overlap, and the difference is mostly emphasis. Location analytics describes the techniques, such as measuring distance, density, or trade-area overlap. Location intelligence is the wider practice of turning those measurements into business decisions, like where to open or how to balance coverage. Maptive covers both on one platform. The analytical tools run on your data, and the map presents the result in a form leadership can act on without interpreting a statistical model.
How does location intelligence software work?
You upload a spreadsheet, and Maptive's geocoding engine converts addresses into map coordinates, correcting messy formatting and missing ZIP codes as it goes. Your rows become interactive markers you can filter, color-code, and query. From there you layer census and market data, draw trade areas or territories, and run heat maps or drive-time analysis. The whole sequence happens in the browser in one session, so a raw file becomes a working analysis within minutes of signing in.
What is location intelligence used for?
Teams use it to answer geographic questions their internal reports cannot. Retailers pick store sites, sales operations balance territories, logistics teams plan routes and facilities, insurers read risk concentration, and marketers target spend by demand. The common thread is a decision that depends on where, not only how much. Maptive supports all of these on one platform, which is why a single tool can serve very different departments inside the same company without a separate purchase for each.
Do I need GIS skills to use Maptive?
No. Maptive is built for business teams, not GIS specialists. You upload a spreadsheet, the platform geocodes it, and the analysis tools work through a plain interface with menus instead of code. Most users have a working map and a first answer within their opening session, and support is on hand to set up the first analysis. The point is to put spatial analysis in the hands of the people who own the decision.
What demographic and market data can I layer onto a map?
Maptive includes more than 50 US Census variables at state, county, ZIP, tract, and block-group levels, covering household income, population density, age, and household composition, with Canadian data as well. The census data is included on every plan. A growing library of market data categories, drawn from a long-standing data partnership, adds spending and household detail alongside it. That lets you read each record against the market around it instead of treating every location as the same.
How many locations can I map at once?
A single Maptive map holds up to 200,000 markers, rendered with WebGL so the view stays responsive as you pan and zoom. Your full customer base, prospect list, and site portfolio load together rather than splitting into regional batches. That capacity matters for location intelligence, because the patterns you are looking for, like clusters and coverage gaps, only appear when the whole dataset sits on one screen rather than across separate files.
Can Maptive connect to my CRM?
Yes. You can import data from any CRM through an Excel or CSV export, and Maptive also offers direct integrations that keep maps current as records change. That means the customers and prospects on your map match the same accounts your team manages day to day. Your CRM remains the system of record for contact details, while Maptive becomes the layer that shows where those accounts sit and what the market around them looks like.
Is my data secure in Maptive?
Yes. Maptive runs 256-bit SSL encryption in transit and at rest, two-factor authentication, single sign-on, role-based access controls, and audit logging, with regional data-storage options and 99.9% uptime across 2025. It has passed the Salesforce AppExchange security review, and enterprises with strict procurement requirements, including Amazon and the US Department of Energy, have already approved it. Permissions can be set down to the individual user, so each person sees only the data they should.
How do I get started with location intelligence?
Start a ten-day free trial with no credit card, then upload a spreadsheet, paste from your clipboard, or connect a live Google Sheet. The geocoding engine plots your data, and a working map is ready within the first session, with every tool unlocked. You can also book a demo to see the platform applied to your own data first. Either way, the barrier to a first insight is a file you already have, not a long setup.

