


Layer Multiple Datasets on One Map & Toggle Layers
Can I put sales and ad spend on the same map, then turn each layer on and off? Maptive stacks a boundary fill, a heat map, and colored pins on one map, so you move between sales, ad spend, customers, and competitors without building a new view for each.
No credit card required
- Stack a boundary fill for sales by ZIP, a heat map for ad spend, and colored pins for customers against competitors on one map.
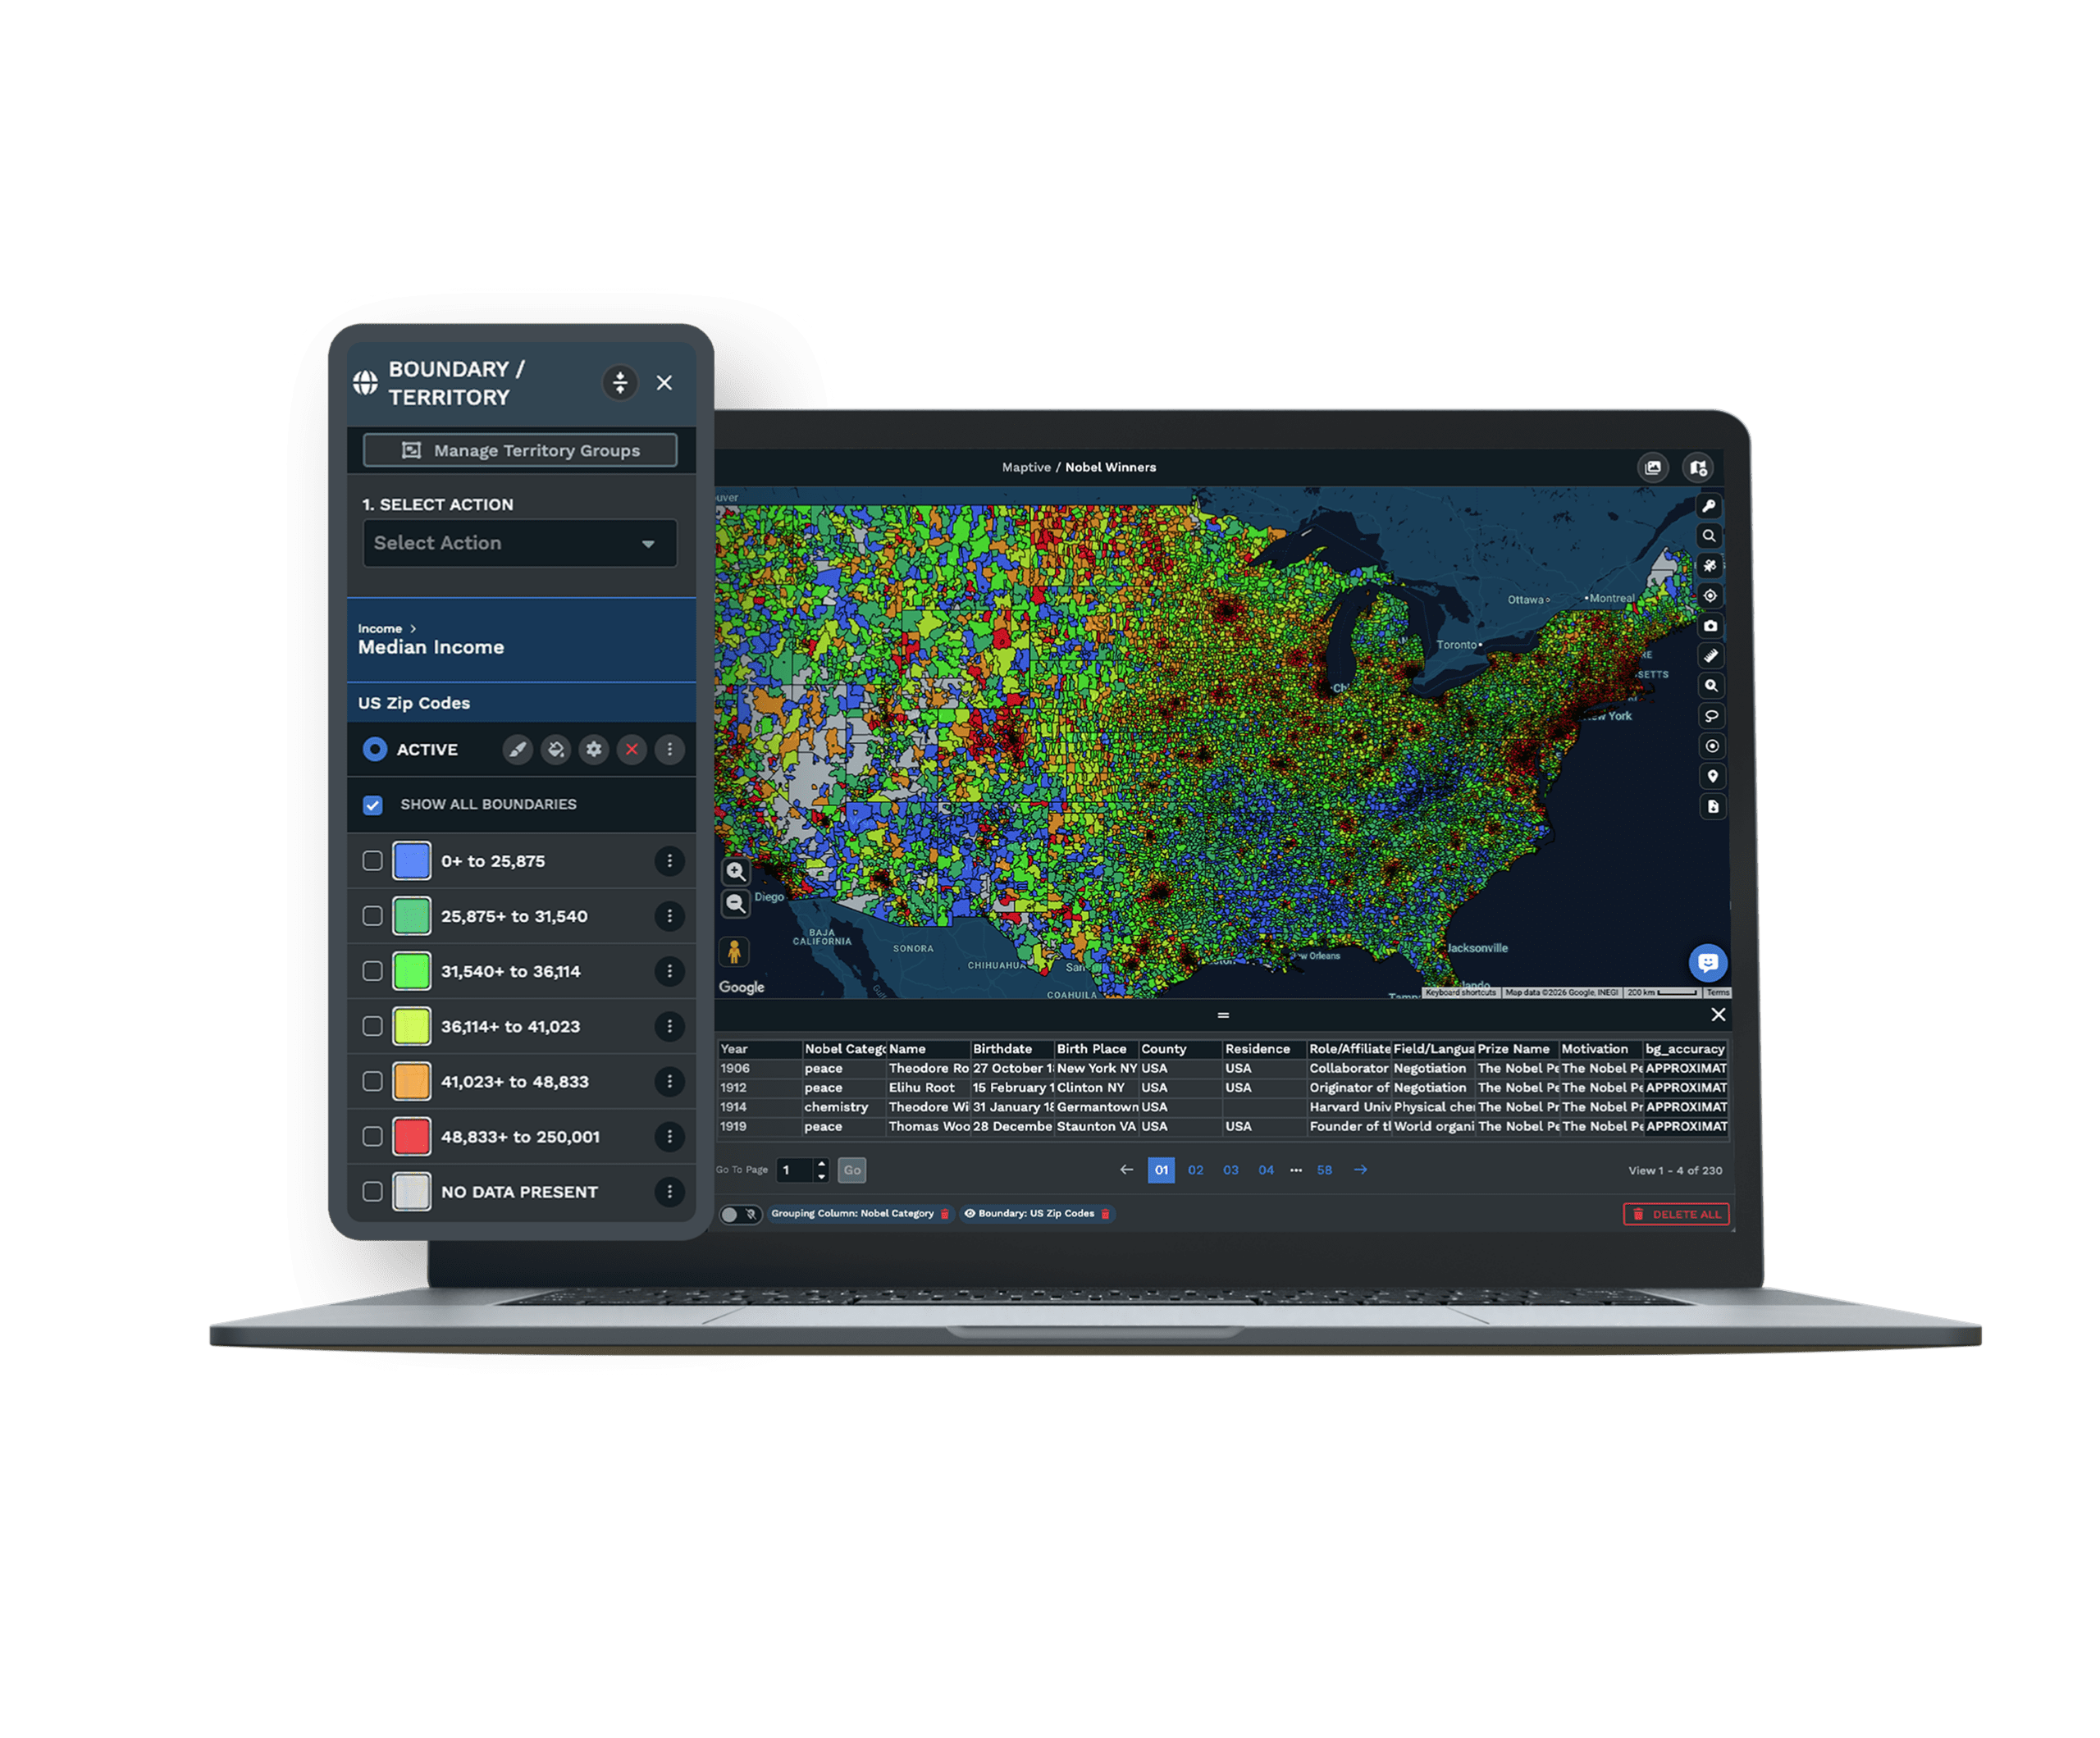
- Add more than one fill to the same boundary set, then switch the active fill without redrawing the map.
- Hide or show any layer with the eye icon, so you compare two datasets or read one on its own.
- Set opacity per layer so a fill underneath reads through the pins and heat map on top.
- Group by a category column to color customers one way and competitors another, with a legend built for you.
- Pull the markers from one map onto a boundary or heat map built on another.
Trusted by teams at









Read Two Datasets Against Each Other
The seamless integration with Google Maps makes the customization totally efficient and the output familiar and easily presentable.
Building It in Maptive
-
1
Add the First Fill in the Boundary Tool
In Map Tools, open the Boundary Tool, pick a boundary set such as ZIP Codes or city areas, and set the fill to My Numerical Data. Choose a function like Sum and a column like Sales, then click Load Boundaries to shade every region by that number.
-
2
Stack a Second Fill on the Same Set
Open Customize Fills and choose Add More Fills, then build a second fill on ad spend for the same boundary set. Only one fill shows at a time, and the active-fill indicator switches between sales and ad spend without redrawing the map underneath.
-
3
Layer a Heat Map and Colored Pins
Open the Heat Mapping Tool for a weighted read of ad spend, then use the Grouping Tool to color customers and competitors from a category column. Set opacity on each layer so the fill below reads through the heat map and pins on top.
-
4
Toggle Layers On and Off
Each tool lists its layers with an eye icon, so you hide or show the boundary fill, the heat map, or any pin group as you compare. The Filter Tool narrows the markers, and an Ignore Filters toggle holds a data fill steady while you filter the points above it.
Put Your Layers on One Map
Start the 10-day free trial with no credit card and stack your own datasets on a single map. Upload sales, ad spend, customers, and competitors, then toggle each layer to find where they line up. Want a hand? A Maptive specialist will stack the first few layers with you and set the opacity so each one reads.
No credit card required
Frequently Asked Questions
Can I put sales and ad spend on the same map?
Yes. In the Boundary Tool, build one fill for sales with My Numerical Data, then open Customize Fills and choose Add More Fills to build a second fill for ad spend on the same boundary set. Only one fill shows at a time, and the active-fill indicator switches between the two without redrawing the map. That lets you read sales by ZIP one moment and ad spend the next, on the same regions. You can also print one metric in the color and a different one on the label with Custom Value.
How do I overlay two data sets and turn layers on and off?
Build each dataset as its own layer, then use the eye icon next to each one to hide or show it. A boundary fill, a heat map, and a group of colored pins each keep their own controls, so you turn the heat map off to read the fill, or hide the pins to compare two fills. Opacity on each layer sets how much of the layer below reads through. Nothing rebuilds when you toggle, so switching views takes a click rather than a fresh import.
Can I map customers versus competitors together?
Yes. Put both sets of points on the map, add a column that marks each row as a customer or a competitor, then open the Grouping Tool and group by that column. Maptive colors customers one way and competitors another and builds a legend for the two. Add a boundary fill for sales or demand underneath, and you read your own coverage against the competition in one view. Hide either pin group with its eye icon when you want to read one side on its own.
How many layers can I stack on one map?
You can add several fills to one boundary set, run more than one heat map, and color points into groups, all on the same map. On a boundary set, fills stack and show one at a time through the active-fill indicator, while heat maps and pin groups render together with their own opacity and eye icons. A map holds up to 200,000 markers, so a dense customer and competitor set stays on one view. Keeping opacity moderate on each layer keeps a busy map readable.
Can I control the opacity of each layer?
Yes. Every layer has its own opacity control, so you set a boundary fill lighter to let pins and heat read through it, or raise a heat map so its hot areas come forward. In Fill Settings, each range of a boundary fill takes its own color and opacity. The Heat Mapping Tool sets radius, opacity, and intensity for the gradient. Tuning opacity per layer is how two or three datasets sit on one map without one hiding the others.
How do I toggle map layers on and off?
Each tool lists its layers in the side panel with an eye icon. Click the eye to hide the boundary fill, a heat map, or a pin group, and click again to bring it back. For fills on one boundary set, the active-fill indicator switches which fill shows, since only one appears at a time. None of this rebuilds the map, so you move between views as fast as you can click, which makes side-by-side reads of sales, ad spend, customers, and competitors quick.
Can I combine ZIP and city boundaries with my markers?
Yes. The Boundary Tool fills ZIP codes, counties, city areas, states, tracts, or block groups, and your markers stay on top of whichever set you choose. A boundary set holds one geography at a time, so you swap ZIP codes for city areas without a rebuild and the pins above stay put. Color the boundaries by your own numbers or by census data, then read the markers against them. That pairs a shaded read of the market with the exact points you plotted.
Can I layer data from two different maps?
Yes. Maptive can layer the markers from one map onto a boundary or heat map built on another, so a set of points you keep separate still reads against a shaded market. This holds two source files apart while you view them together. You control the opacity and the eye icon on each layer the same way you would inside a single map. That helps when customers live in one file and demand or competitor data is in another.
What tools does Maptive use to build layered maps?
Three tools do most of the work. The Boundary Tool shades regions by your numbers or by census data and stacks more than one fill on a set. The Heat Mapping Tool adds a weighted gradient for a metric like ad spend or revenue. The Grouping Tool colors points into groups, such as customers against competitors, and builds the legend. The Filter Tool narrows what shows, and an Ignore Filters toggle holds a data fill steady while you filter the points on top.
Do I need GIS skills to build a multi-layer map?
No. Each layer is a menu choice, so you stack fills, a heat map, and colored pins from dropdowns rather than code. You upload a spreadsheet, and Maptive geocodes messy addresses and missing ZIPs for you. Adding a layer, setting its opacity, and toggling it on or off are all clicks in the side panel. Most people have two or three layers on one map in their first session, and the US and Canada support team helps set up the first stack if you get stuck.








