Customizable Base Maps
Customizable Base Maps let you set the look of the canvas under your pins so your dataset reads the way you want it across audiences, from the boardroom to the field briefing.
Base Map Backdrop for Any Reader
Base Map Theme: A picker opened from the Base Map panel that shows every available map style. Hover, click, and the canvas under your pins swaps to the new look you chose.
Roads and labels: Toggles for visibility on highways, roads, highway labels, road labels, and other text so the canvas reads as detailed or as quiet as you want it to.
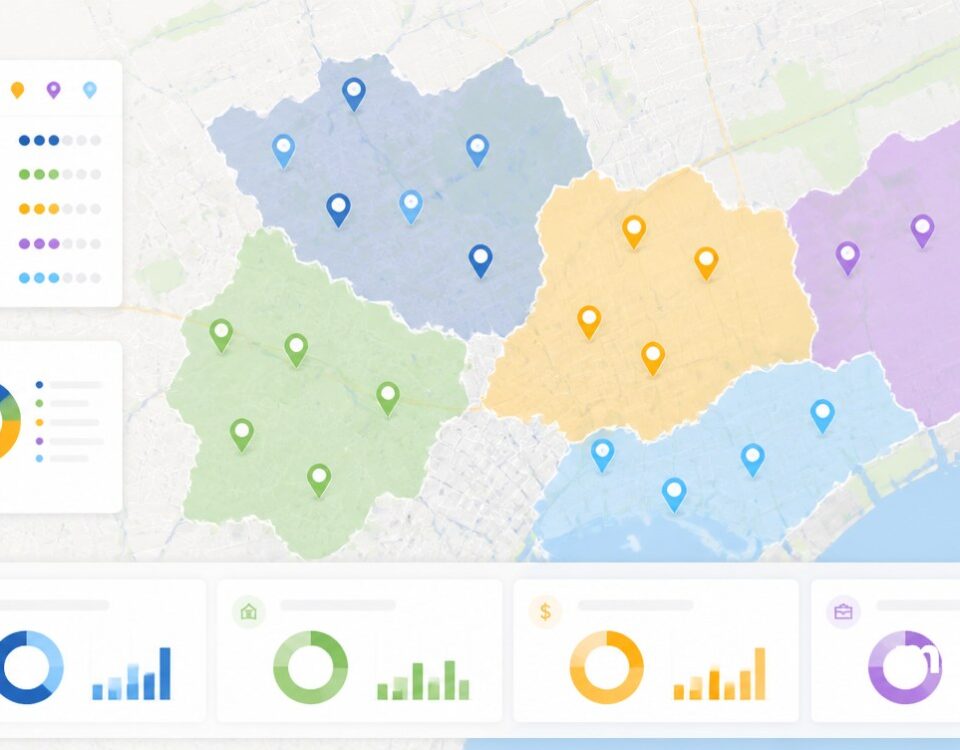
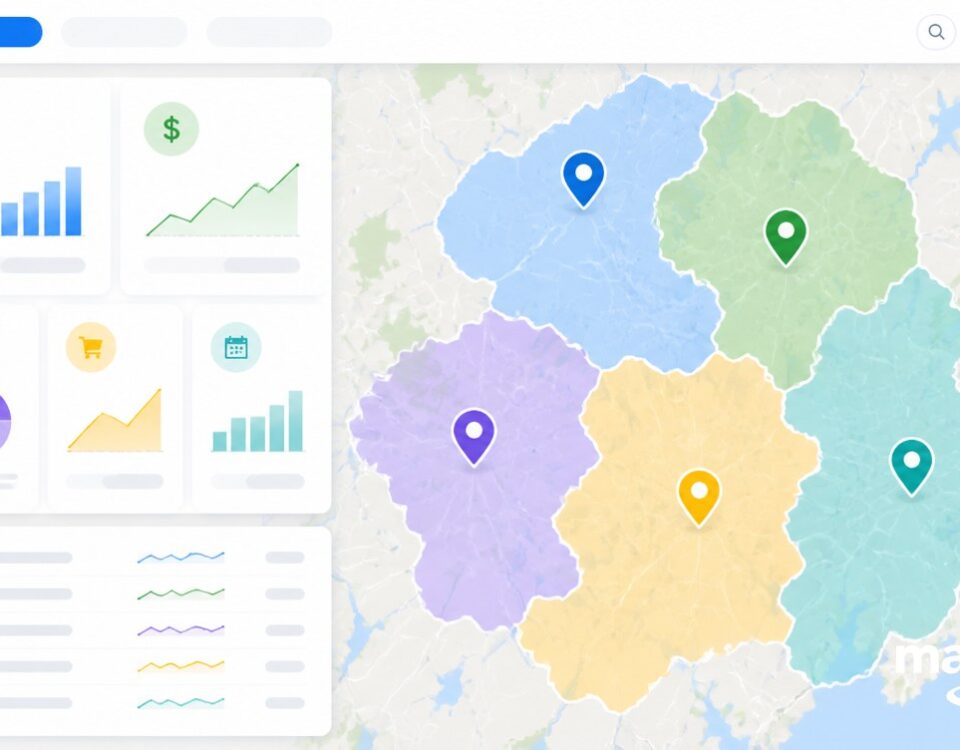
Color themes: Per-feature color controls for landscapes, roads, water, labels, landmarks, and points of interest, so the canvas can be matched to a brand or a report.
Detail density: Settings that govern how concentrated roads, landmarks, and labels appear on the map, so a dense city view can be thinned out for a cleaner output page.
Advanced Settings: A deeper menu reached from the Base Map panel for per-category control of Highway, Locality, and Points of Interest, with Geometric, Labels, and Text.
Reset: A button placed in the Base Map menu and in Advanced Settings that reverts every change back to the starting state, so a heavy edit is never a final move at all.
Pick Base Maps in 3 Steps
1
Open
Click the gear wheel icon in the upper left corner of your map to open Map Settings, then open the Base Map drop-down.
2
Pick
Click the Base Map Theme button, hover over each style preview, and click the option that fits your data and audience.
3
Apply
The canvas updates beneath your pins so markers, colors, and overlays all read against the look you chose for the day.
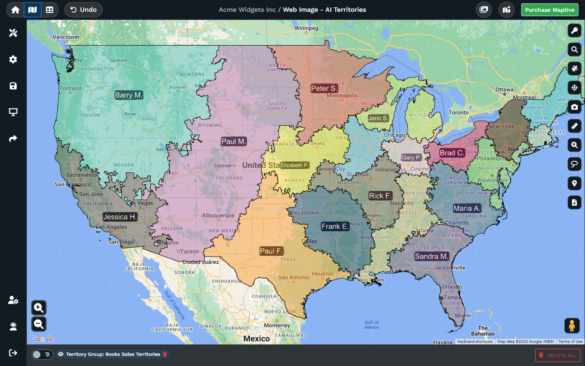
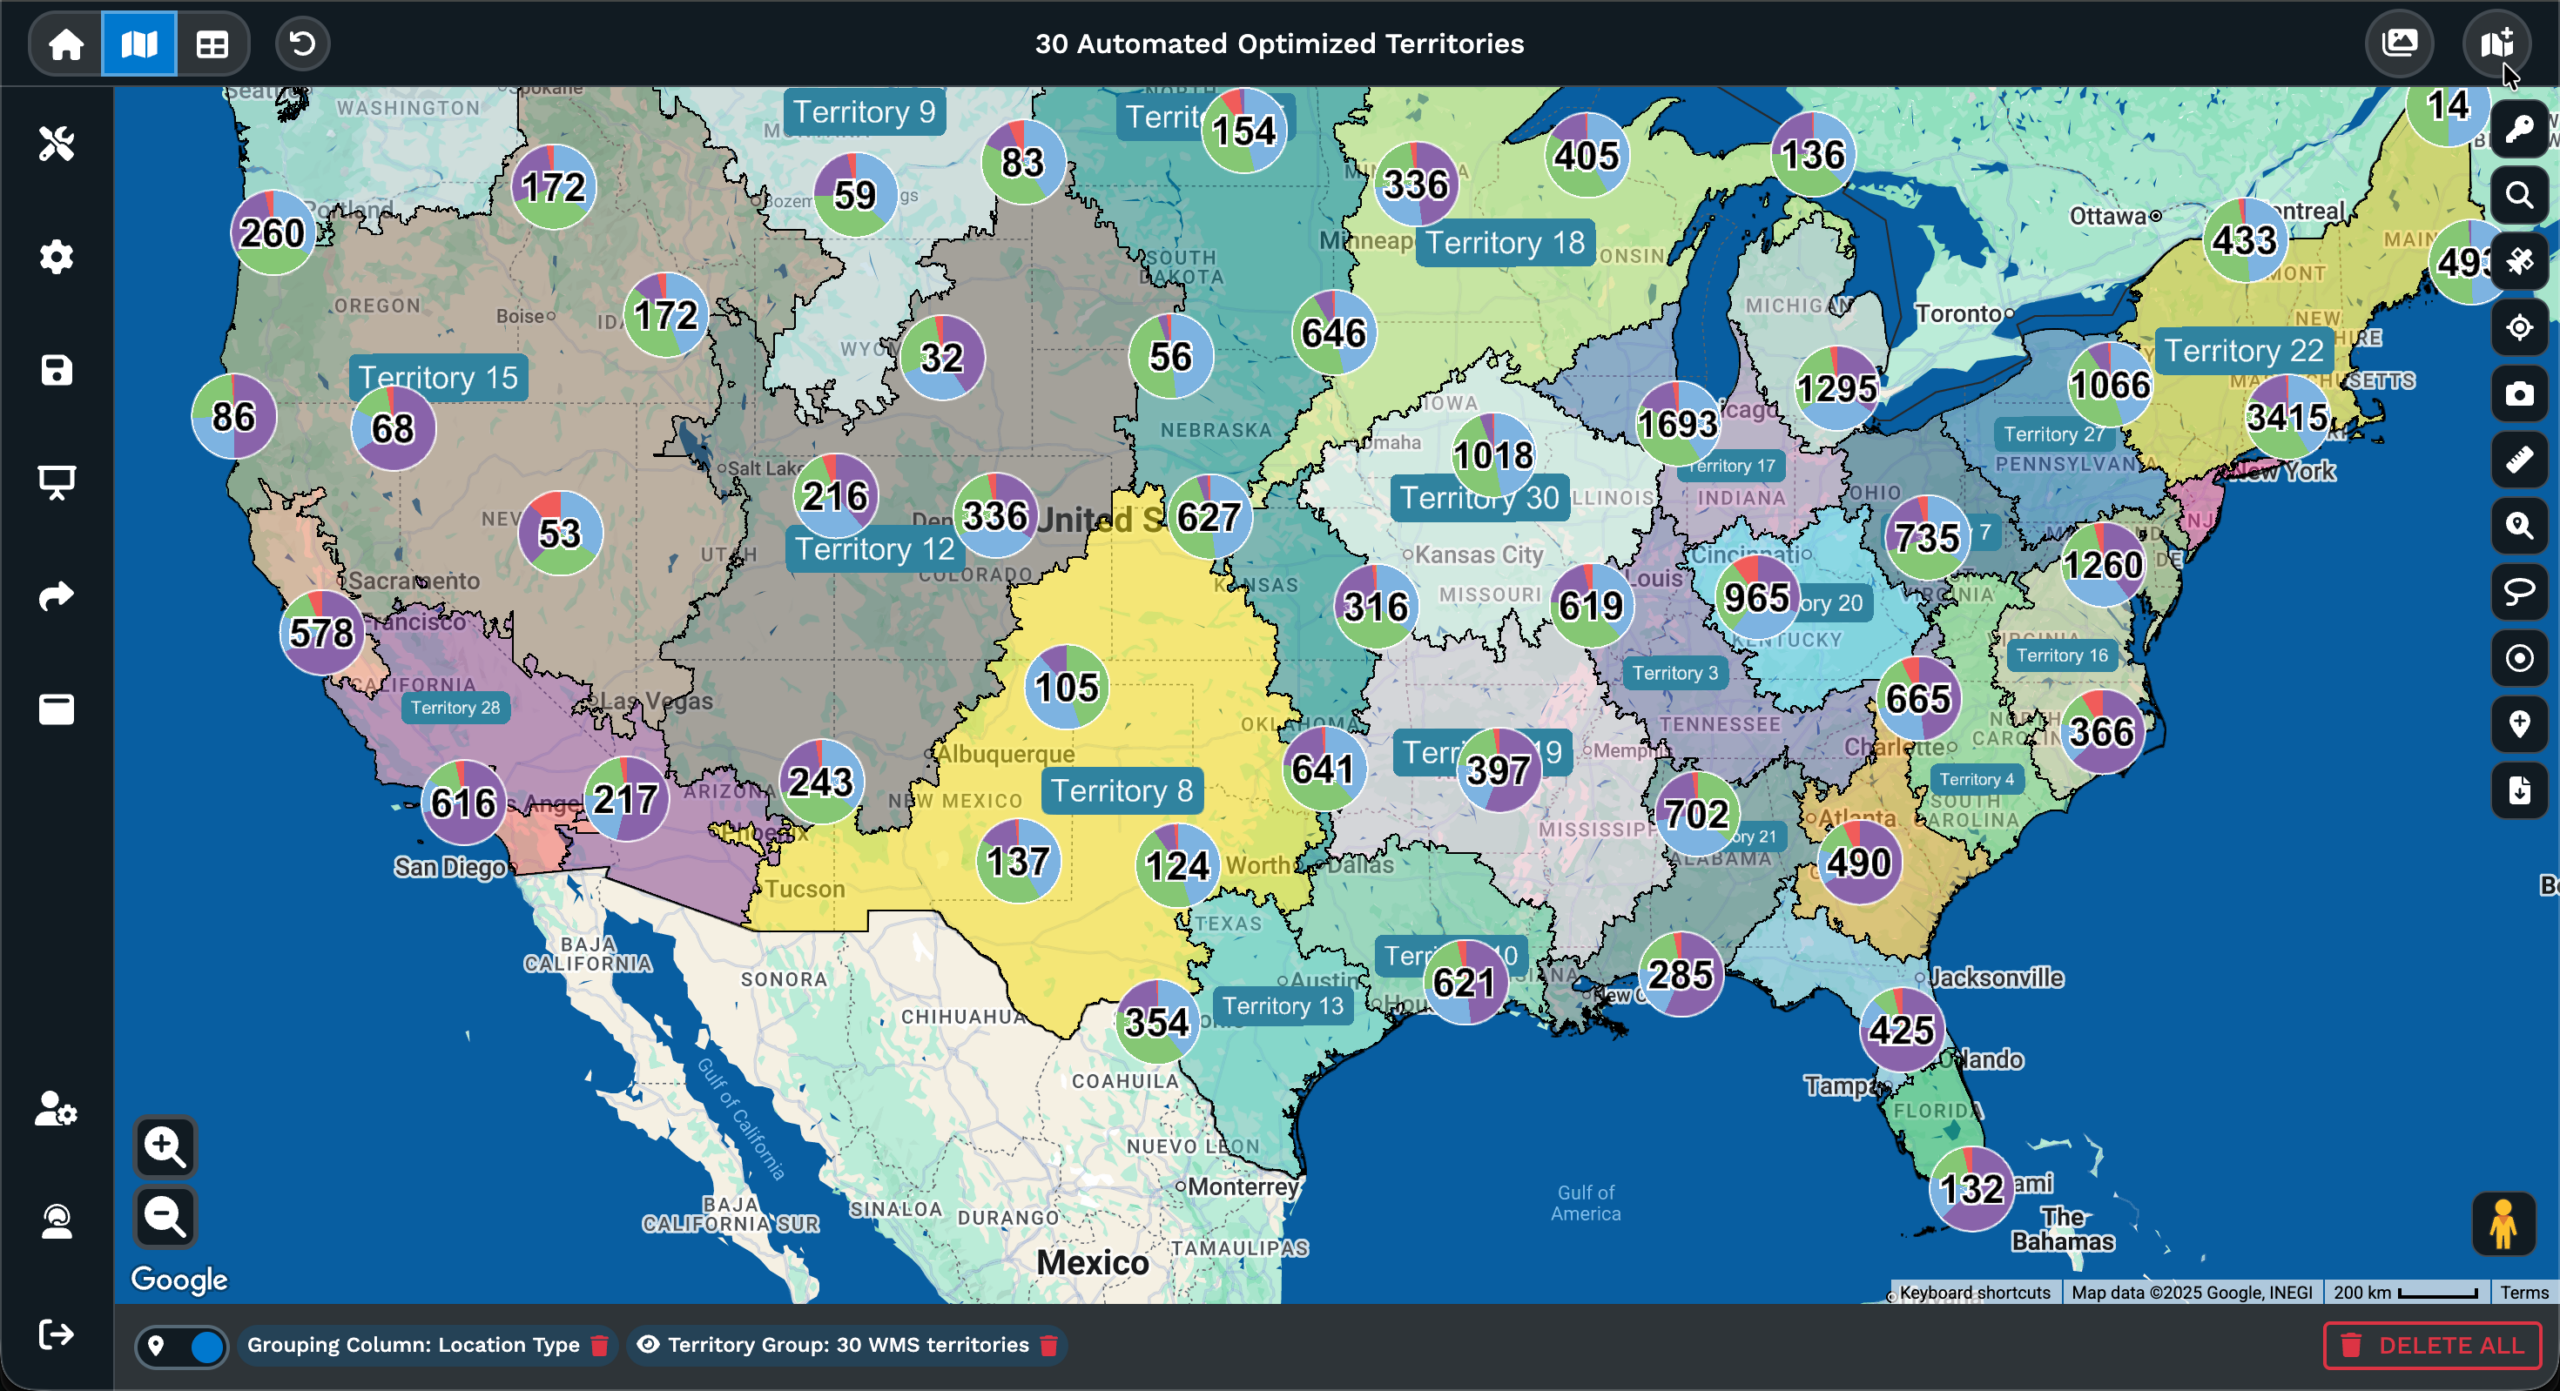
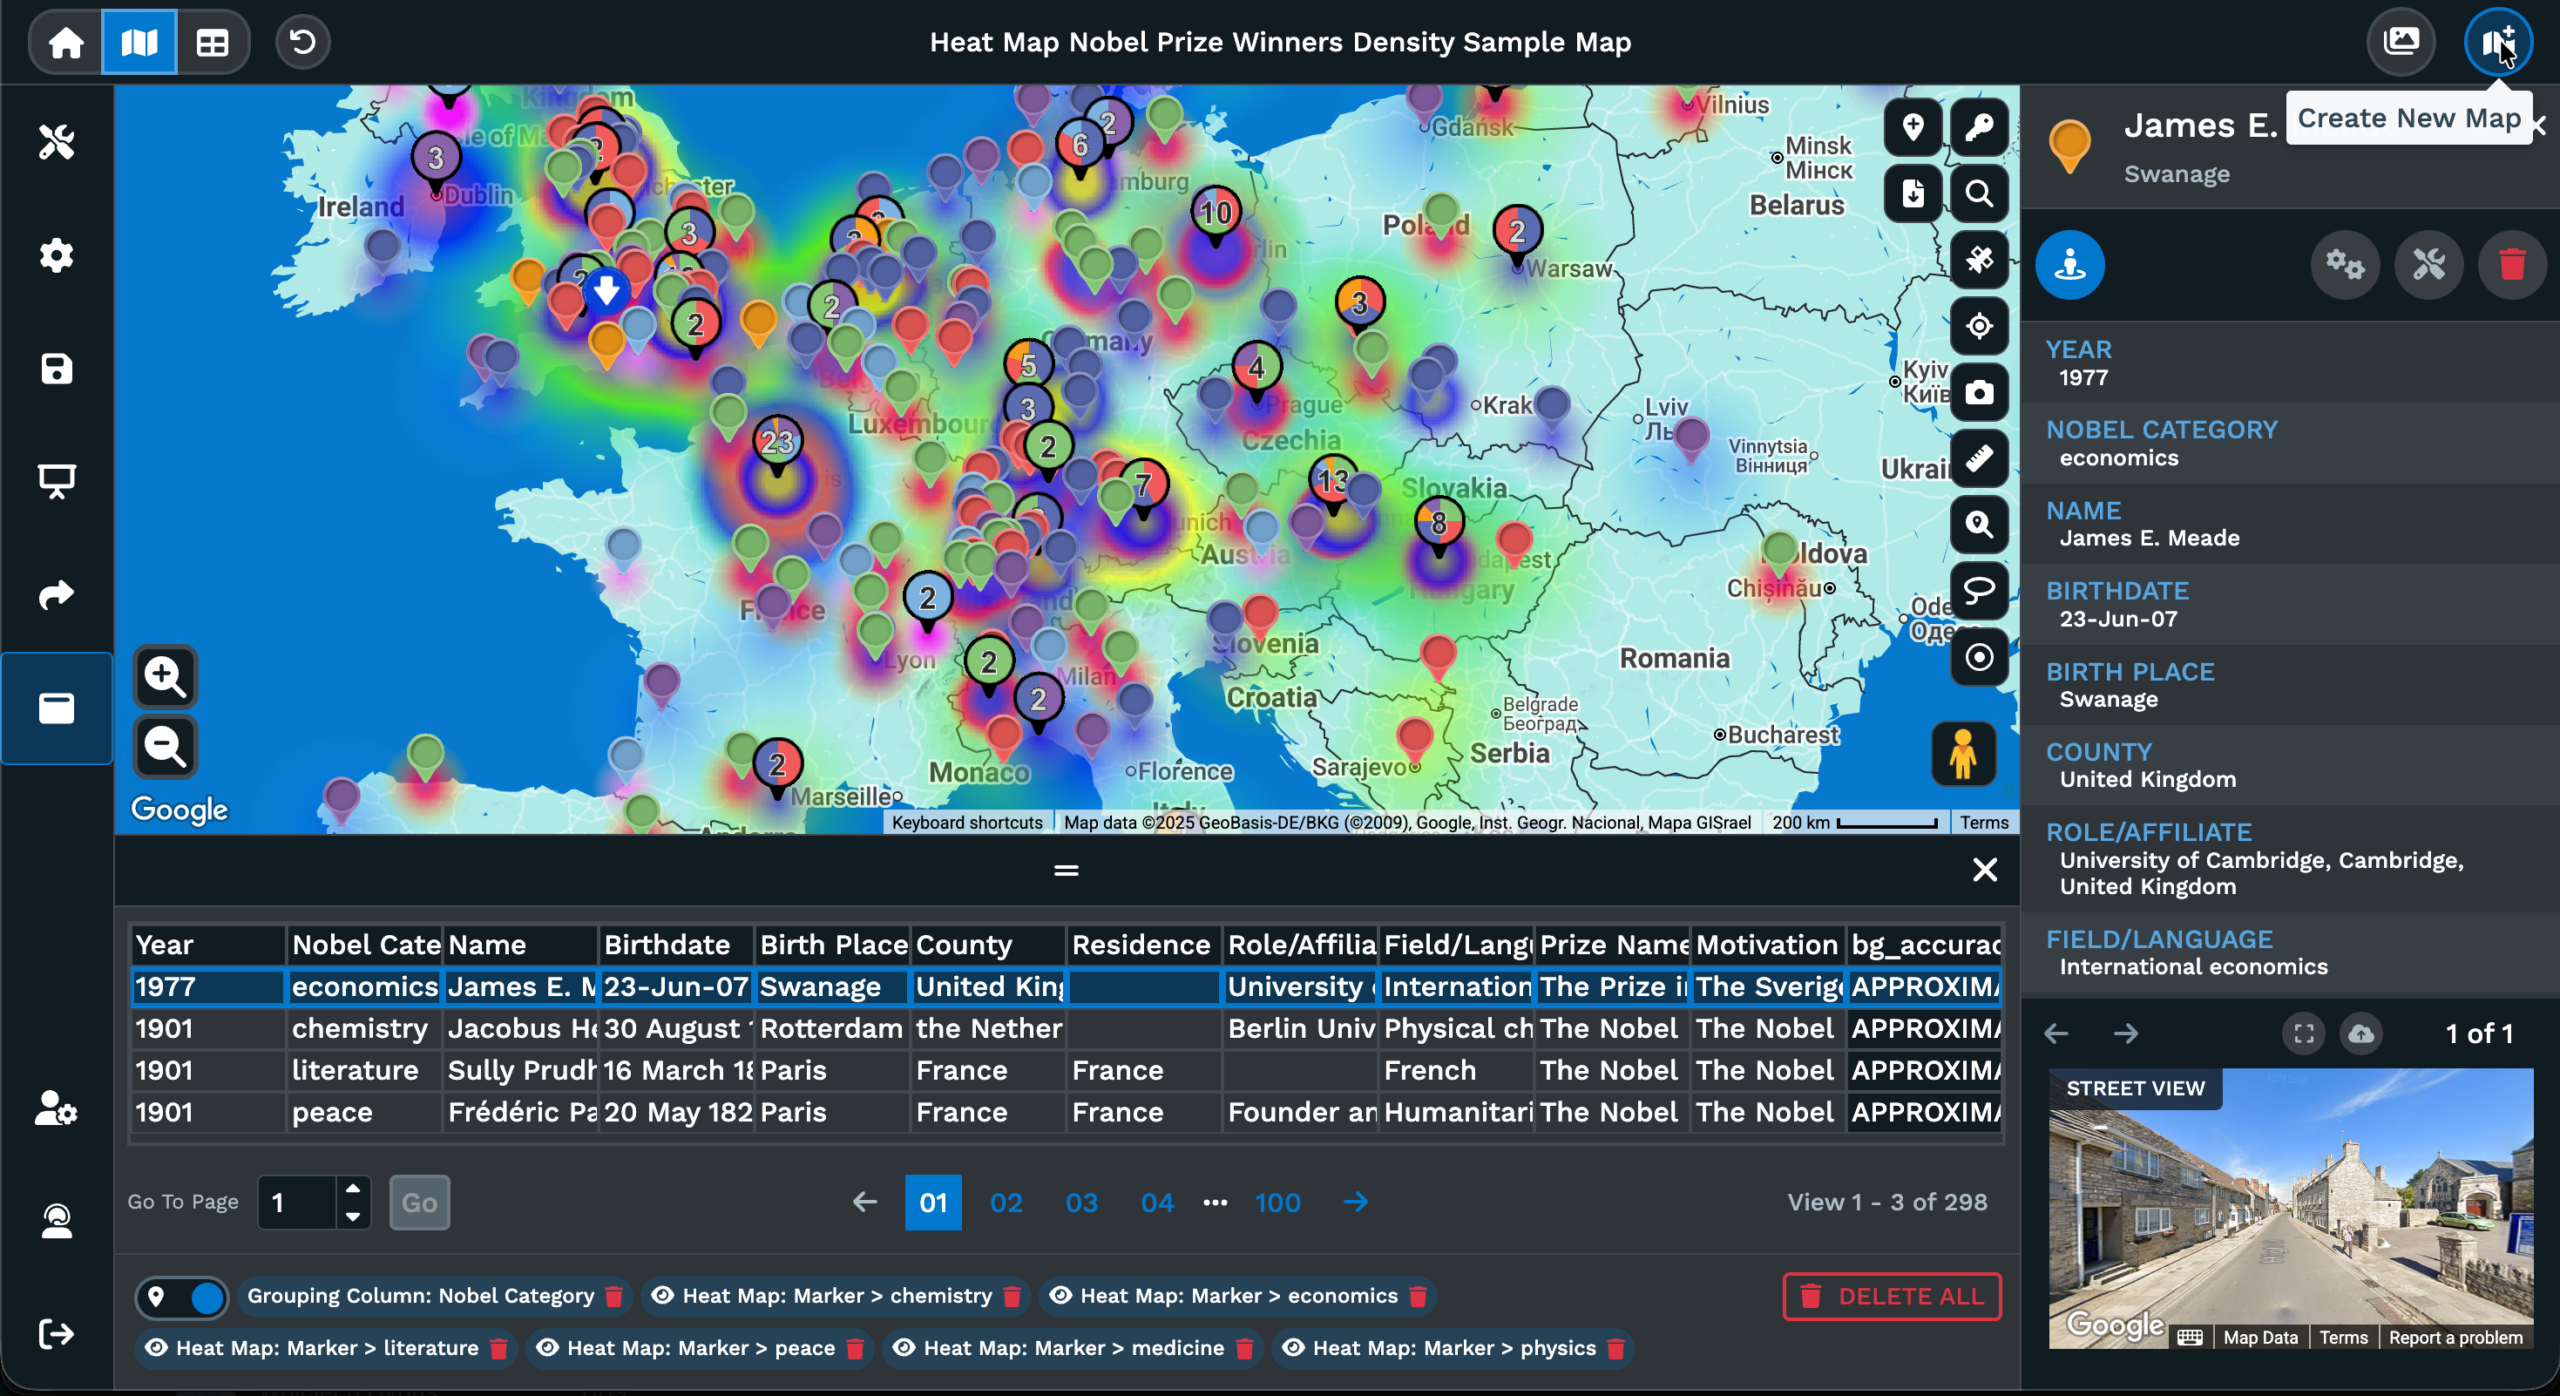
Dark Canvas For Decks
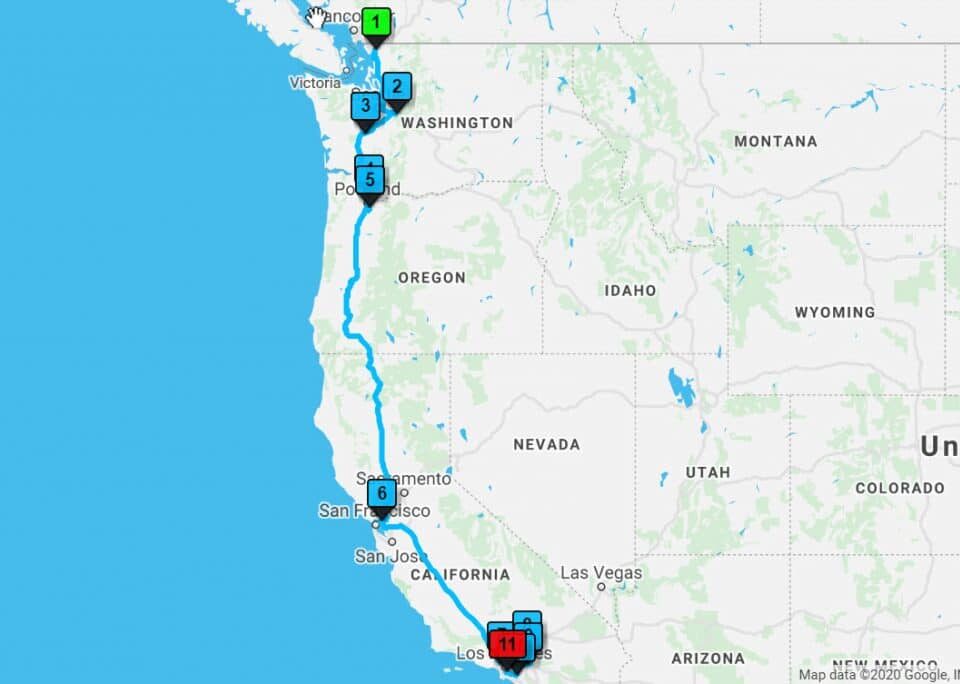
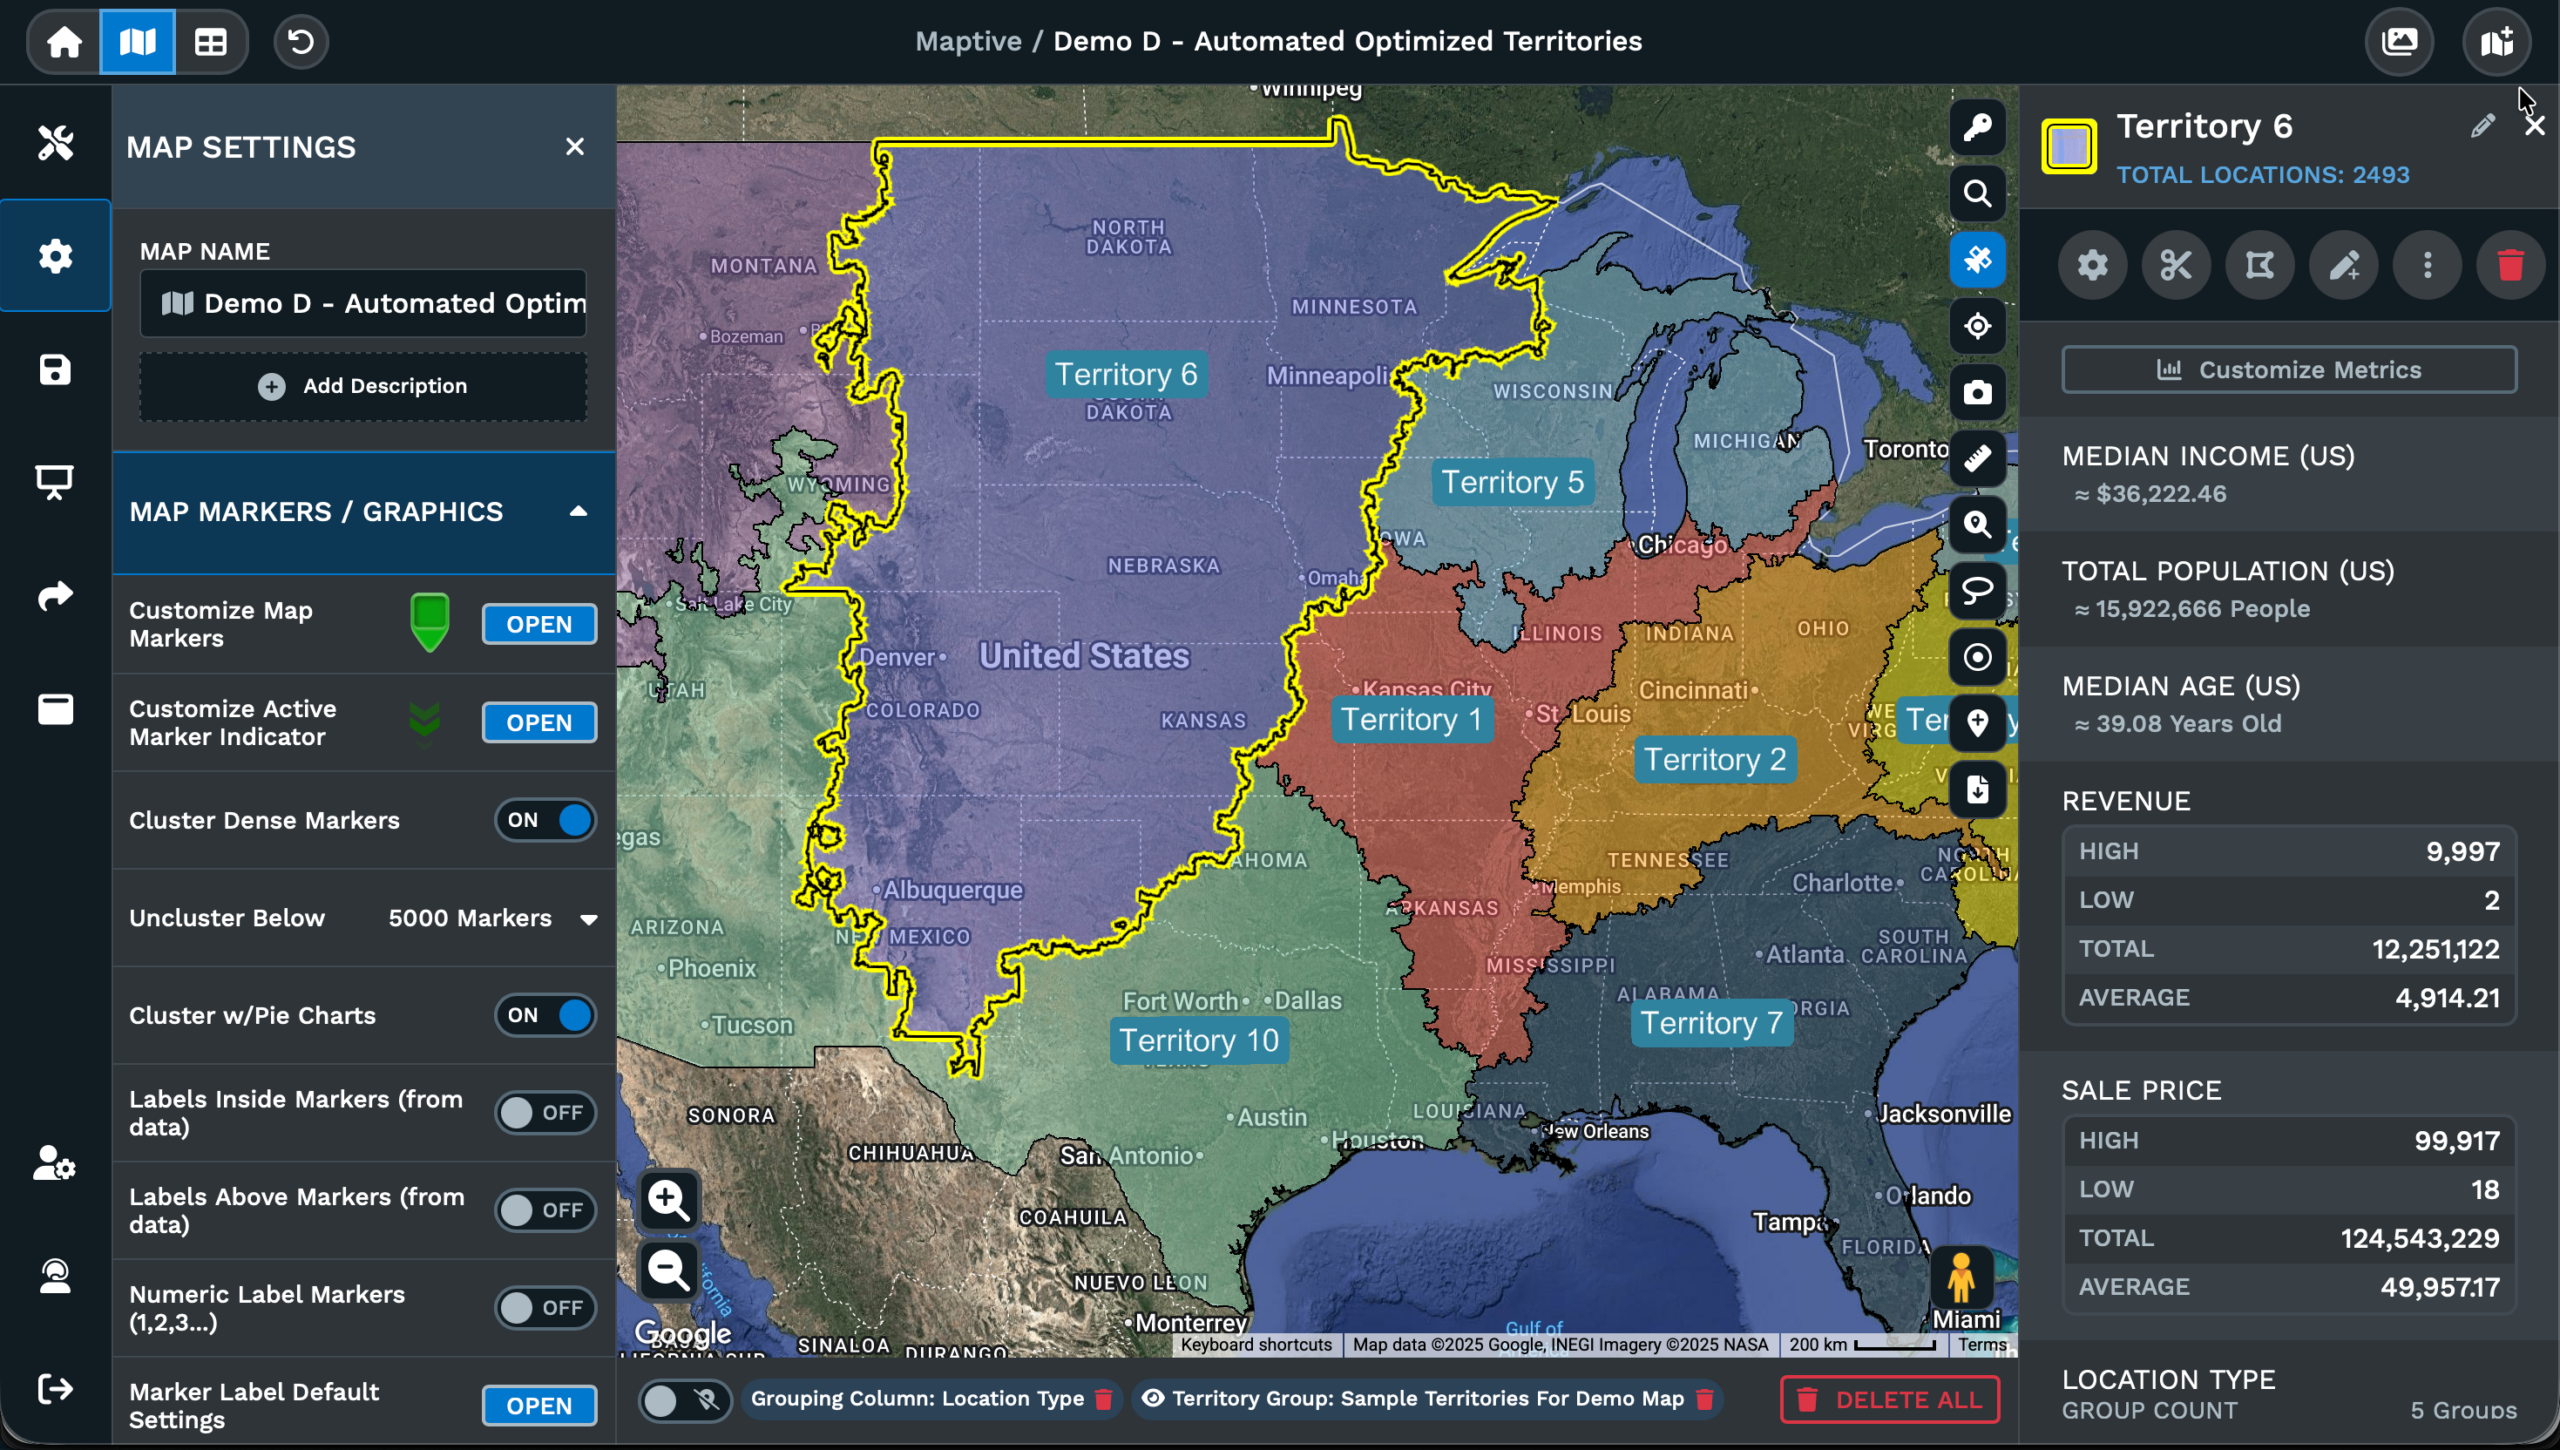
Terrain For Outdoor Work
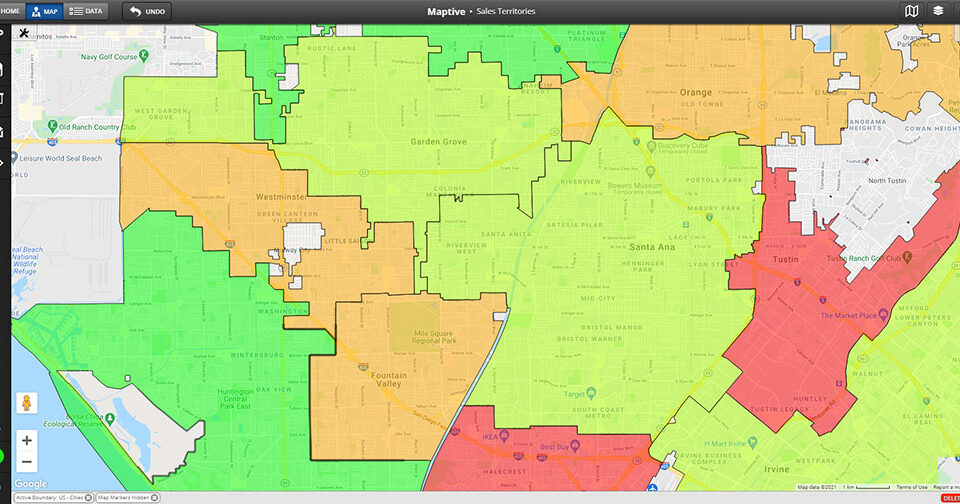
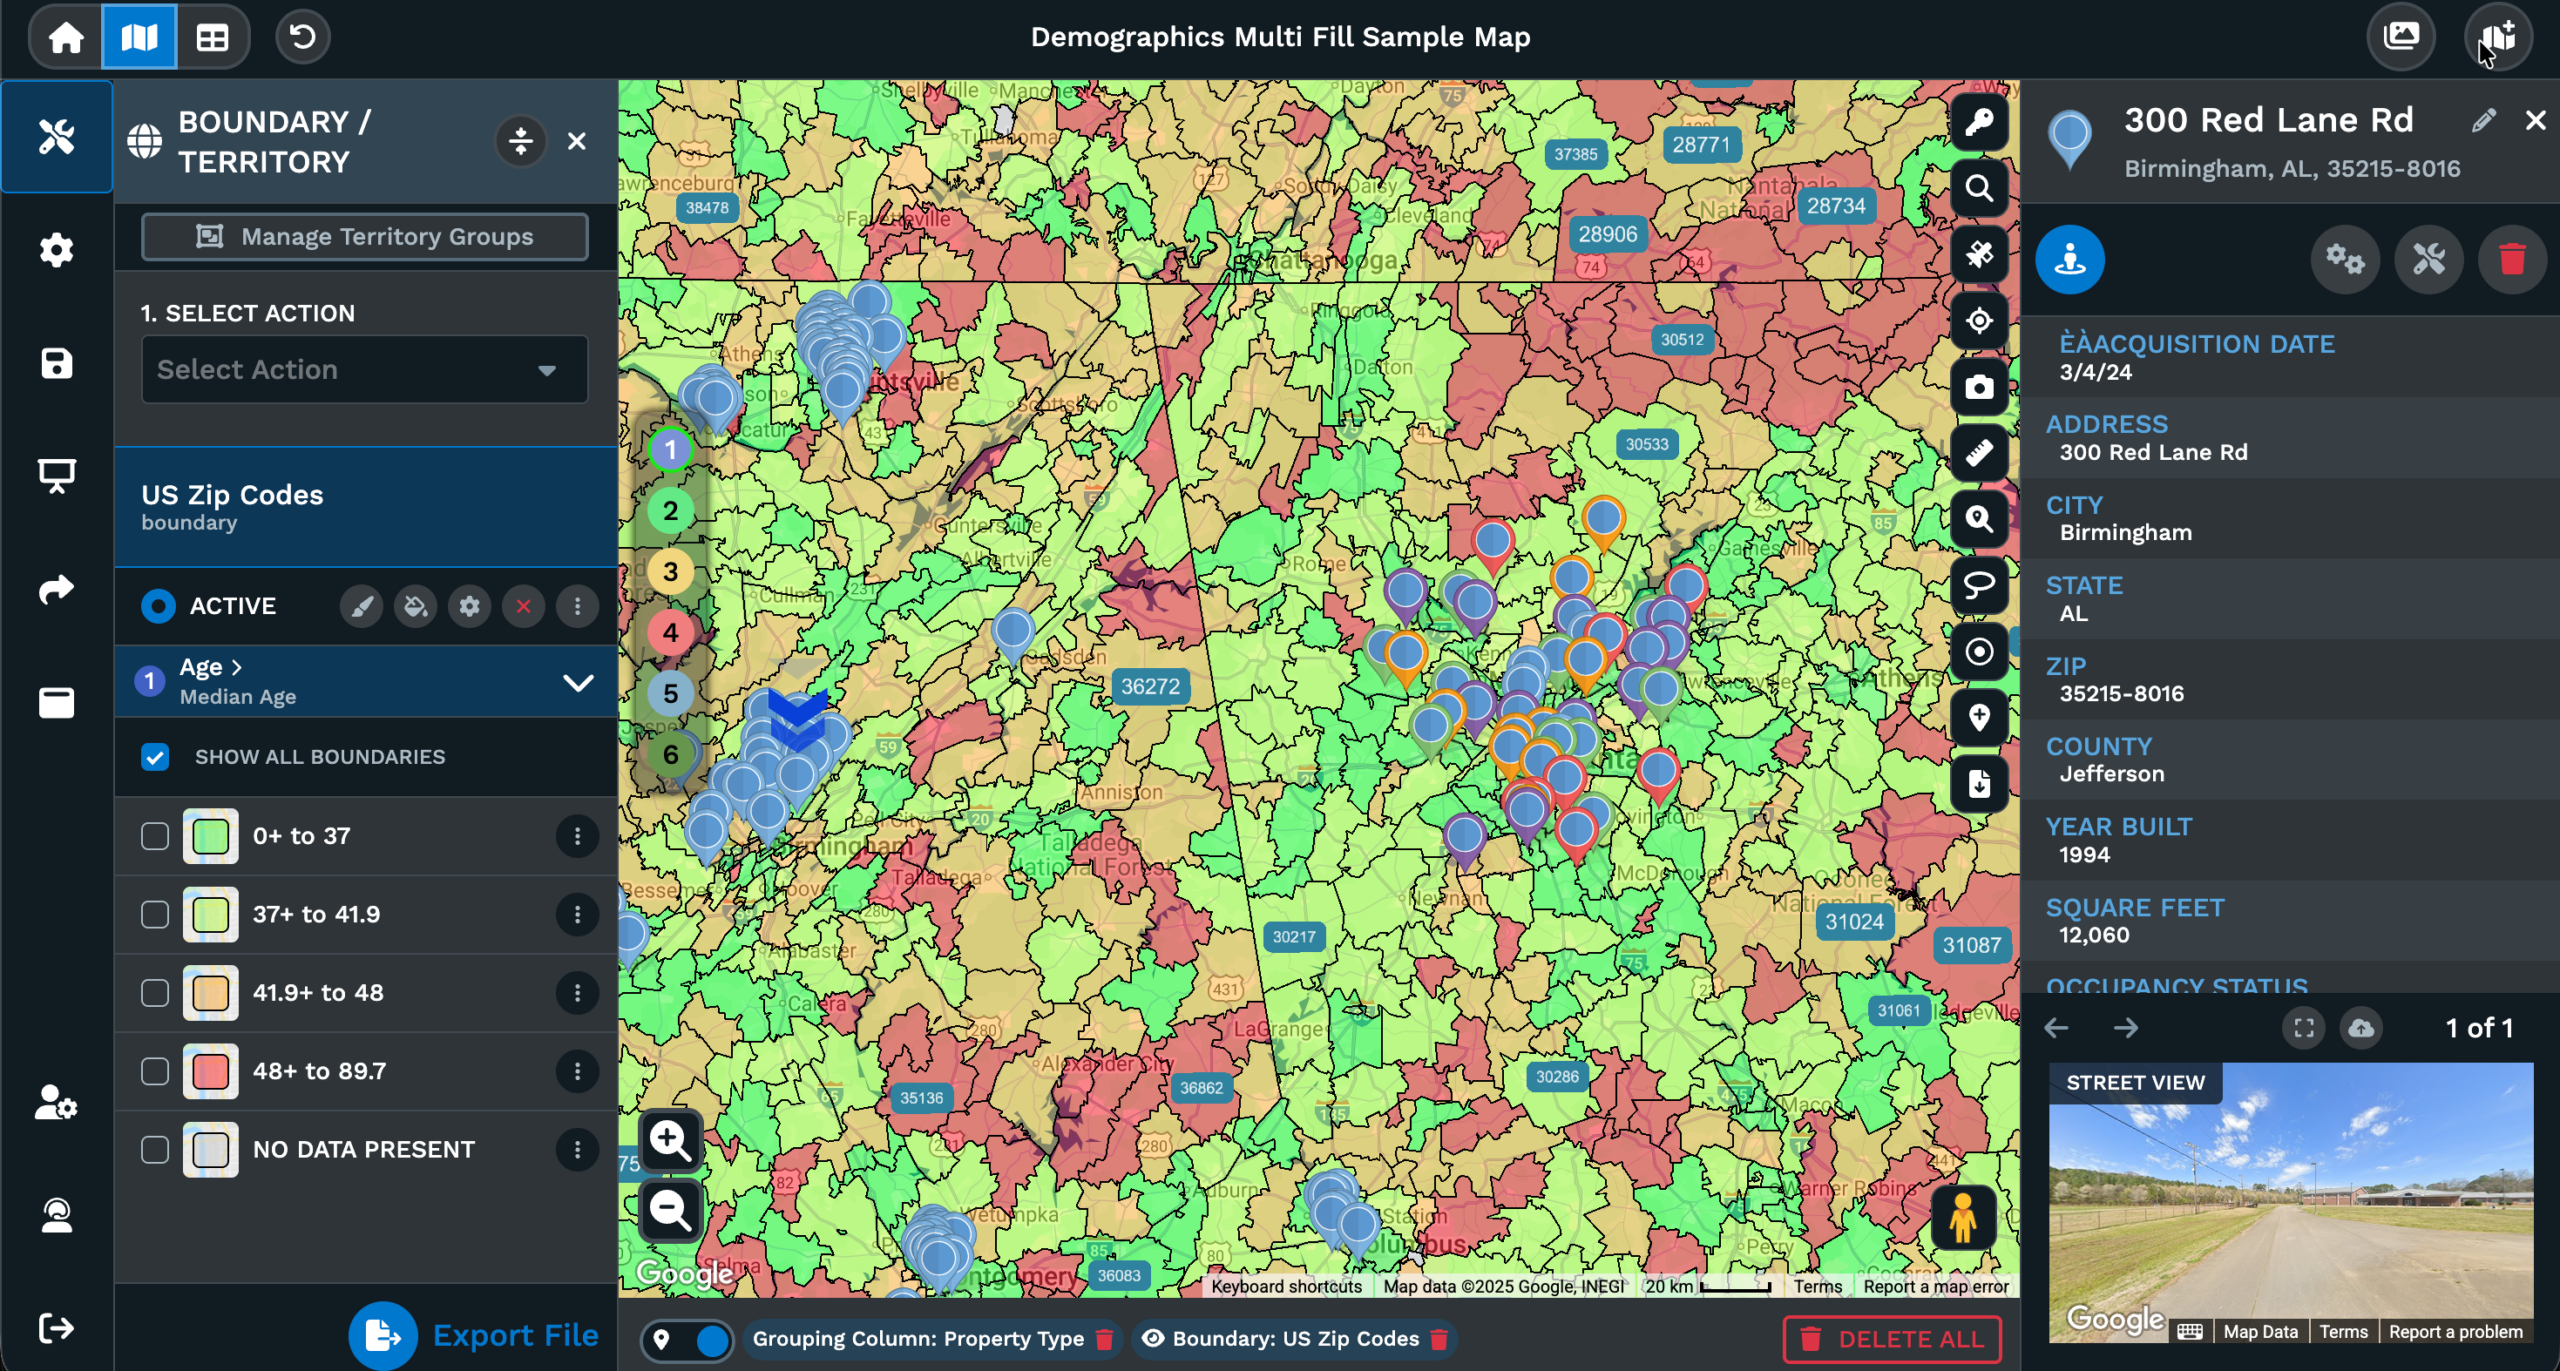
Cleaner Reports & Handouts
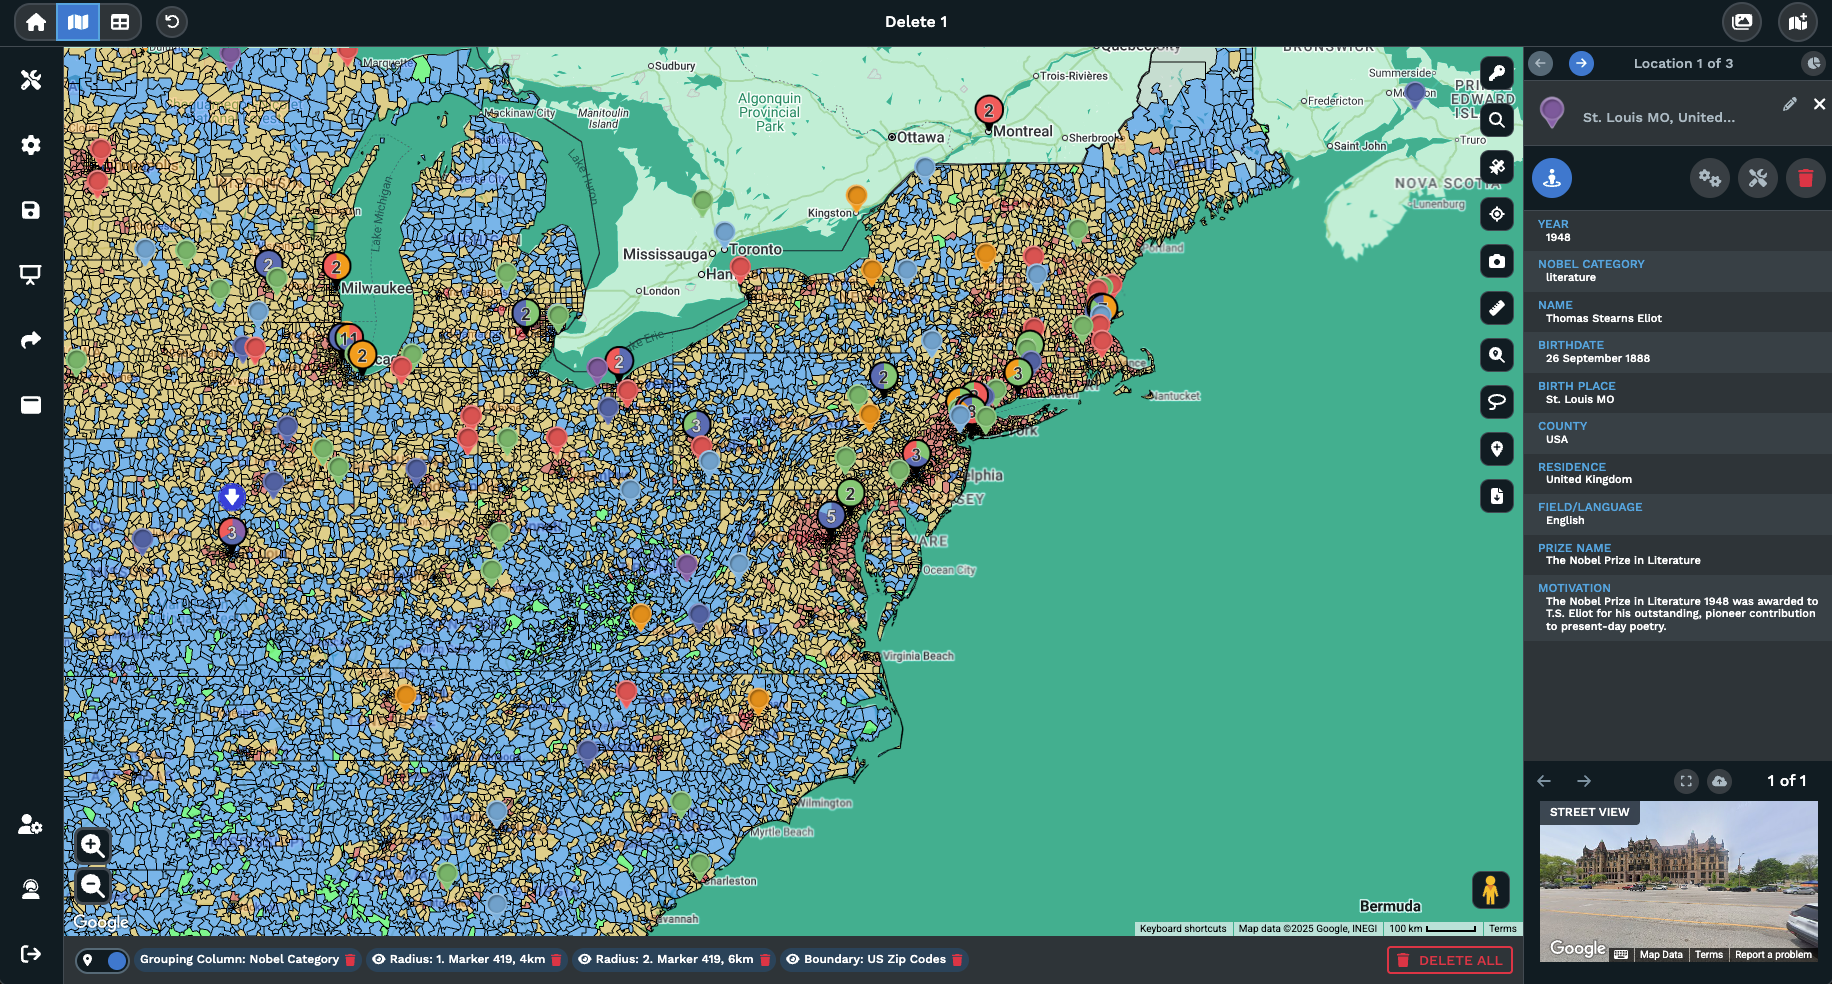
Match A Brand Palette
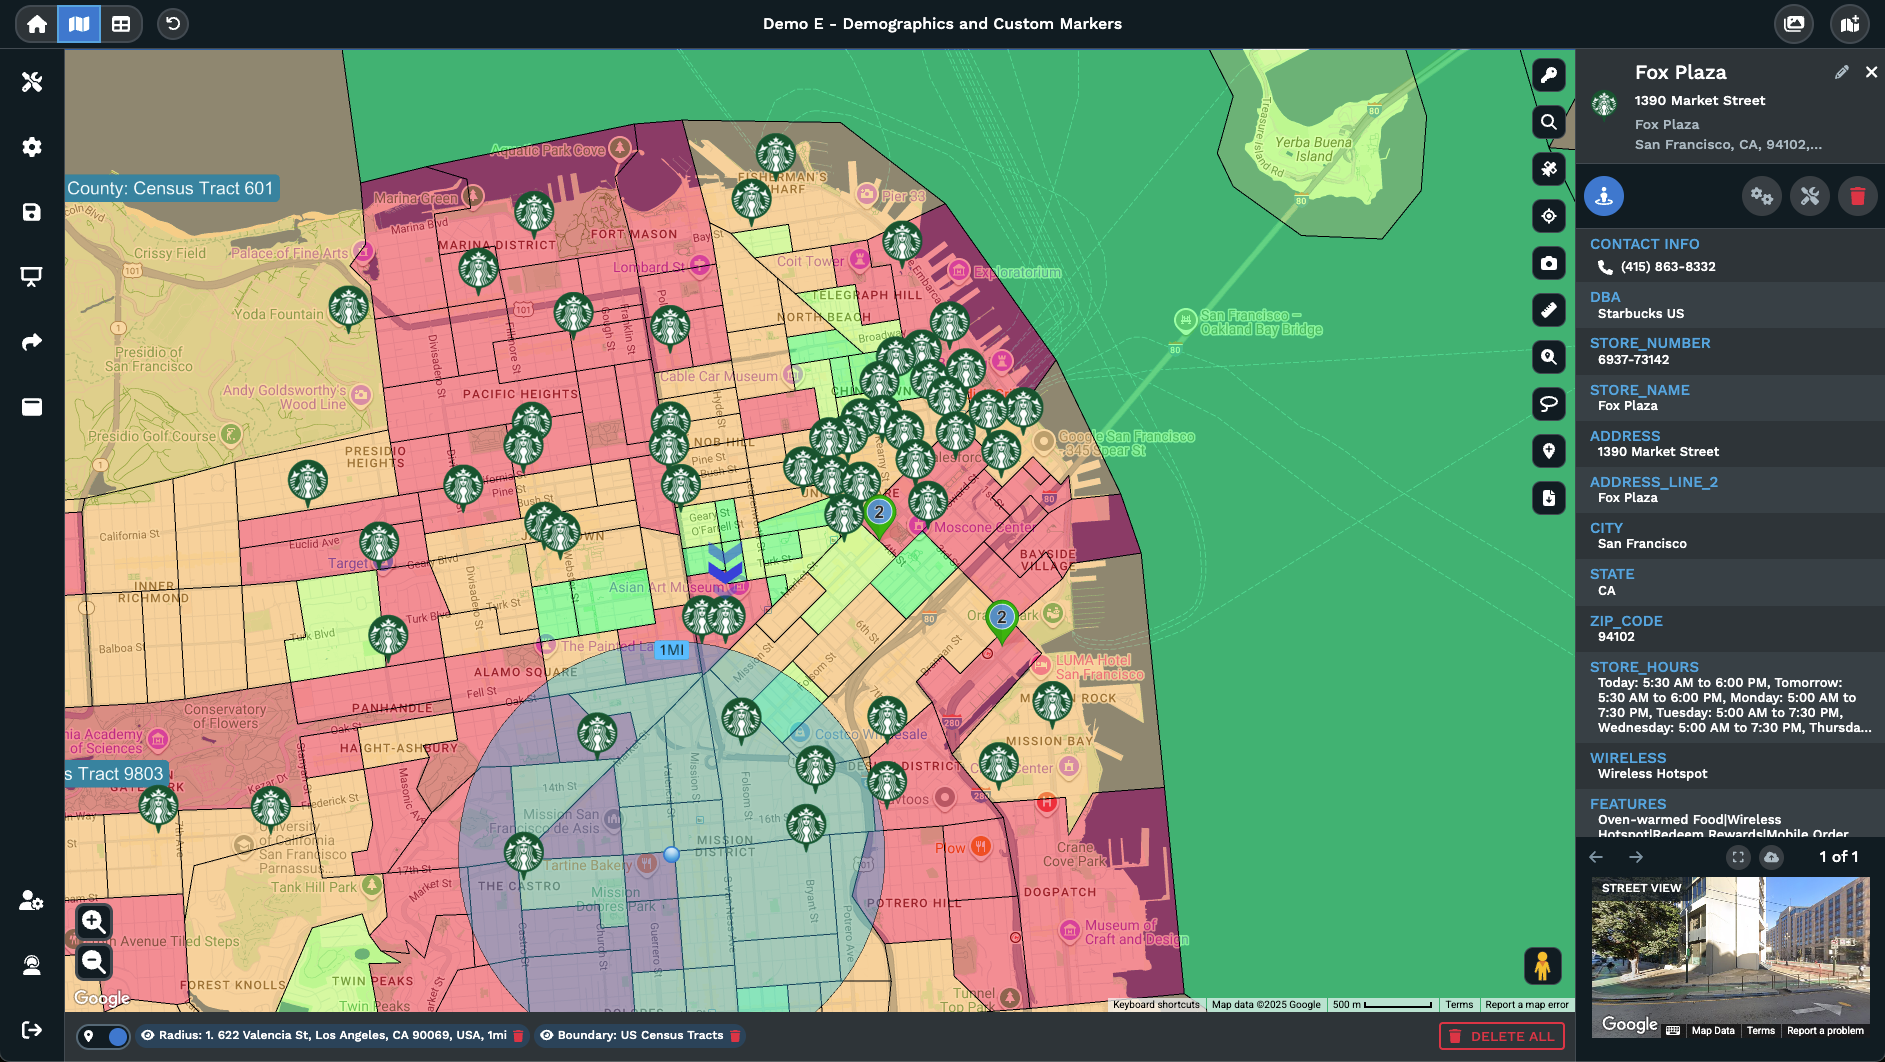
Field Read With Streets
1 Map 2 Audiences
Choosing a Map Backdrop Style
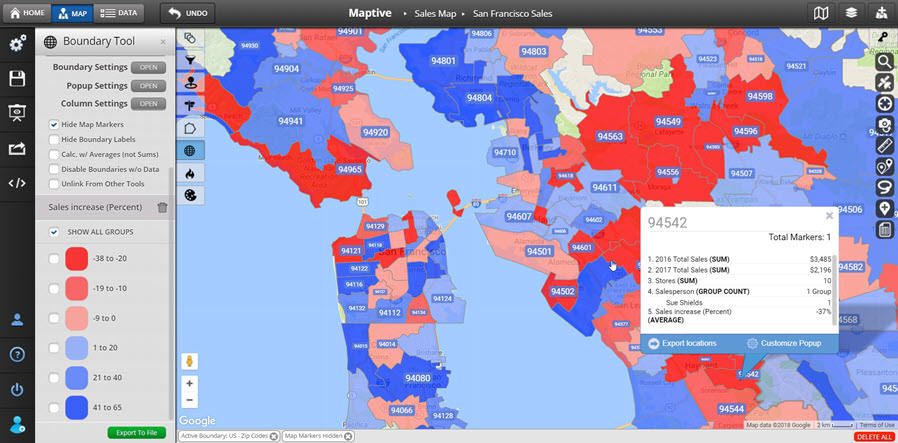
What Base Maps Are
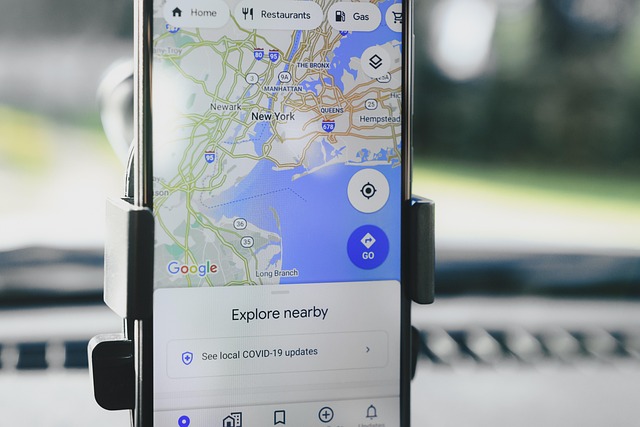
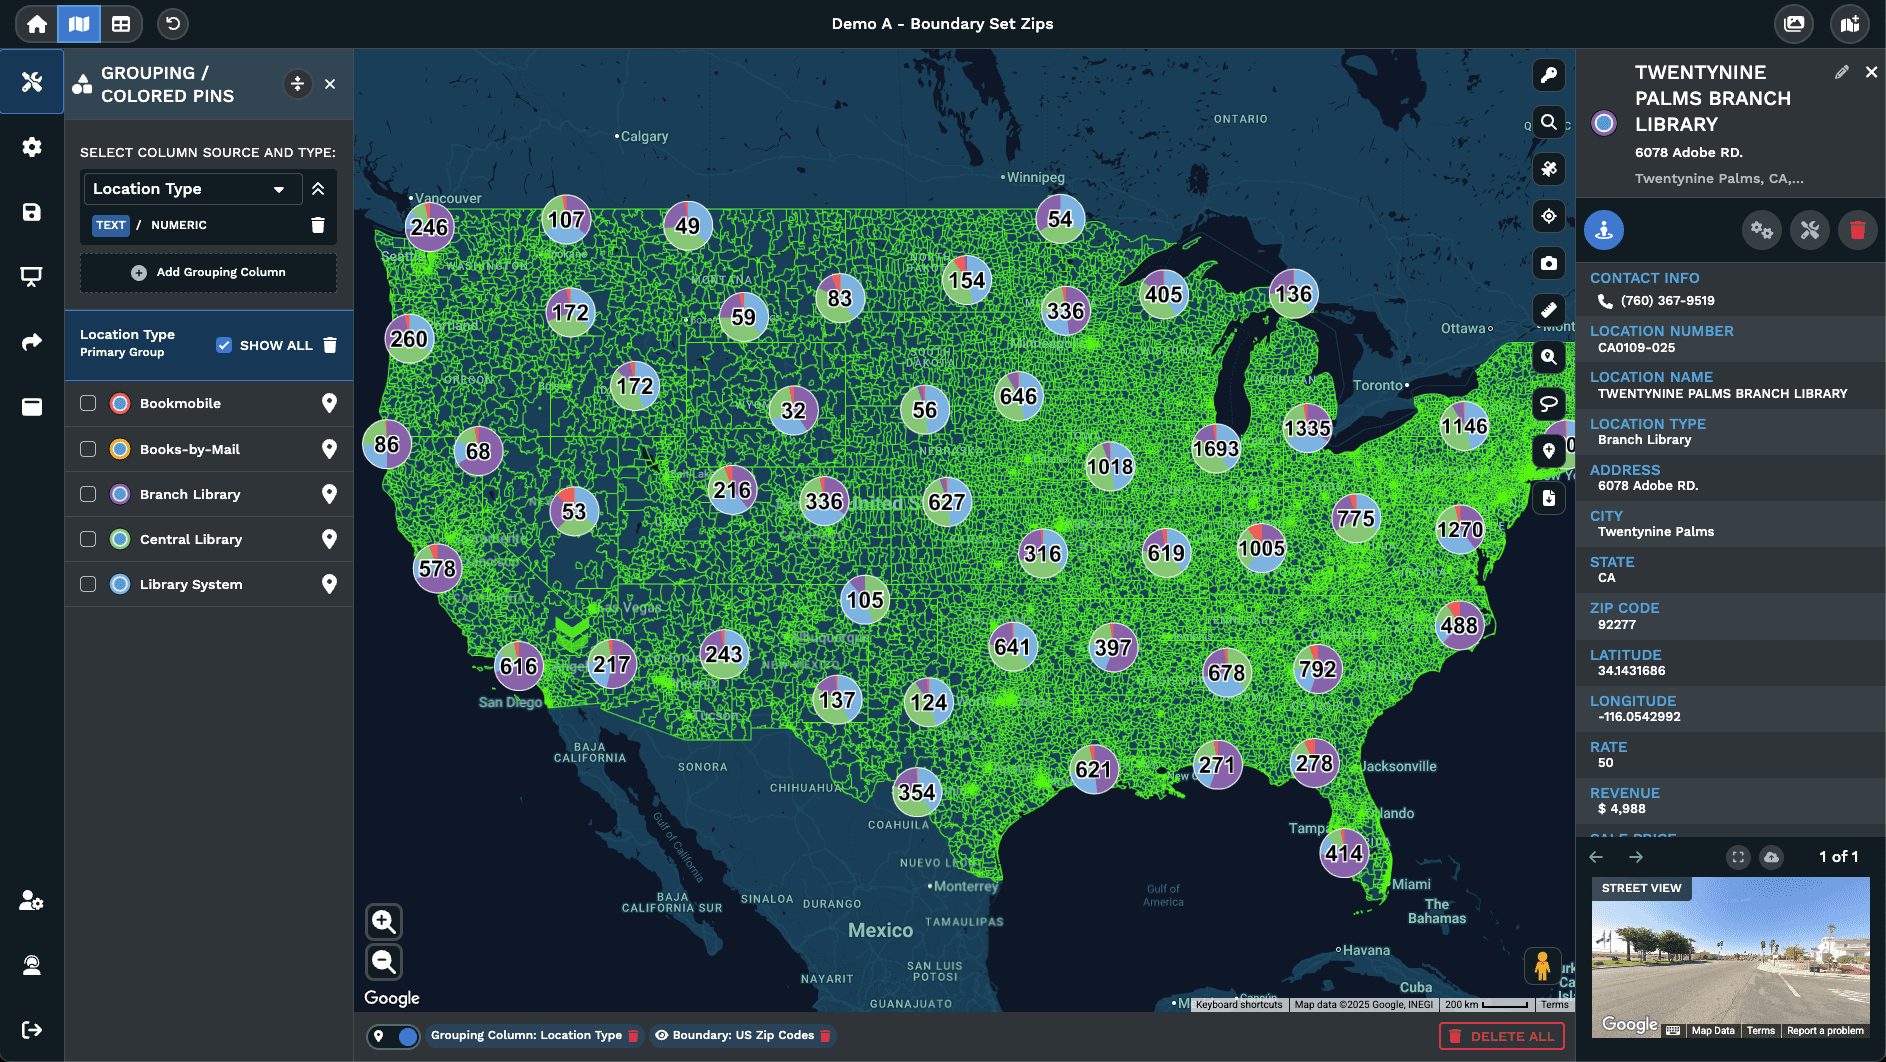
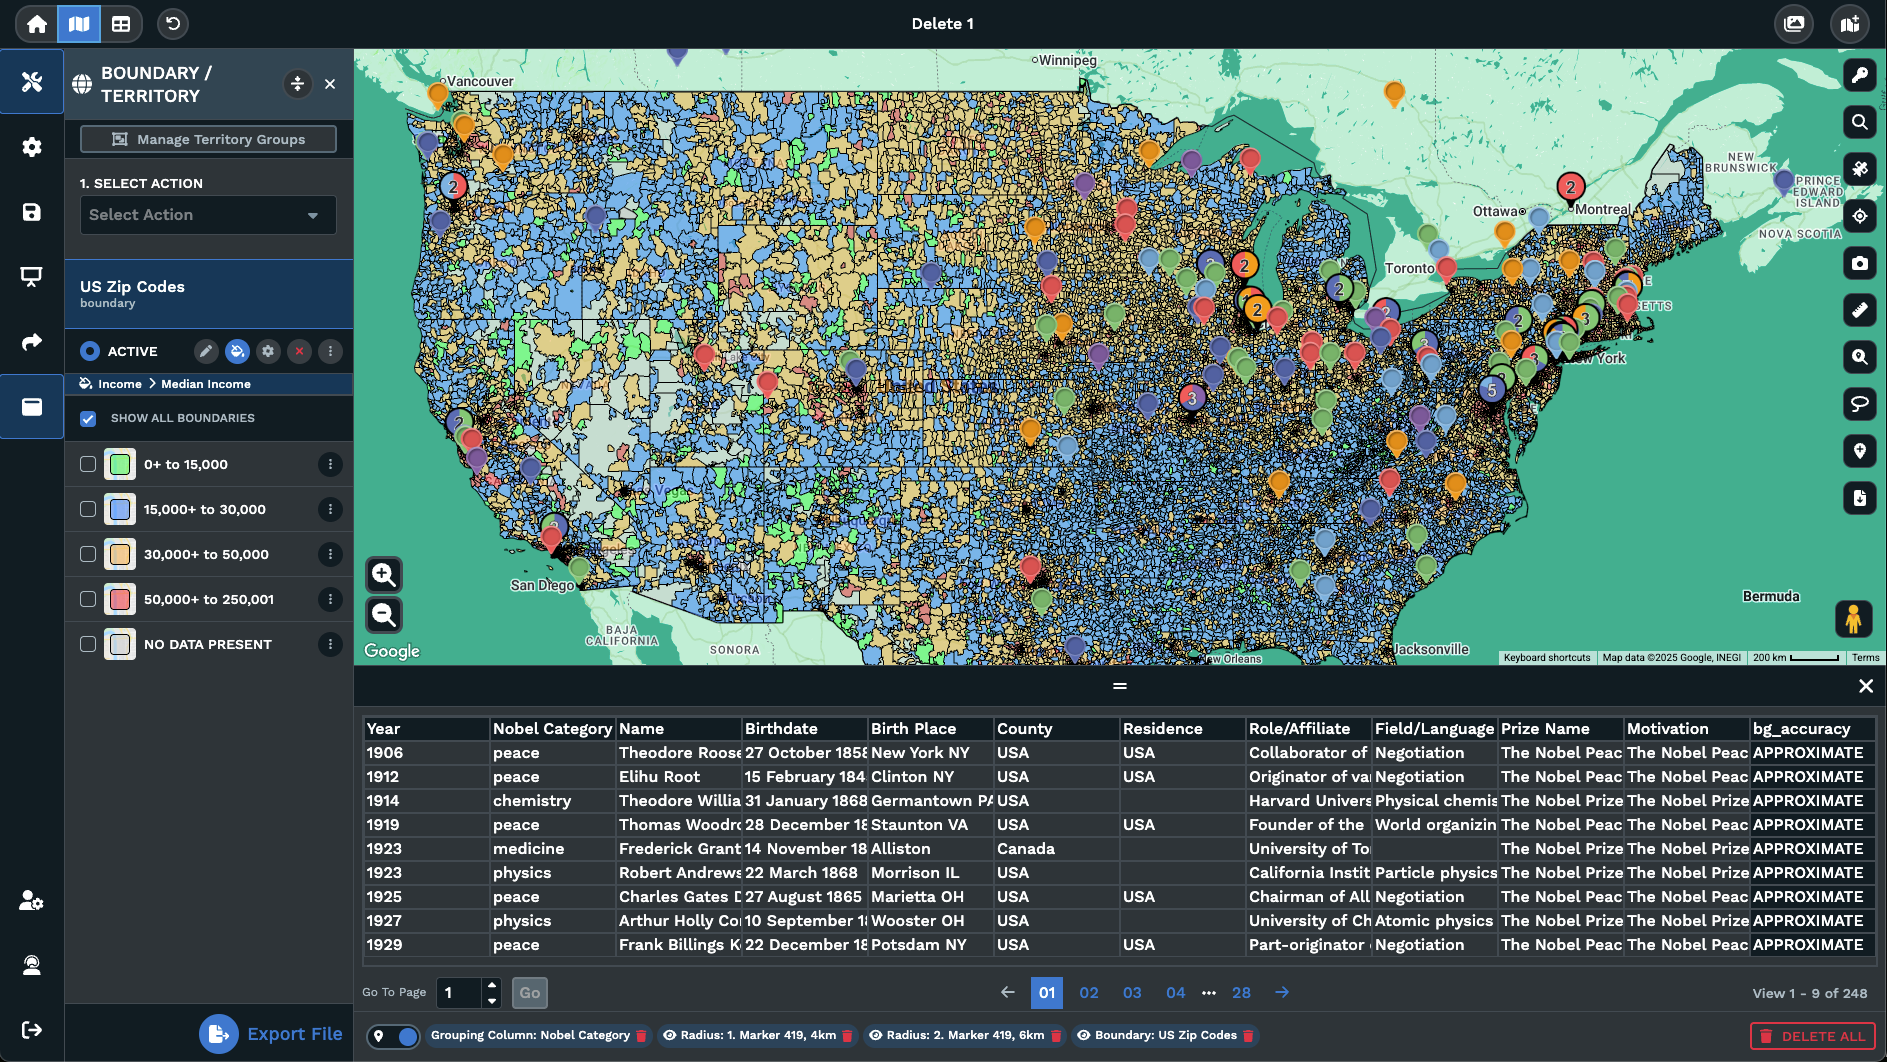
A base map is the canvas under your data on a map. It is the layer of roads, water, parks, labels, and points of interest that gives every pin or polygon a place to sit. Without that canvas, a marker has coordinates and nothing else for the reader to anchor against. The base map style is the look of that canvas, and the same dataset of pins can feel very different on a dark style than on a bright street style or a terrain style.
Inside Maptive, the base map is set through the Base Map panel under Map Settings. You open the panel from the gear wheel icon in the upper left corner, click Base Map Theme, and pick from the available map styles. The choice changes the look of the canvas under your markers, but it does not change the markers themselves, their popup data, the boundaries you have drawn, or any overlays you have added on top.
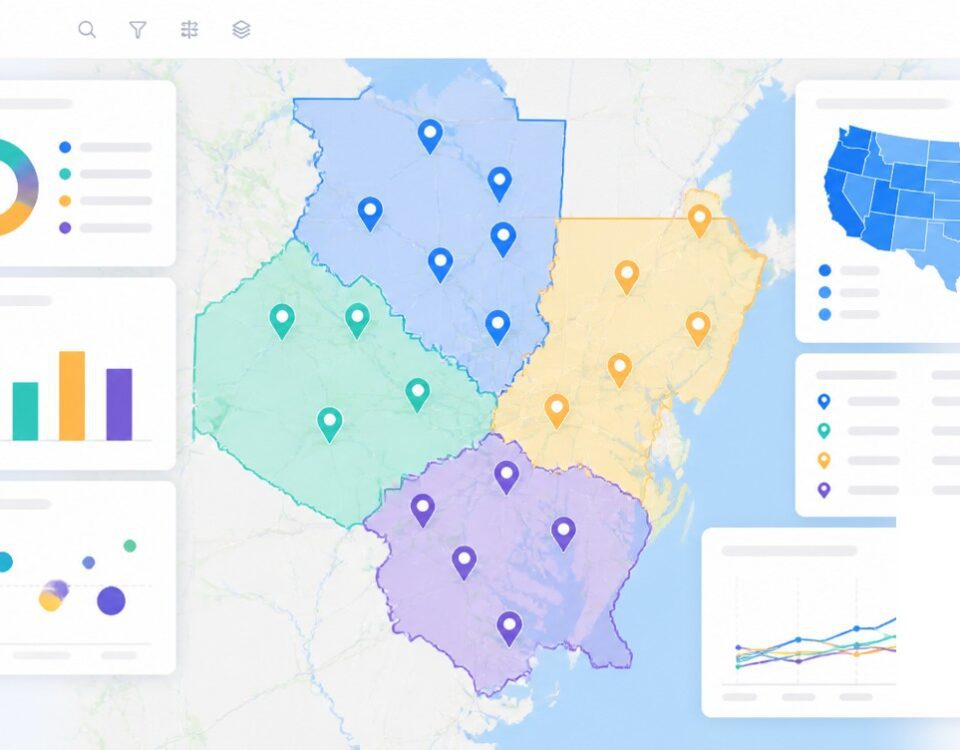
That separation between the canvas and the data is what makes the base map decision useful for your day-to-day workflow. You can keep a single dataset and switch the canvas for each audience or each use case without disturbing the underlying numbers and pins on it. The Reset button in the Base Map menu brings the canvas back to the starting state at any point.
Picking The Right Style
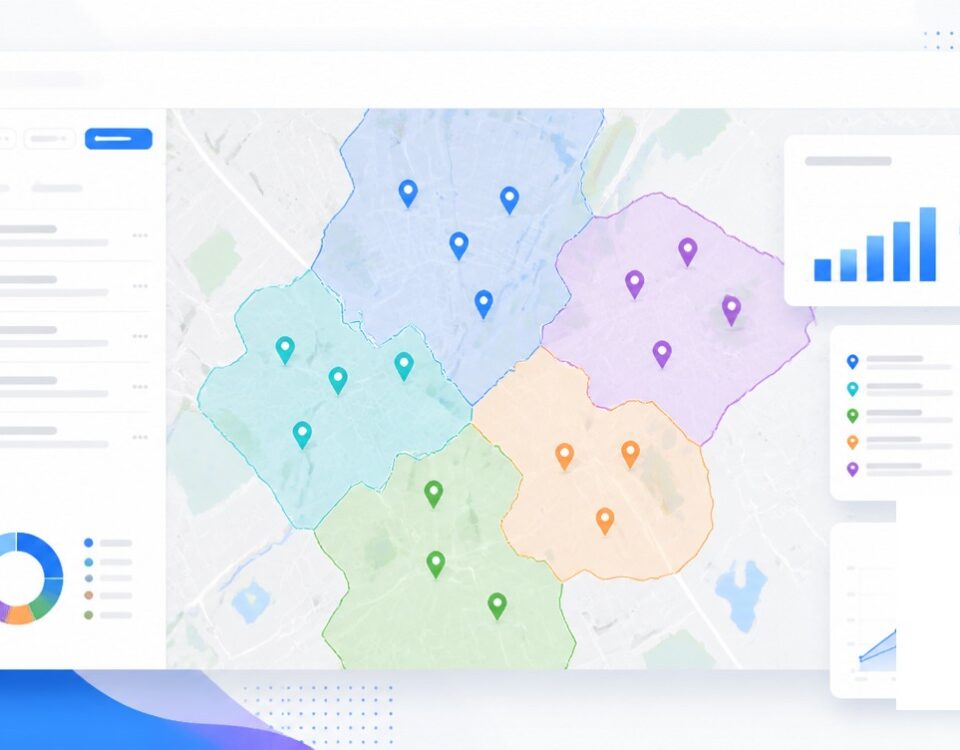
Picking a base map style is rarely about taste alone. It is about the data sitting on top of it and the room that data is going to be read in. A dense, brightly colored city base map can swallow a bright marker palette. A muted canvas can let the same markers carry the page on their own. The right pick depends on the contrast between your data points and the canvas they sit on for that day or report.
Maptive groups the options inside the Base Map Theme picker. You hover over each preview, see the look of the canvas before you commit, and click the option that fits. The same panel exposes visibility toggles for highways, road labels, landscapes, and points of interest, so a chosen theme can be trimmed further if a label fights your data. The detail density controls let you thin or thicken roads, landmarks, and other labels.
The picker takes you most of the way, and Advanced Settings handles the rest of the work. There you open a category like Highway, Locality, or Points of Interest, and act on the Geometric, Labels, or Text sub-features. Each style carries Color, Weight, Saturation, and Lightness controls so the canvas can be tuned to match a brand color or fit a project page on a site.
1 Map 3 Views
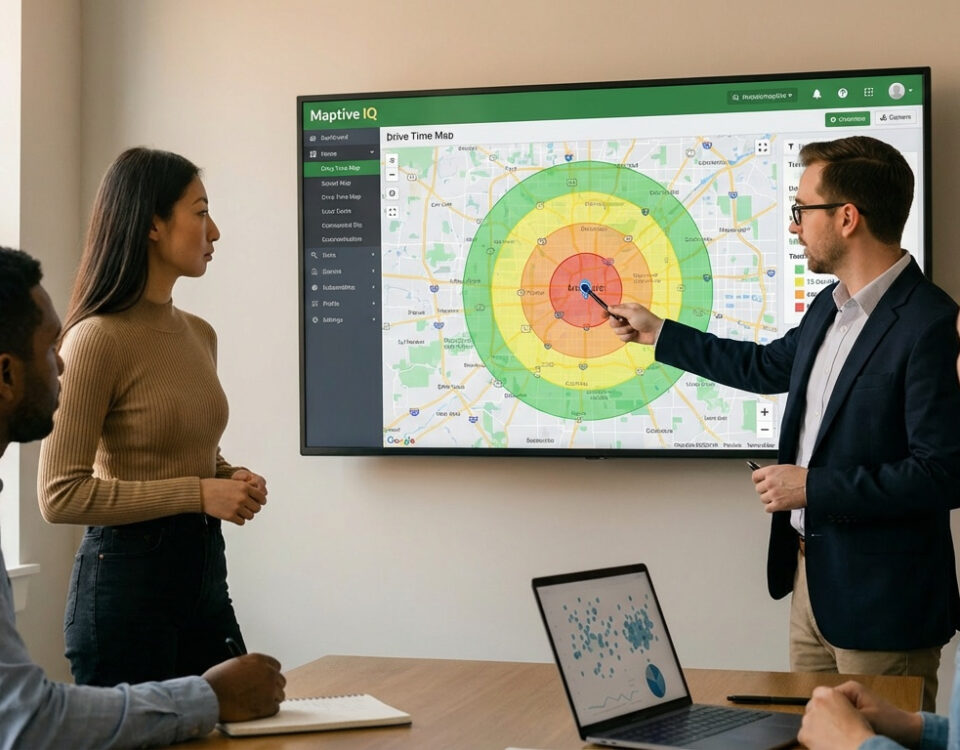
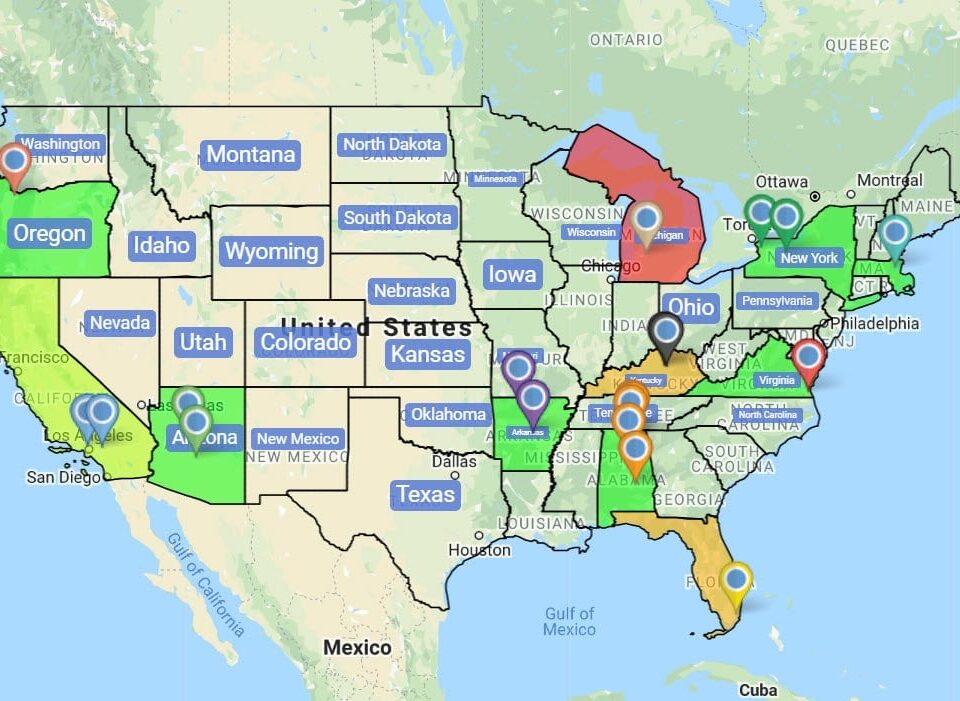
Most teams open a map with the default style still on and never come back to it. That is a missed move. The base map decision ranks among the cheapest ways to push a map from a working draft to a report or a presentation deck without touching the data underneath the canvas. The same map can read 3 different ways for 3 different audiences if the canvas itself is picked with real intent.
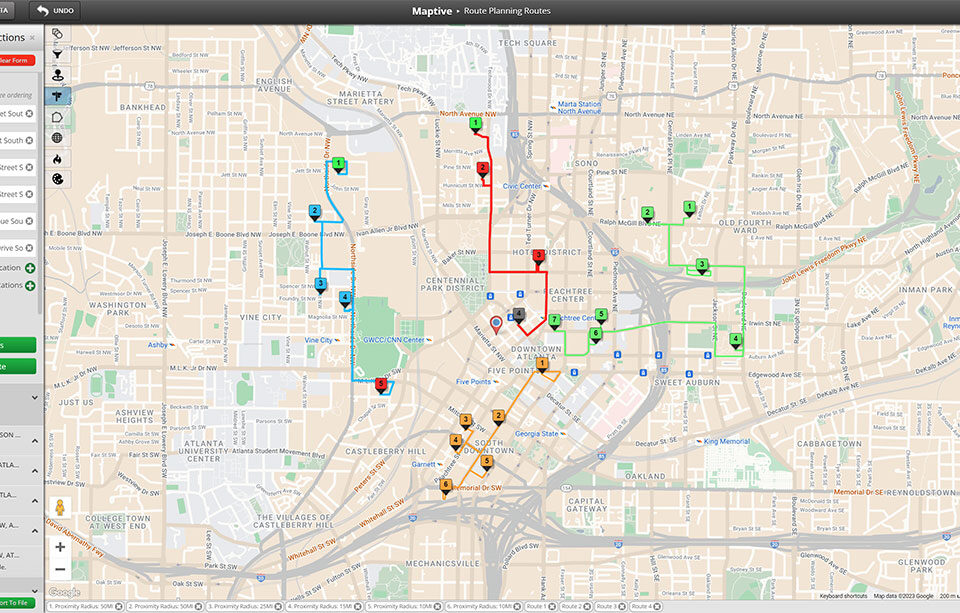
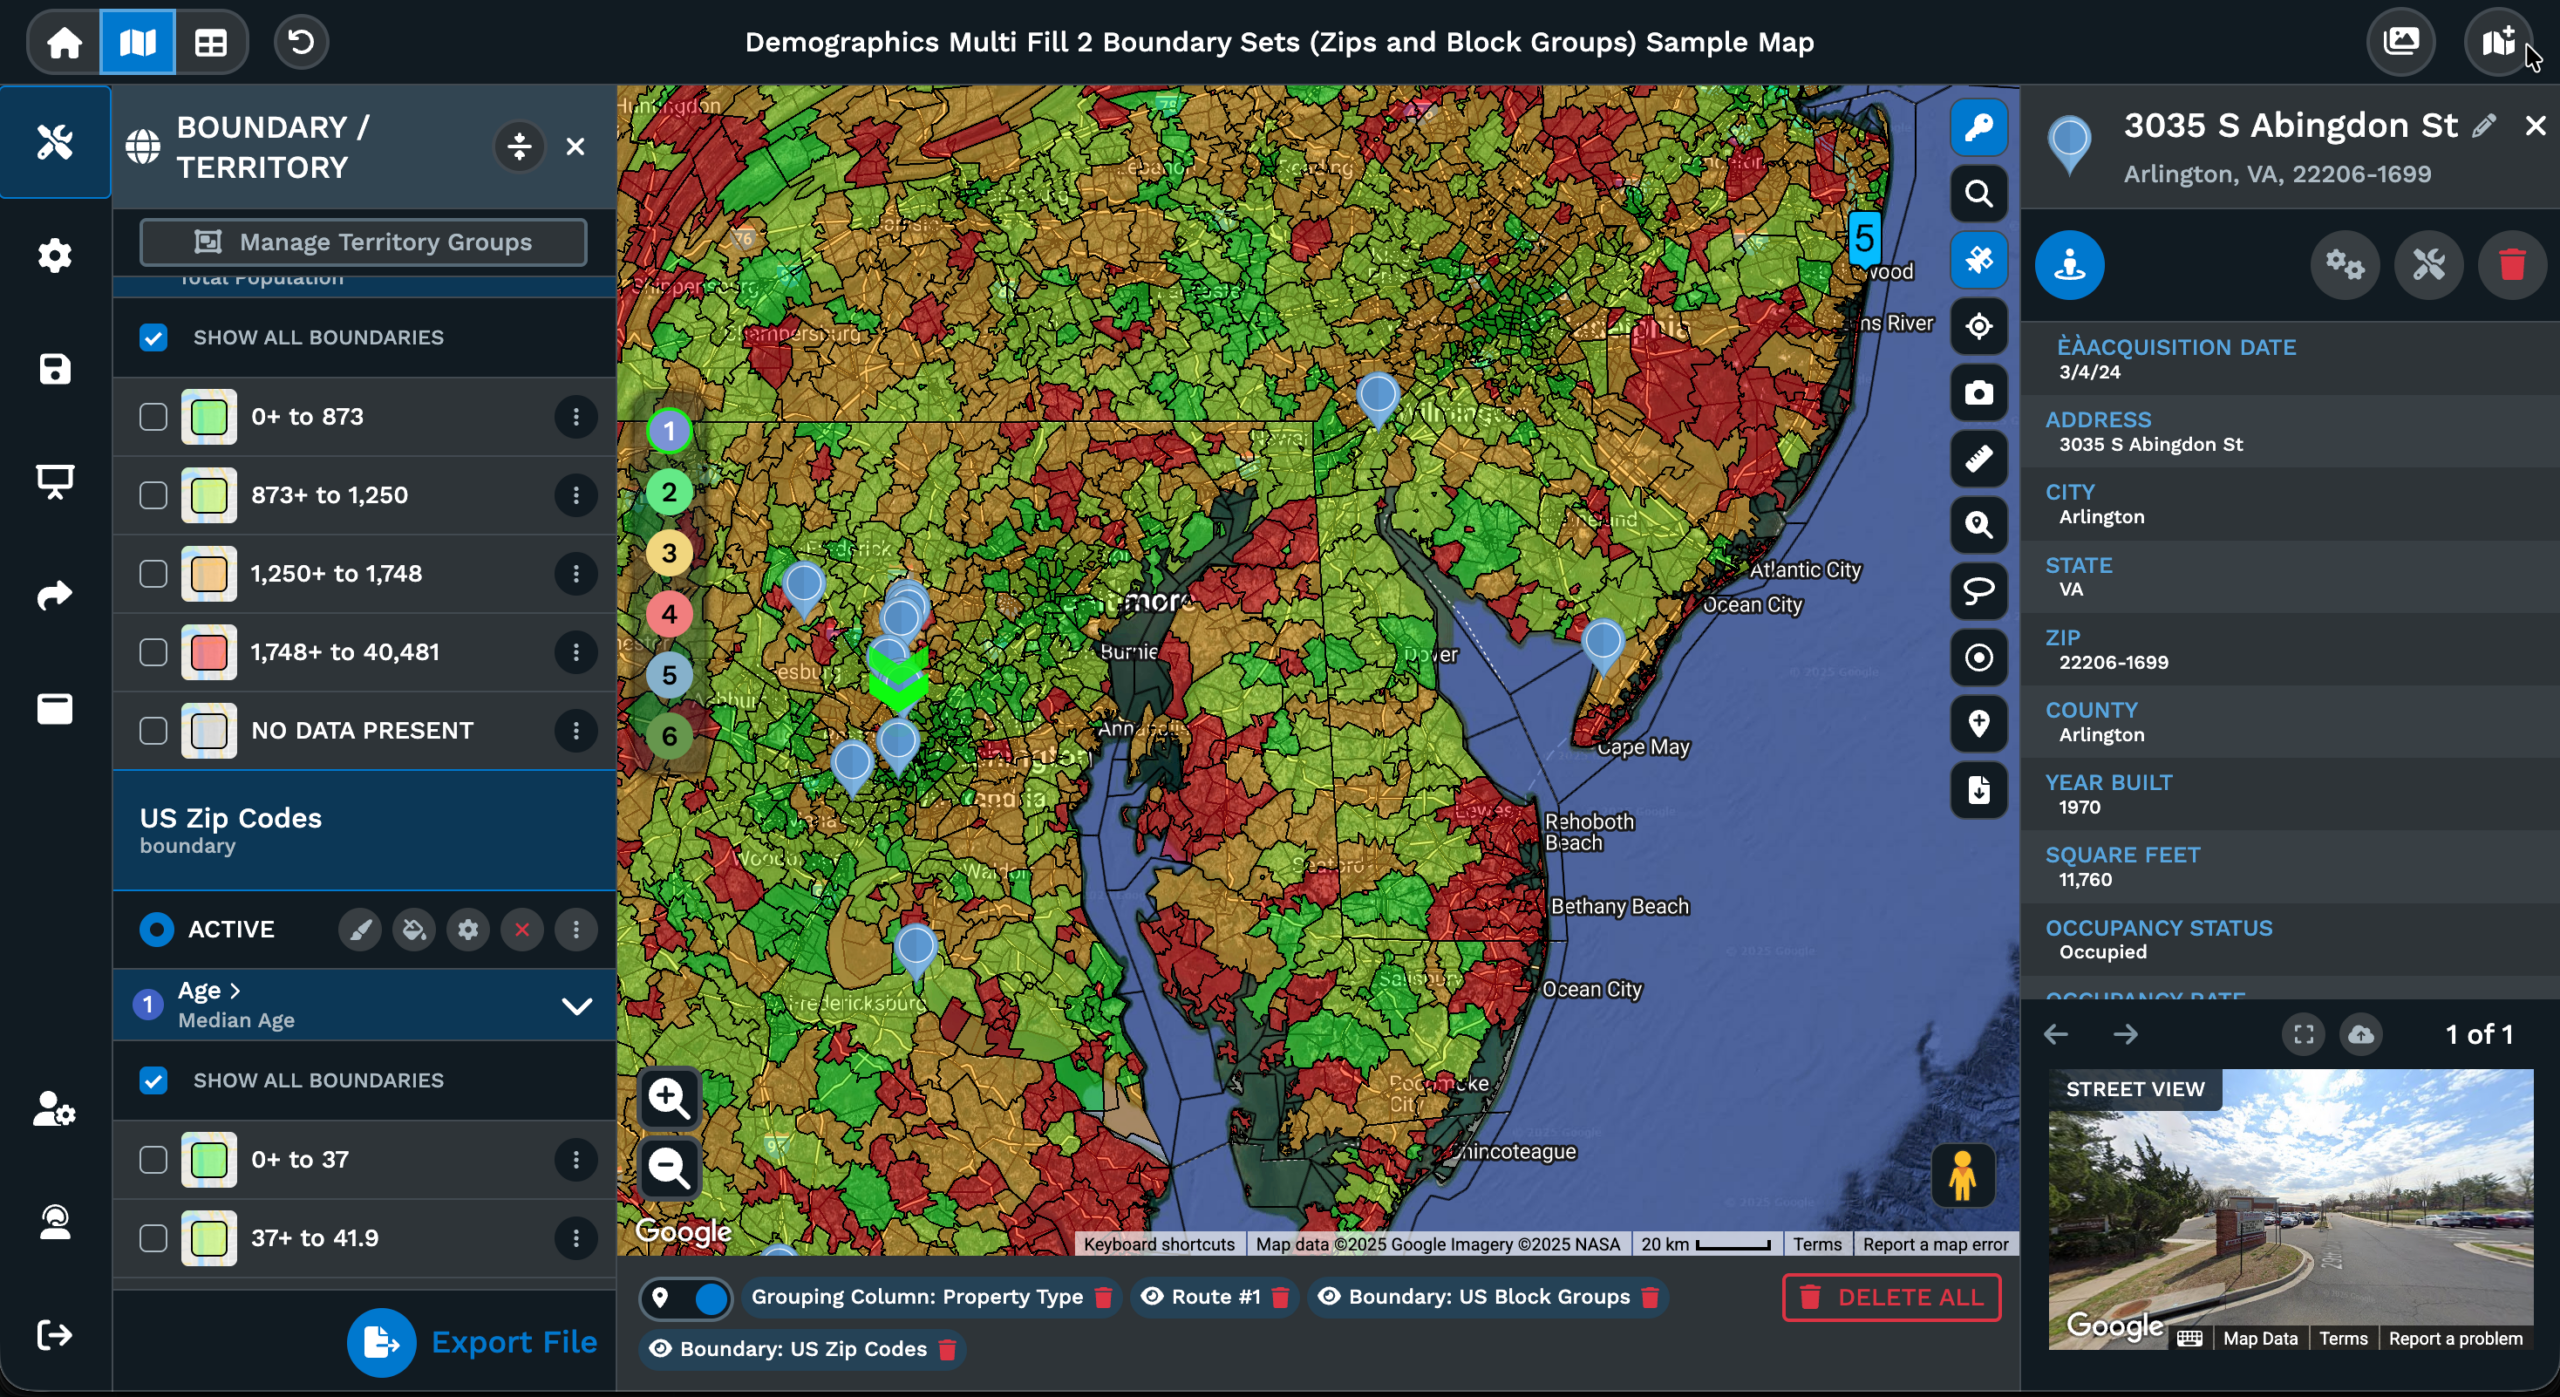
A boardroom view leans toward a muted, light canvas with road labels turned down so colored pins and territory blocks carry the page on their own. A field-team view leans the other way, with road labels on, road weight up, and the canvas pushed toward a high-detail street style so a rep can read intersection names. A printed handout view often calls for a flat canvas with points of interest hidden so a single dataset can read on the page without much competition.
The Base Map Theme picker, the visibility toggles, and Advanced Settings give you a path from a single starting map to all 3 of those finished views. Your pins do not move, your filters do not reset, and the Reset button is there if a custom tune goes too far and the canvas needs to come back to the original starting state you began the work from.
FAQs About Customizable Base Maps
Can I change the base map style on a map I already built?
Yes. You open the map, click the gear wheel icon in the upper left corner, and open the Base Map drop-down inside Map Settings. From there, click Base Map Theme, hover the available styles, and click the option you want. The canvas under your markers swaps to the new look, but your pins, popup data, filters, and overlays do not move. The Reset button in the same panel will roll the canvas back to the starting state if a change does not work out.
How do I hide road labels or points of interest on the canvas?
Inside the Base Map panel under Map Settings, you have visibility toggles for highways, roads, highway labels, road labels, landscapes, and points of interest. You flip the toggle on each feature you want quieter and the canvas updates as you go. For per-category control, you open Advanced Settings and use the Highway, Locality, or Points of Interest entries with their Geometric, Labels, and Text sub-features. The output is a quieter canvas that gives your data the page rather than fighting it.
Does swapping the base map theme affect my pins or filters?
No. The base map sits under your data, not over it. You can swap the Base Map Theme as many times as you like through the day and your pins, marker styling, popup data, filters, drawn boundaries, and overlays all keep their state. Only the canvas under the markers updates. That separation is what lets a single map serve a boardroom view, a field-team view, and a printed handout view from the same dataset without any duplication of work on your side.
How do I match the canvas to my brand colors?
You open Map Settings, drop into the Base Map panel, and click Advanced Settings. There you select a category like Highway, Locality, or Points of Interest, and pick Geometric, Labels, or Text. Each style carries Color, Weight, Saturation, and Lightness controls. You set the color value on each feature so landscapes, roads, water, labels, landmarks, and points of interest line up with your brand palette. The output is an embed or screenshot that reads as part of your site rather than as a generic Google-style map.
Is there a satellite view on Maptive maps?
Yes. Satellite View is a separate toggle on the right side of the map. You click it to flip the map into satellite imagery and click it again to return to your current base map style. The satellite layer sits in place of the styled canvas, so your pins and overlays still ride on top. It is useful when you need actual ground imagery under your data, like checking a parking lot, a roof, or a property line, before going back to your normal styled view.
Can I dim the canvas so my heat map or markers pop?
Yes. The shortest path is to pick a quieter Base Map Theme from the picker so the canvas already reads as muted. From there, you can use the visibility toggles in the Base Map panel to drop road labels and points of interest down. For finer control, you open Advanced Settings, pick a category, and pull the Saturation and Lightness sliders on Geometric, Labels, and Text. A heat map overlay, a cluster, or a colored marker palette reads with more contrast on the quieter canvas.
What if I edit the canvas too far and want to start over?
You use the Reset button. It is placed both inside Advanced Settings and on the main Base Map menu, so you can fire it from either spot. Reset reverts every change you made under the Base Map panel back to the starting state of the canvas. Your pins, filters, drawn boundaries, popup data, and overlays are not touched by the Reset, only the canvas. That makes it safe to experiment with color, weight, saturation, and lightness on a category without losing any of your data work.
How does the detail density control change the map?
The Base Map panel exposes settings for how concentrated roads, landmarks, and labels appear on the canvas. You raise the density when a dense city view needs more detail for a field rep, and you drop it down when a printed handout needs a cleaner page. The same map can swing from heavy detail to light detail through that single set of controls. Pair the density move with a quieter Base Map Theme and the canvas can be tuned for any audience you are putting the map in front of.
Where is the gear wheel icon for Map Settings?
The gear wheel icon sits in the upper left corner of your map view. A single click opens the Map Settings window, where you find the Base Map drop-down along with the other map-level controls. From the Base Map drop-down you reach the Base Map Theme picker, the visibility toggles for roads and labels, the detail density controls, and the Advanced Settings entry. Reset lives in the same area. That single icon is the path into every canvas-level option Maptive gives you for the active map.
Can I save my base map setup so I do not redo it each time?
Your base map setup is part of the map itself. When you change the Base Map Theme, toggle visibility on roads or labels, or edit a feature inside Advanced Settings, those choices stick to the saved map alongside your pins, filters, boundaries, and overlays. Open the map again later and the canvas is exactly how you left it. That is what lets you build a presentation-ready map once and revisit it for the same audience without redoing the styling work each session.