Map Drawing Tool
Add polygons, arrows, labels, numbers, images, and icons on top of your Maptive map with the Map Drawing Tool, each annotation sitting separate from your spreadsheet or markers.
Drawing Tools Beyond Map Markers
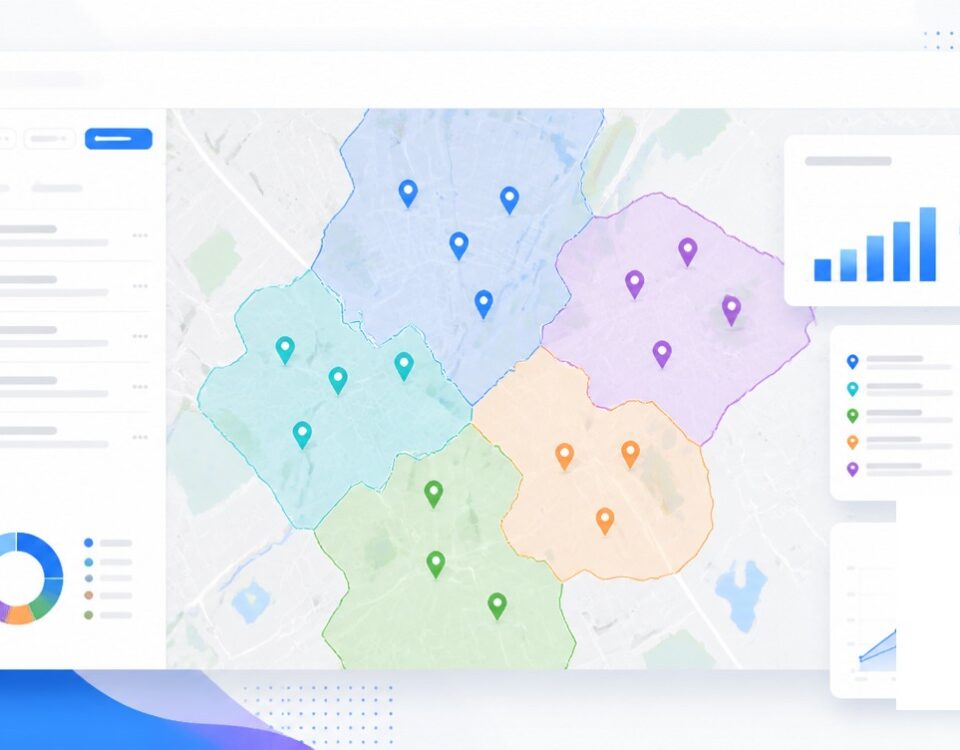
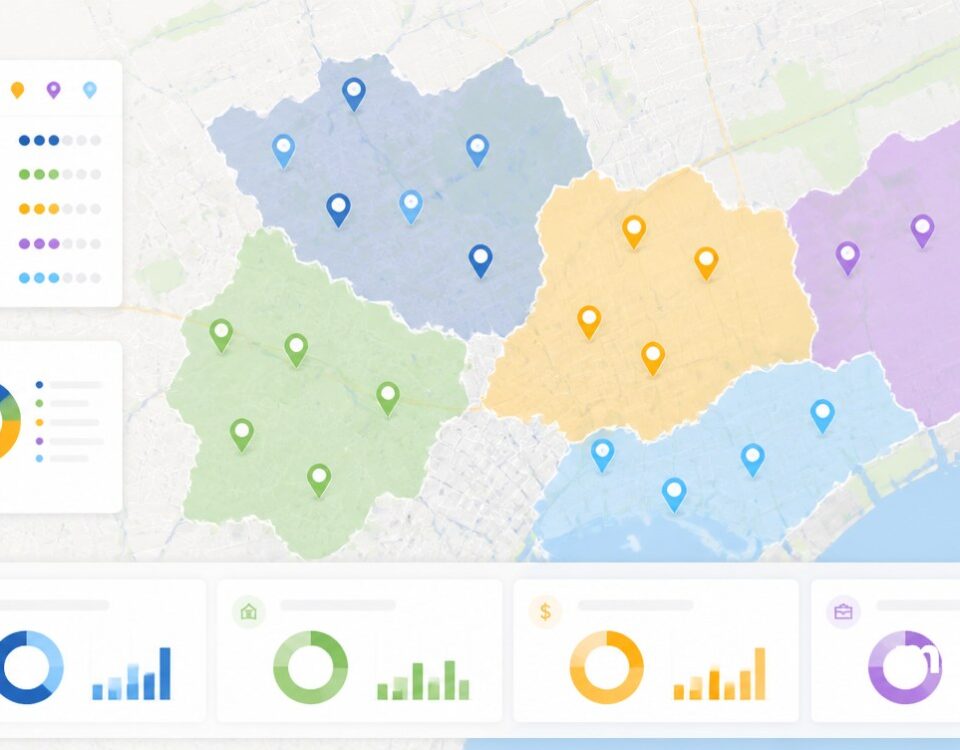
Closed Regions: Draw Polygon, Draw Rectangle, and Draw Circle let you mark a custom area on the map, with fill color, line weight, and opacity editable in the settings panel.
Lines and Arrows: Draw Polyline links a sequence of points across the map and Draw Arrow points at a single spot, both with line size, weight, and color editable per drawing.
Labels and Text: Draw Label attaches text to a draggable dot, Draw Text sits free on the map, and Draw Callout points at a spot, with font, dot size, and colors editable.
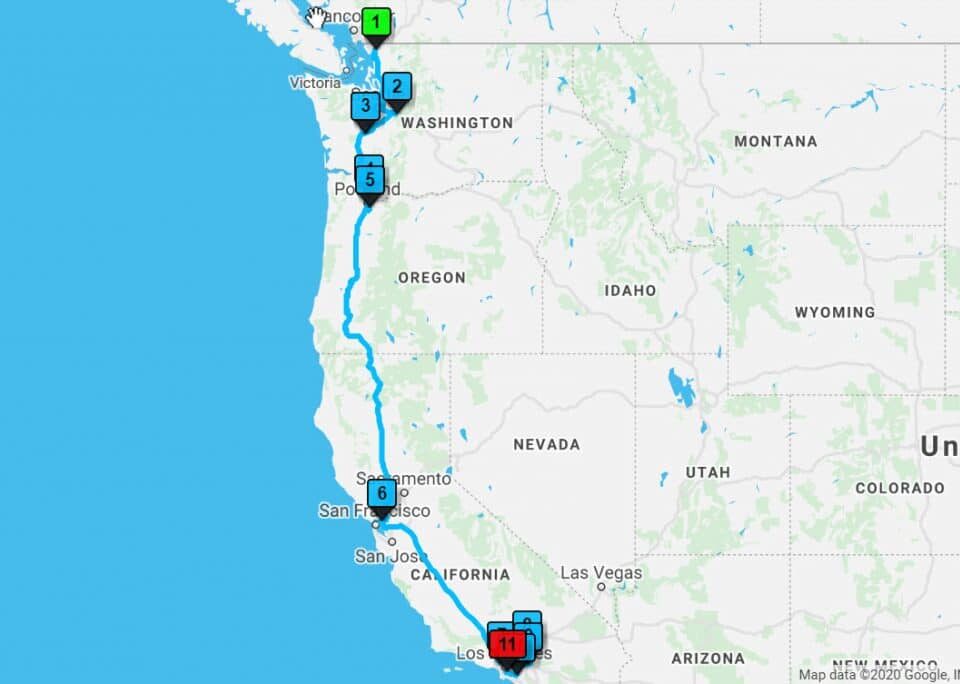
Number Sequences: Draw Number sets the value shown in the panel and you place it on the map, with font and color settings staying consistent across every number you place.
Image Overlay: Upload/Display Image drops a logo, photo, or floor plan on the map at the spot you click, with a toggle for the image to scale with map zoom or stay fixed.
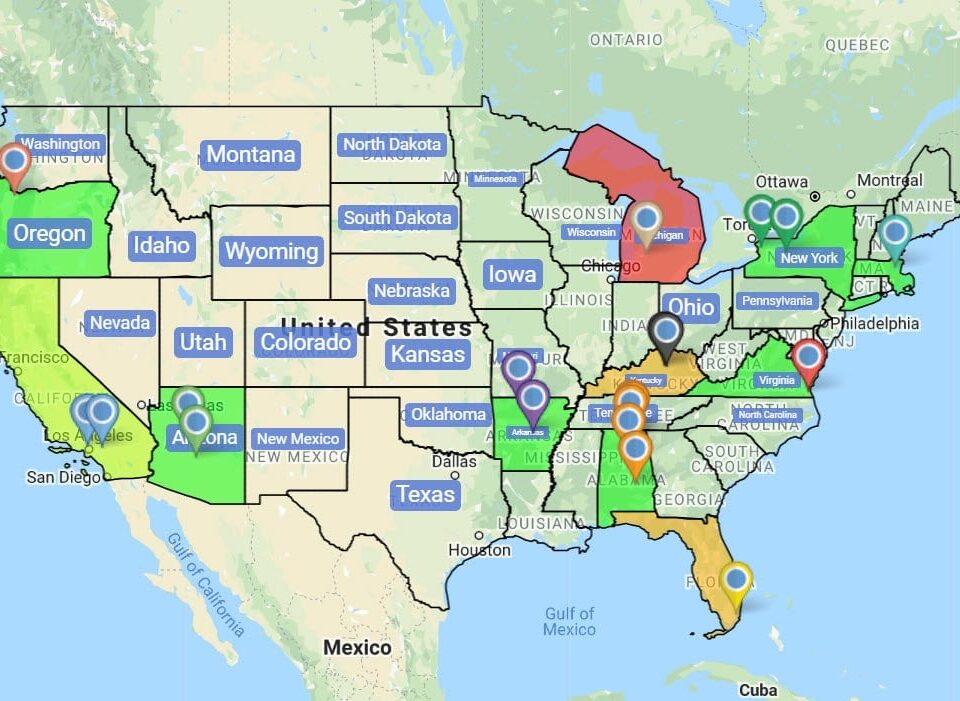
Icon Markers: Draw Icon Marker places a chosen symbol on your map for transit stops, parking spots, landmarks, or any visual context that your spreadsheet markers do not have.
Annotate Your Map in 3 Steps
1
Open
Open Map Tools on your Maptive map, then pick Manage Drawing Elements to bring up the drawing panel and the tool list.
2
Pick
Click Start Drawing, then pick Polygon, Polyline, Arrow, Label, Number, Image, or Icon Marker from the panel of tools.
3
Saved
Your annotation sits on top of the map as a separate layer, with the underlying spreadsheet and markers all untouched.
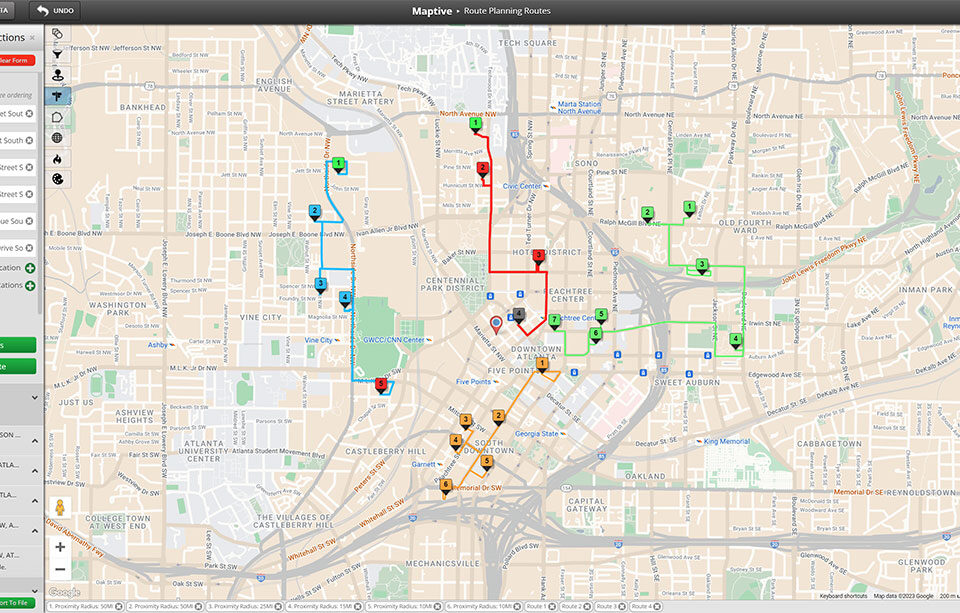
Annotated Walk Through
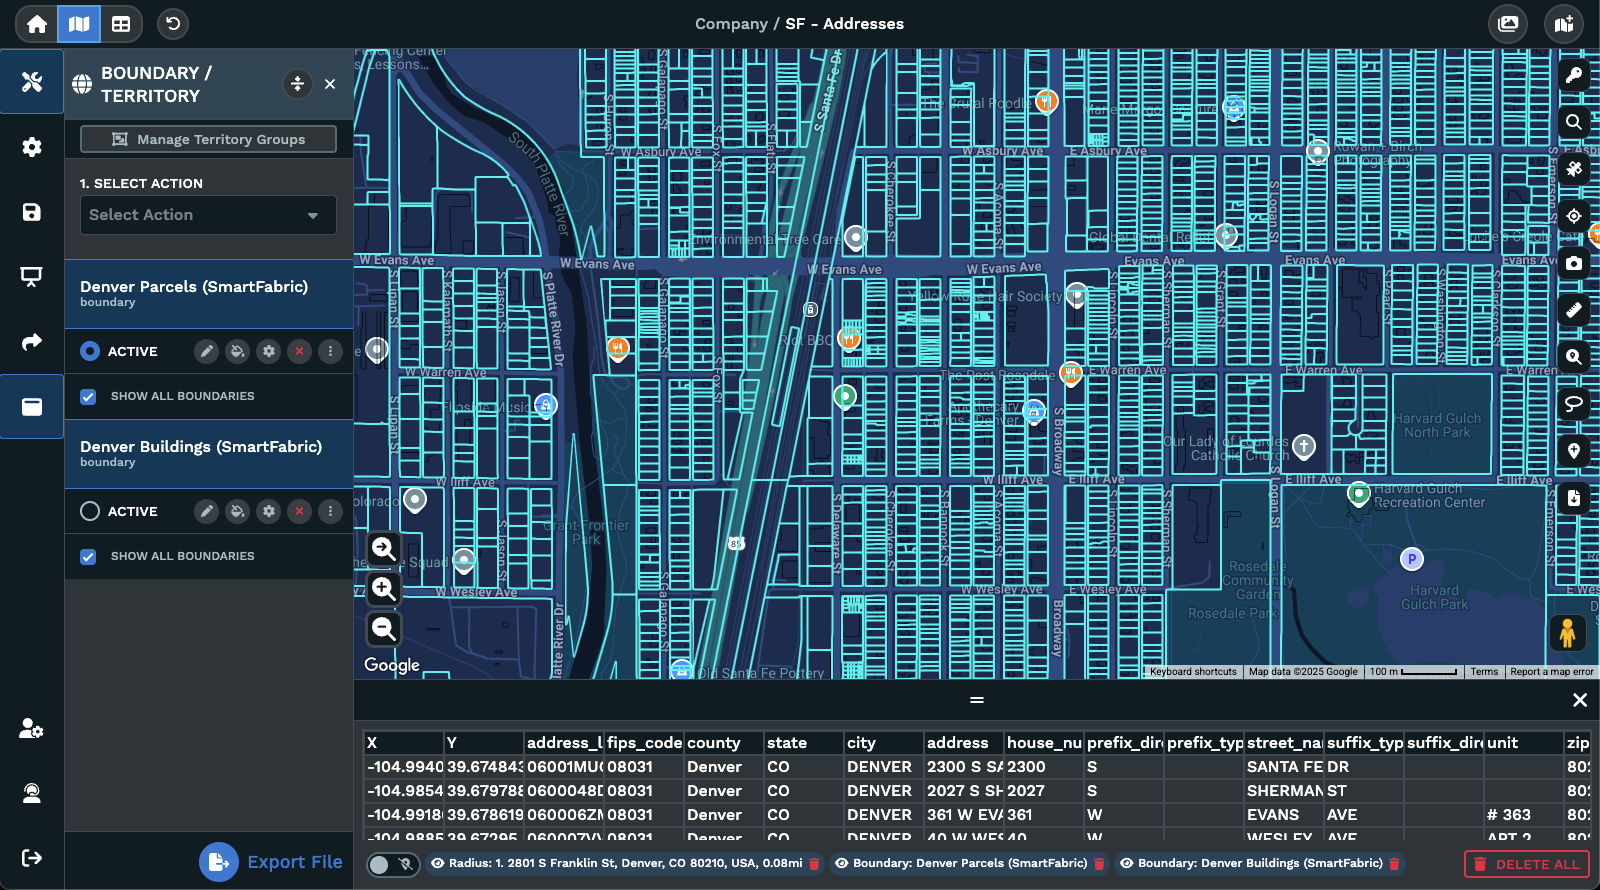
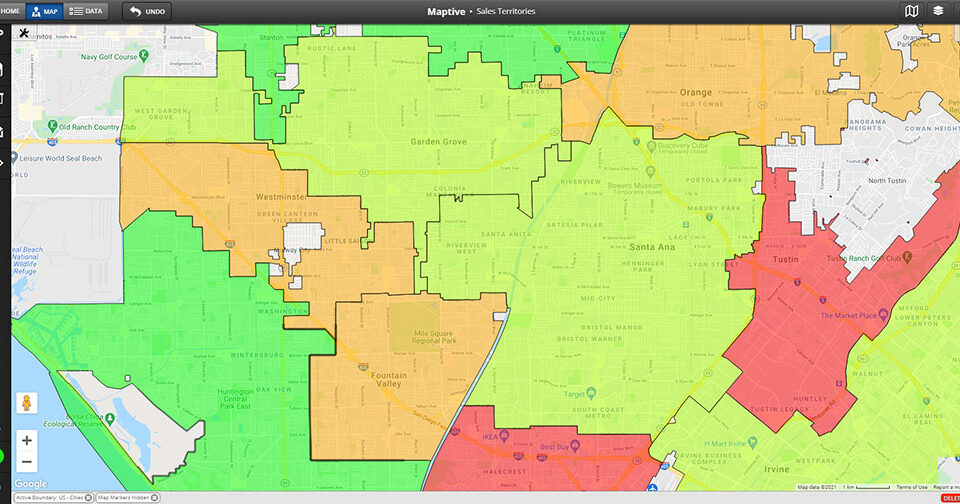
Custom Polygon Regions
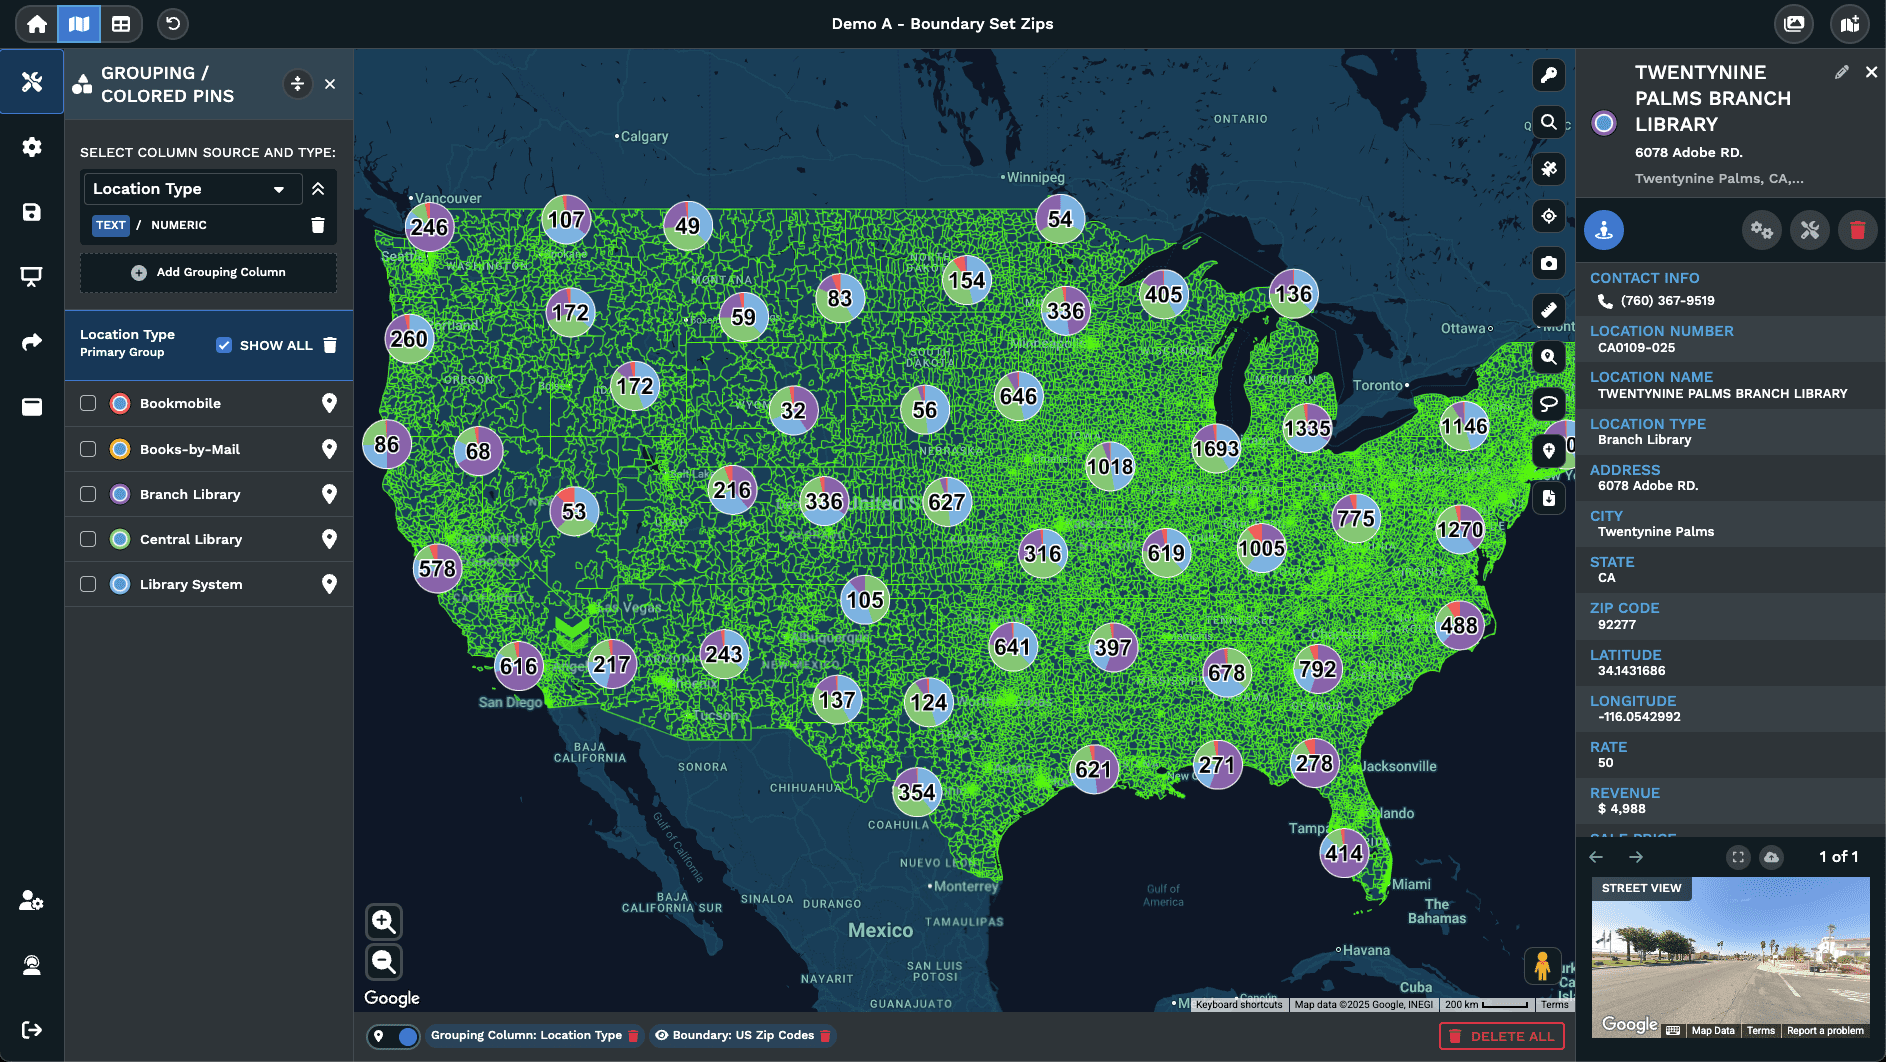
Sequenced Map Numbers
Branded Image Overlay
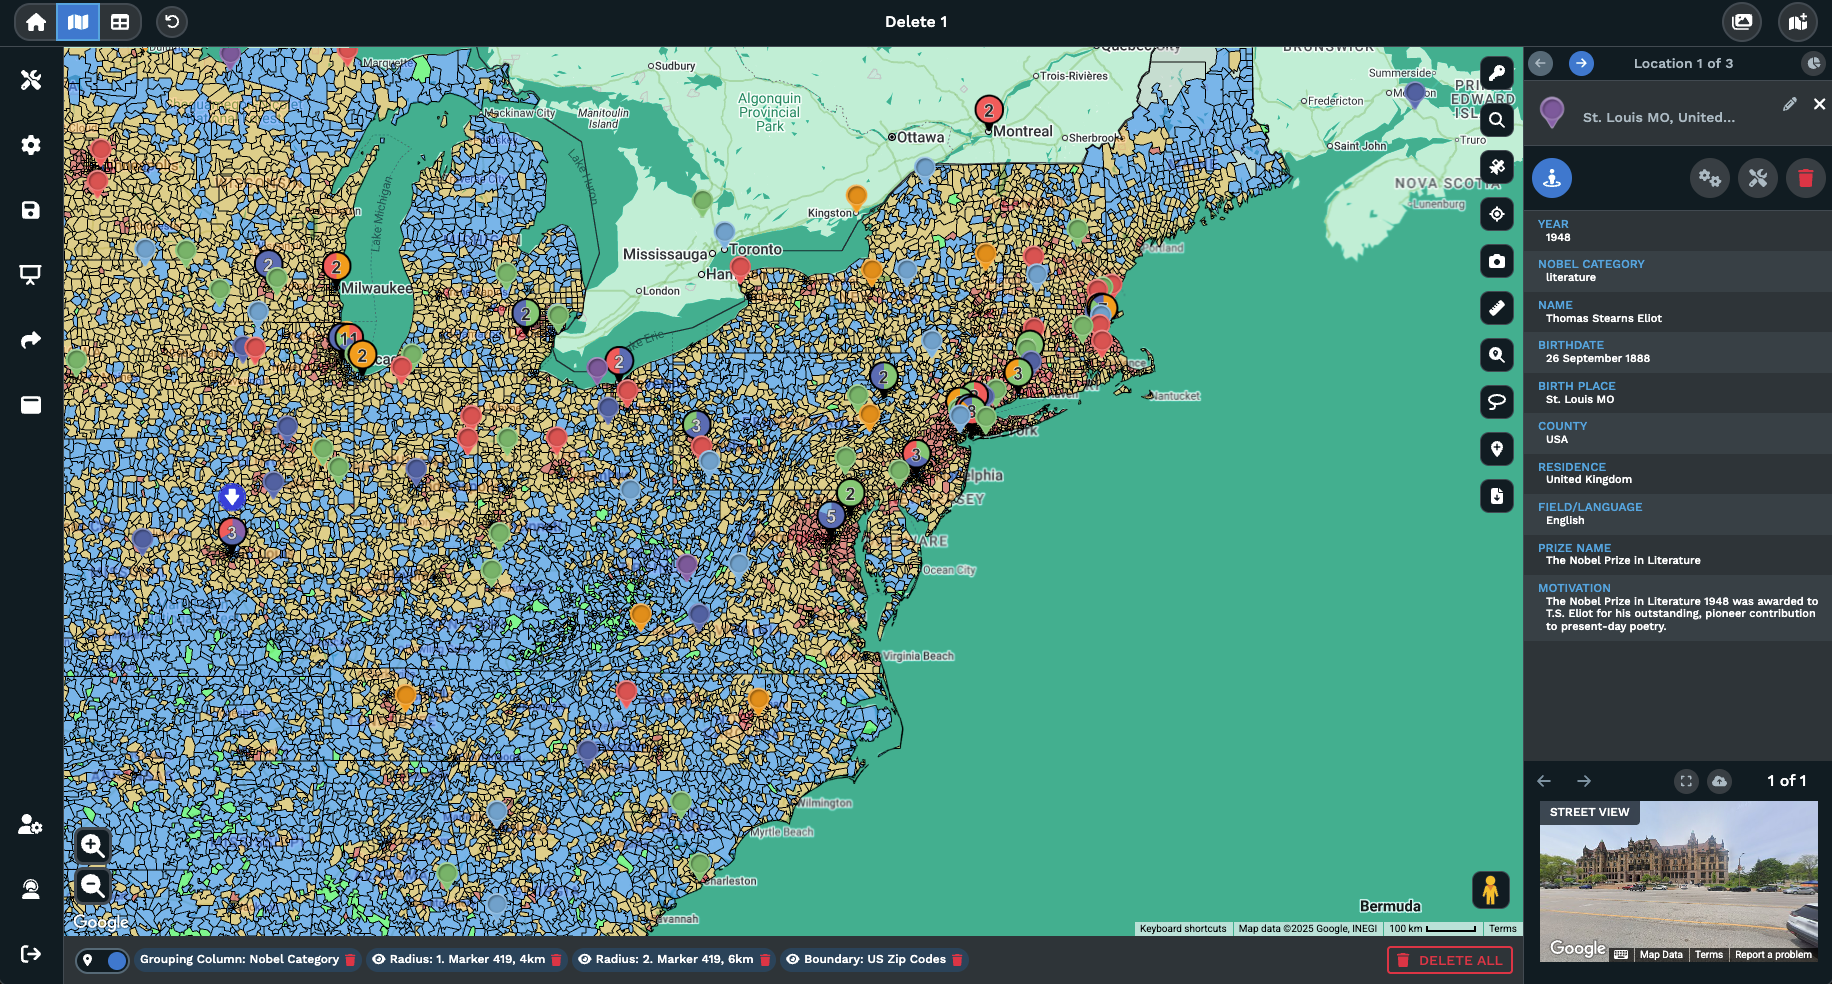
Place Name Tags
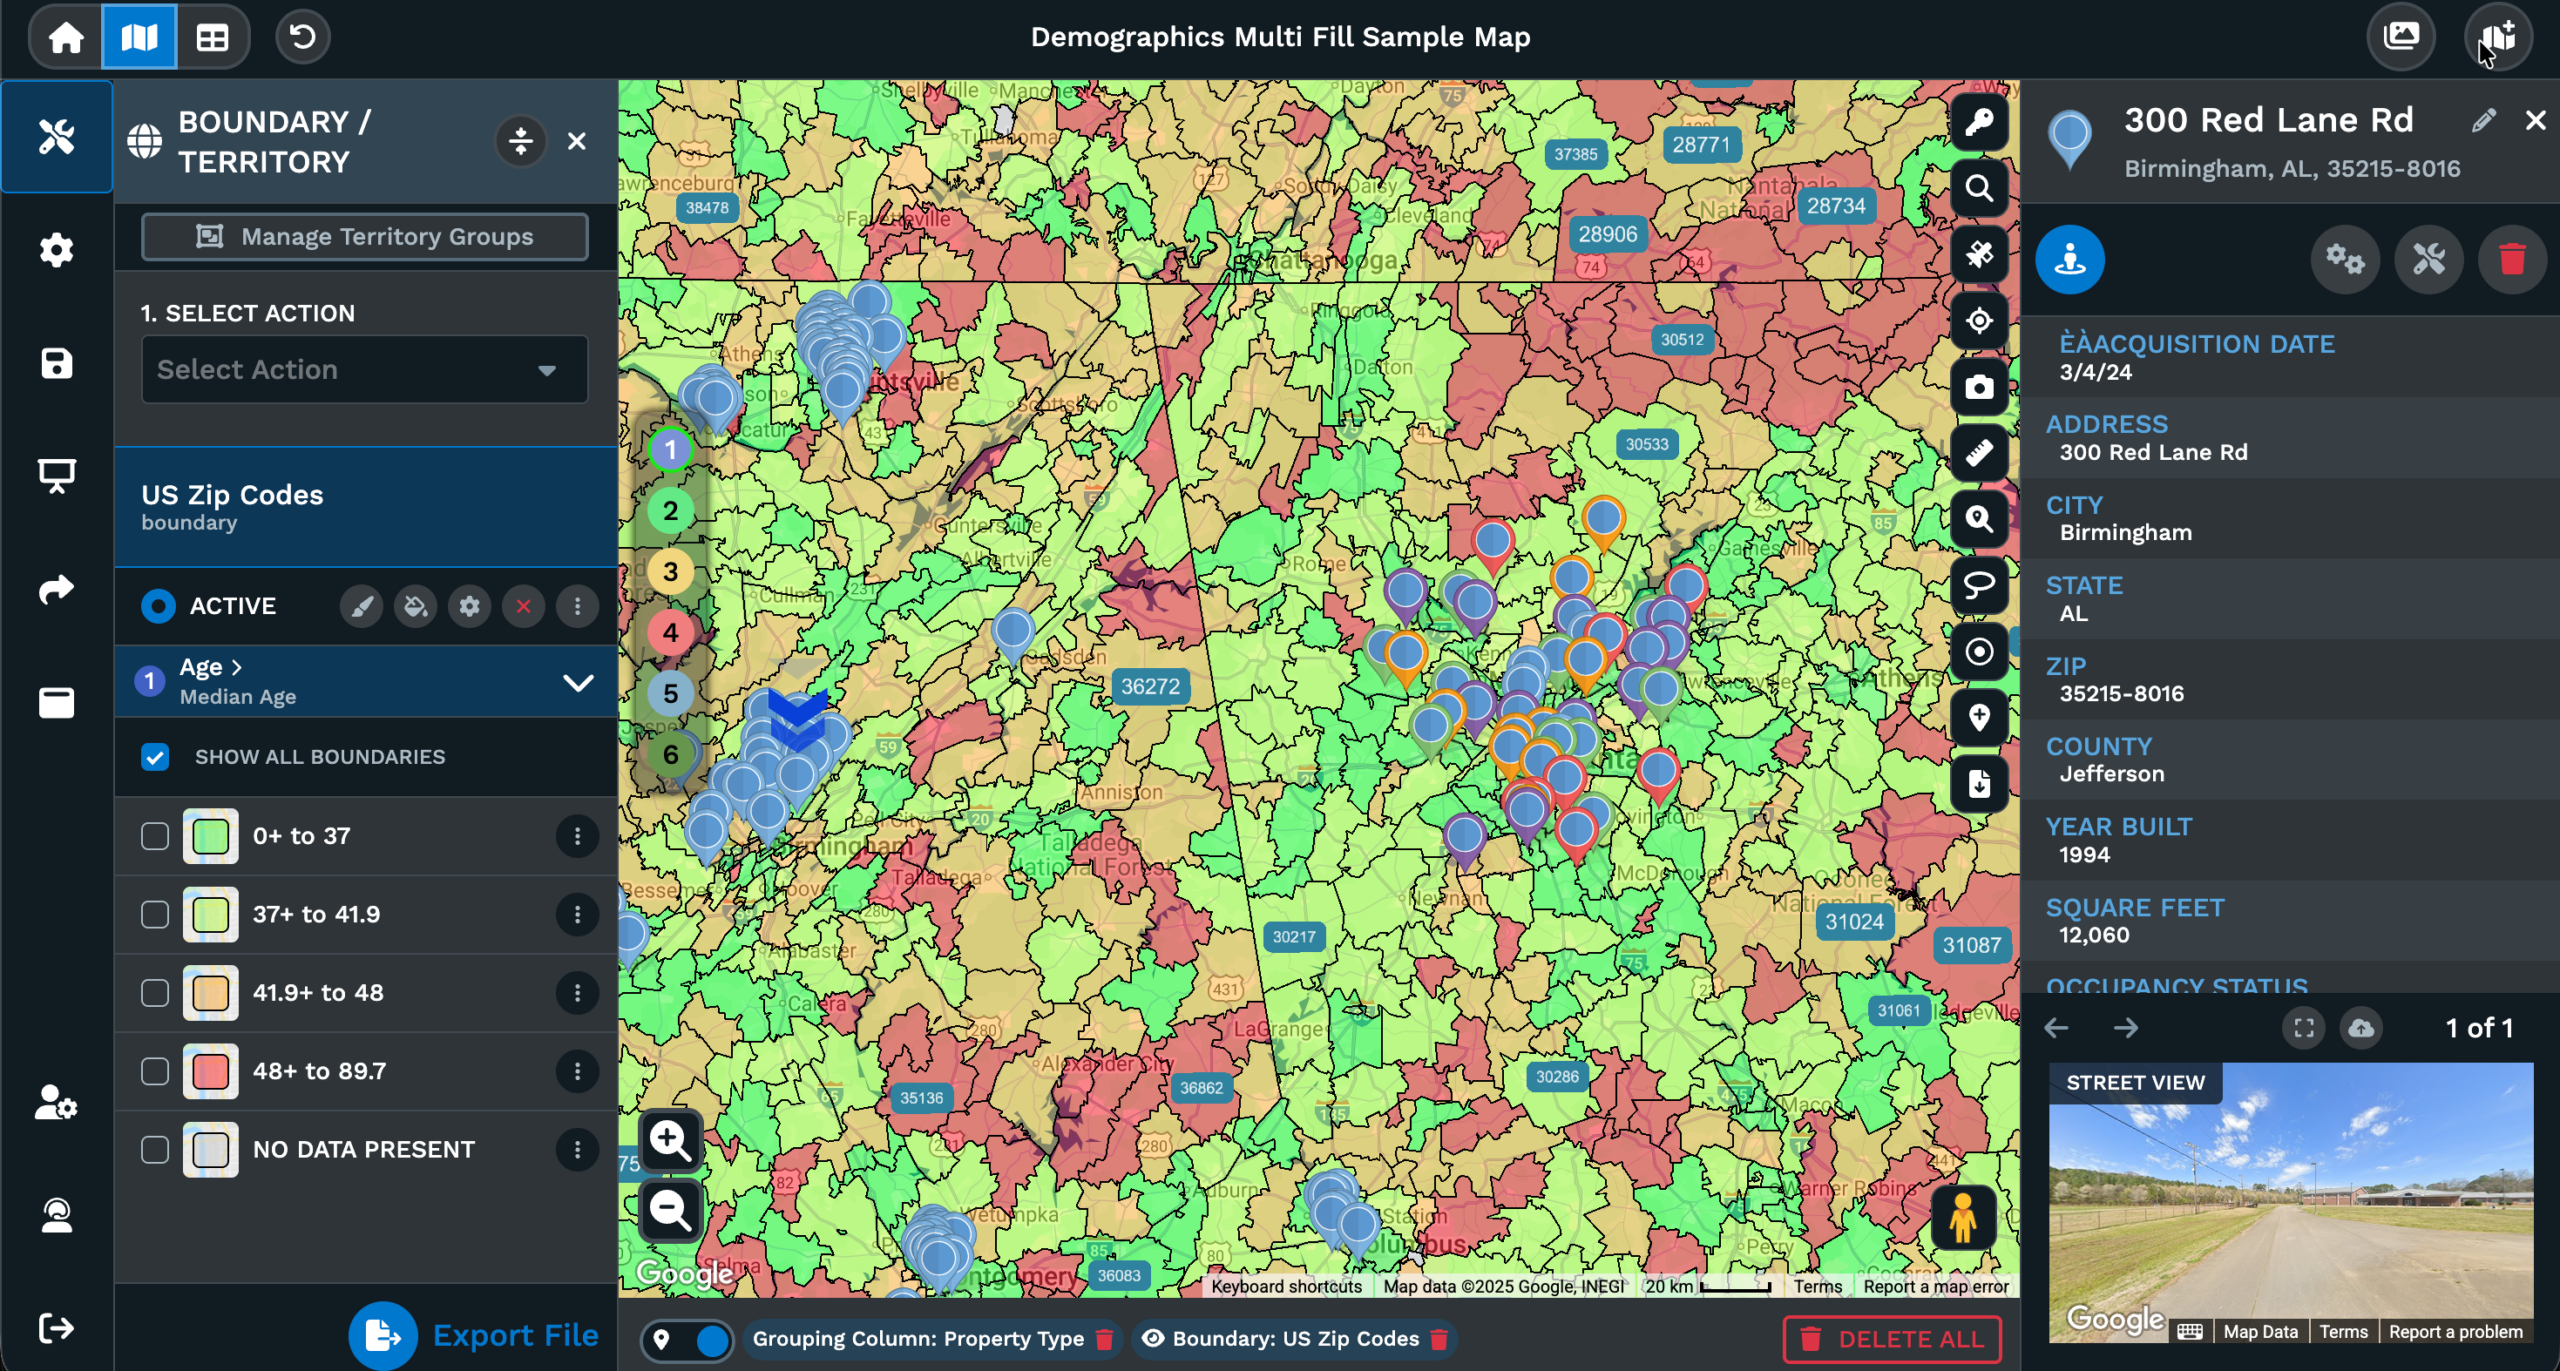
Context Beyond the Data
Adding Annotations to a Map
How Drawing Tool Works
Most maps stop at the markers. You drop pins from a spreadsheet, give them a color, and call it done. The trouble is that a map can carry meaning the markers cannot. A custom region the team agreed on. A flow line between 2 sites. A floor plan over the building footprint. A name tag for a place not in the data. None of that fits inside the marker layer at all.
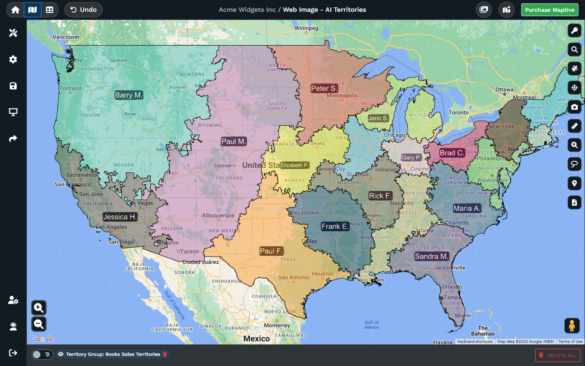
The Drawing Tool in Maptive adds that meaning as a separate layer on the map. From Map Tools you open Manage Drawing Elements, click Start Drawing, and pick a primitive: Polygon, Polyline, Arrow, Label, Number, Text, Callout, Image, Circle, Rectangle, or Icon Marker. Each tool drops its primitive at the spot you click, with a settings panel that controls fill color, line weight, opacity, font, and dot size.
Every primitive sits on top of the markers as an annotation, so the spreadsheet underneath does not change as you draw. Pause Drawing or Stop Drawing closes the session, and the saved primitives stay on the map for later use. Each item is editable after placement: drag the position, restyle through the settings panel, or delete from the trash icon. The drawing layer behaves like a separate canvas that the marker map carries.
All Drawing Tool Options
The Drawing Tool covers 12 primitives, each useful for a different annotation pattern on the map. Closed regions for areas you want to mark off come from Polygon, Rectangle, and Circle, with fill color, line weight, and opacity all editable from the settings panel for every drawn item on the map for the team.
Lines and arrows handle relationships and direction across the map for the viewer. Polyline links a sequence of points across the map for a route or flow line, and Arrow points at a single spot for emphasis on the map. Both have line size, weight, and color editable per drawing, so you can layer multiple flows on the map without them bleeding into each other or the marker view.
Text annotations come in 3 forms for the team. Label attaches text to a draggable dot. Text sits free-floating on the map. Callout points at a spot with a leader line. All 3 are styled with font, dot size, dot color, background color, and font color. Number sequences come from Draw Number, with the value set in the panel before each placement on the map. Image overlays drop a logo, photo, or floor plan from Upload/Display Image with a toggle for scale-with-zoom or fixed sizing on the map for the team.
Drawing Layer vs Markers
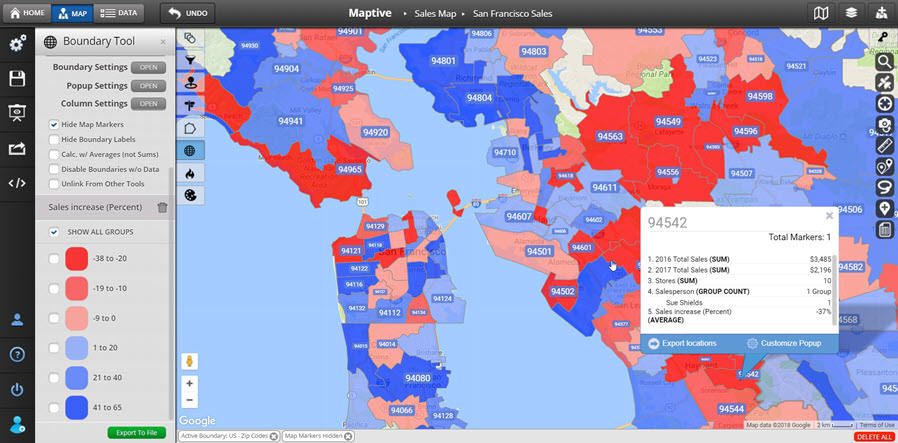
Maptive draws a clean line between the marker data and the drawing layer on the map. Markers come from your spreadsheet. Each row is a location, and the column data follows along for filtering, summing, and routing the team work. Drawings are different. The Maptive docs note that for Circle, Polygon, and Rectangle, the items are drawings and no data can be extracted from them in any export.
The split is useful in practice. You can keep a clean source of truth in the spreadsheet that drives the marker layer, and you can decorate the same map with custom regions, arrows, and labels that nobody on the team will mistake for source records. The marker totals stay marker totals, and the drawing layer stays a visual aid on top of the map view that the team uses for context.
Editing the drawings does not touch the spreadsheet sitting underneath. Drag a label, restyle a polygon, redraw a polyline, or delete a callout, and the underlying source rows stay where they are in the data. The same goes for adding new annotations: a Draw Number placed for a tour stop or a Draw Icon Marker placed for a transit stop adds a visual layer that lives on the map, with no merge conflict against the source data.