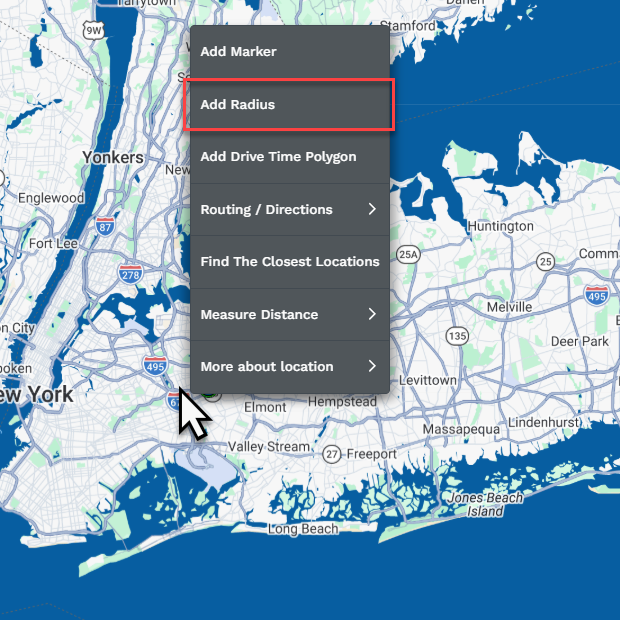
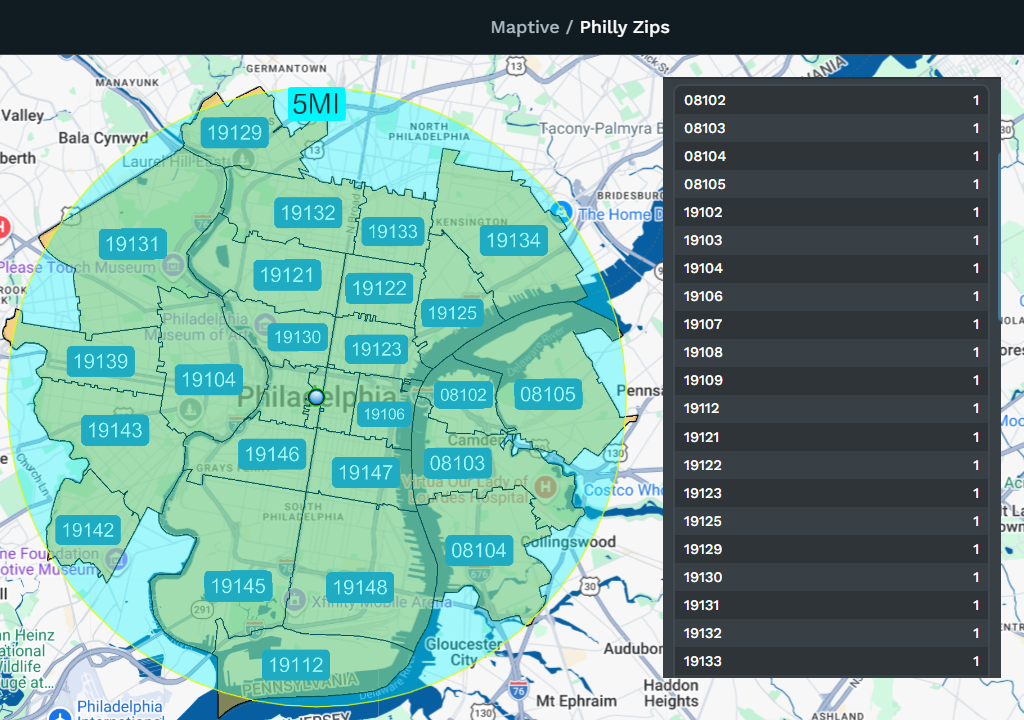
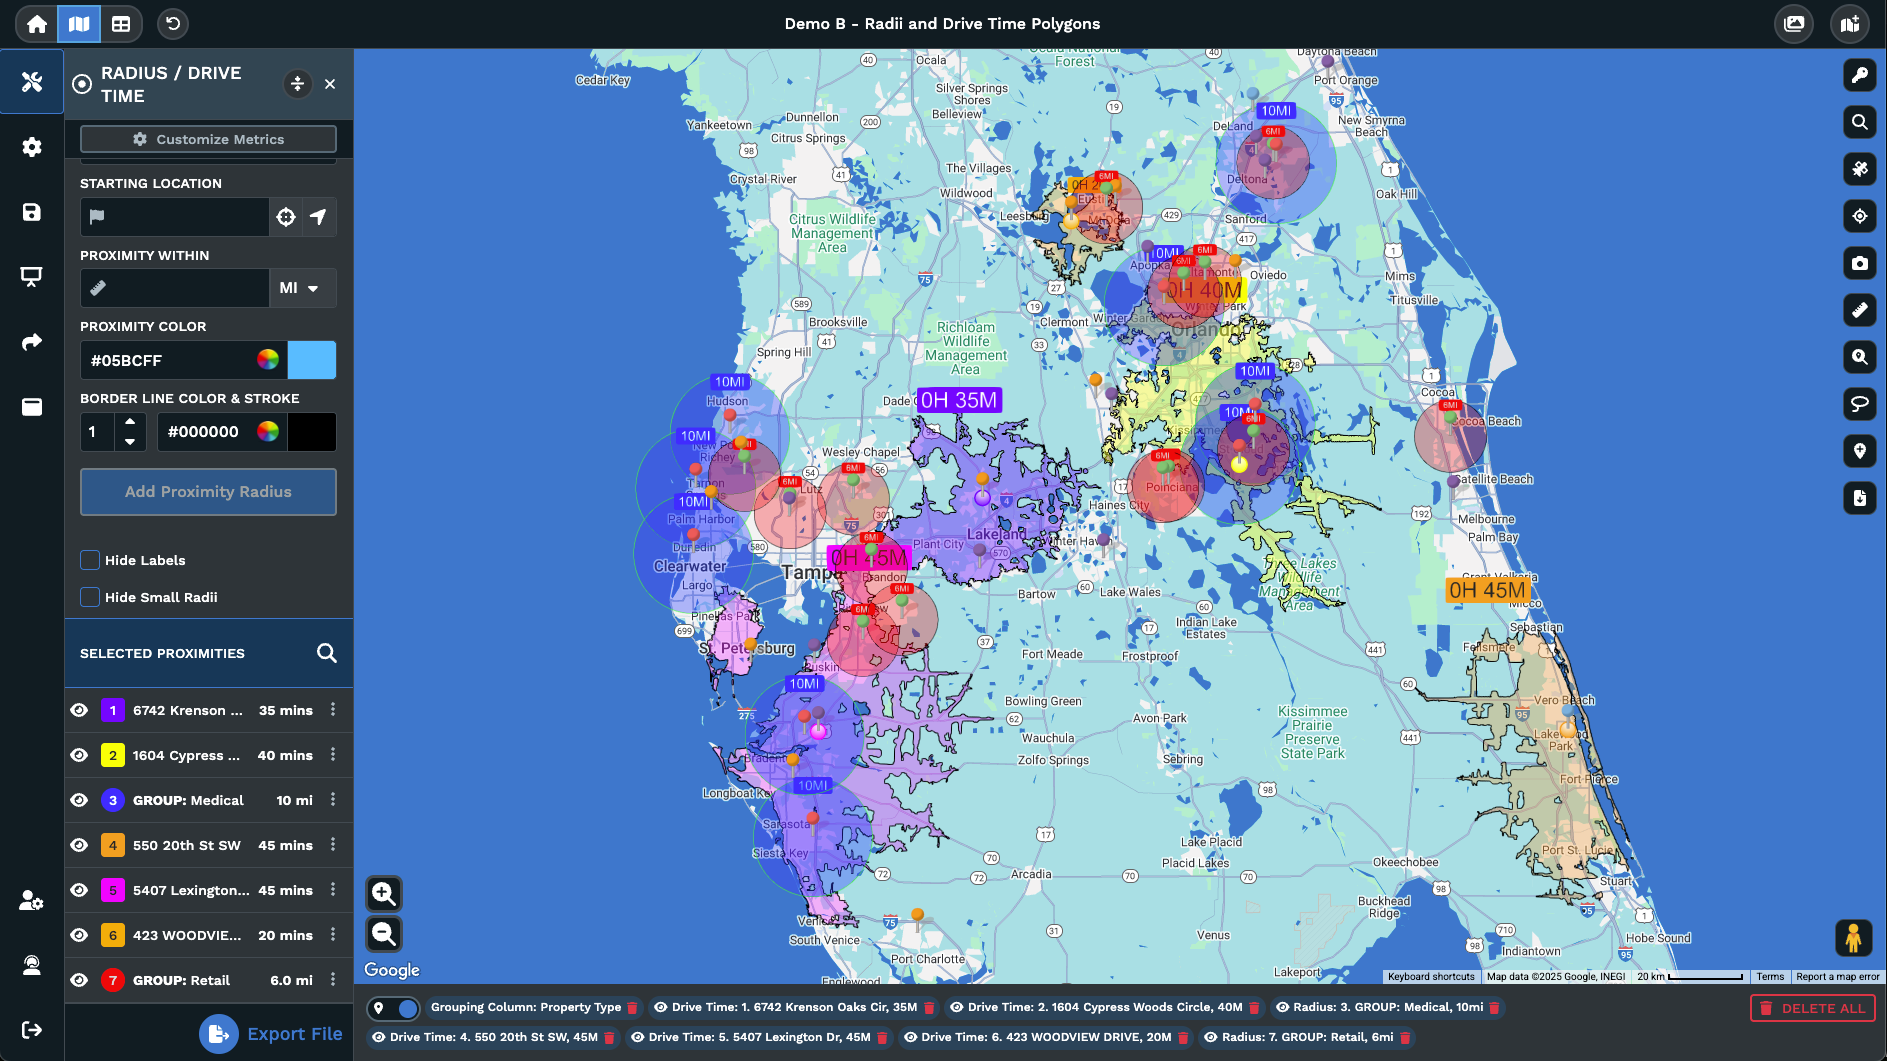
1How many radius circles can I place on a single map?
There is no fixed cap on the number of circles you can place. You can add as many as your project needs, each with its own center point, distance, and color. Every circle gets listed in the tool panel on the left side of your screen where you can manage it individually by editing, hiding, or removing it at any point.
2Can I add radius circles in bulk instead of one at a time?
Yes. Switch the Apply To setting from Individual Location to Group, then pick a data column and a specific value from it. Maptive will generate a radius circle around every marker that matches your selection. This works well when you need a uniform radius around every location in a state, region, or business category without placing each circle by hand.
3What is the difference between miles and kilometers in the radius tool?
The Proximity Within field includes a dropdown that lets you pick between miles and kilometers before you create each new circle. The unit applies only to the circle you are building at that moment, so you can place one circle in miles and another in kilometers on the same map if your data set calls for both units of measurement.
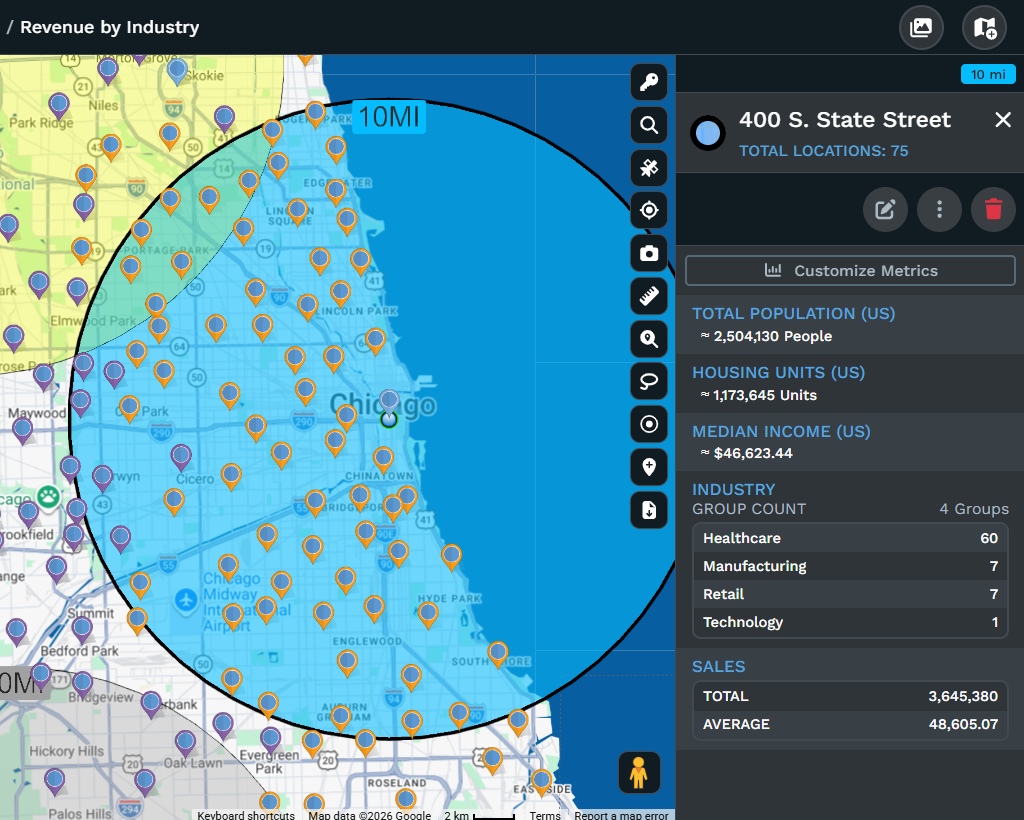
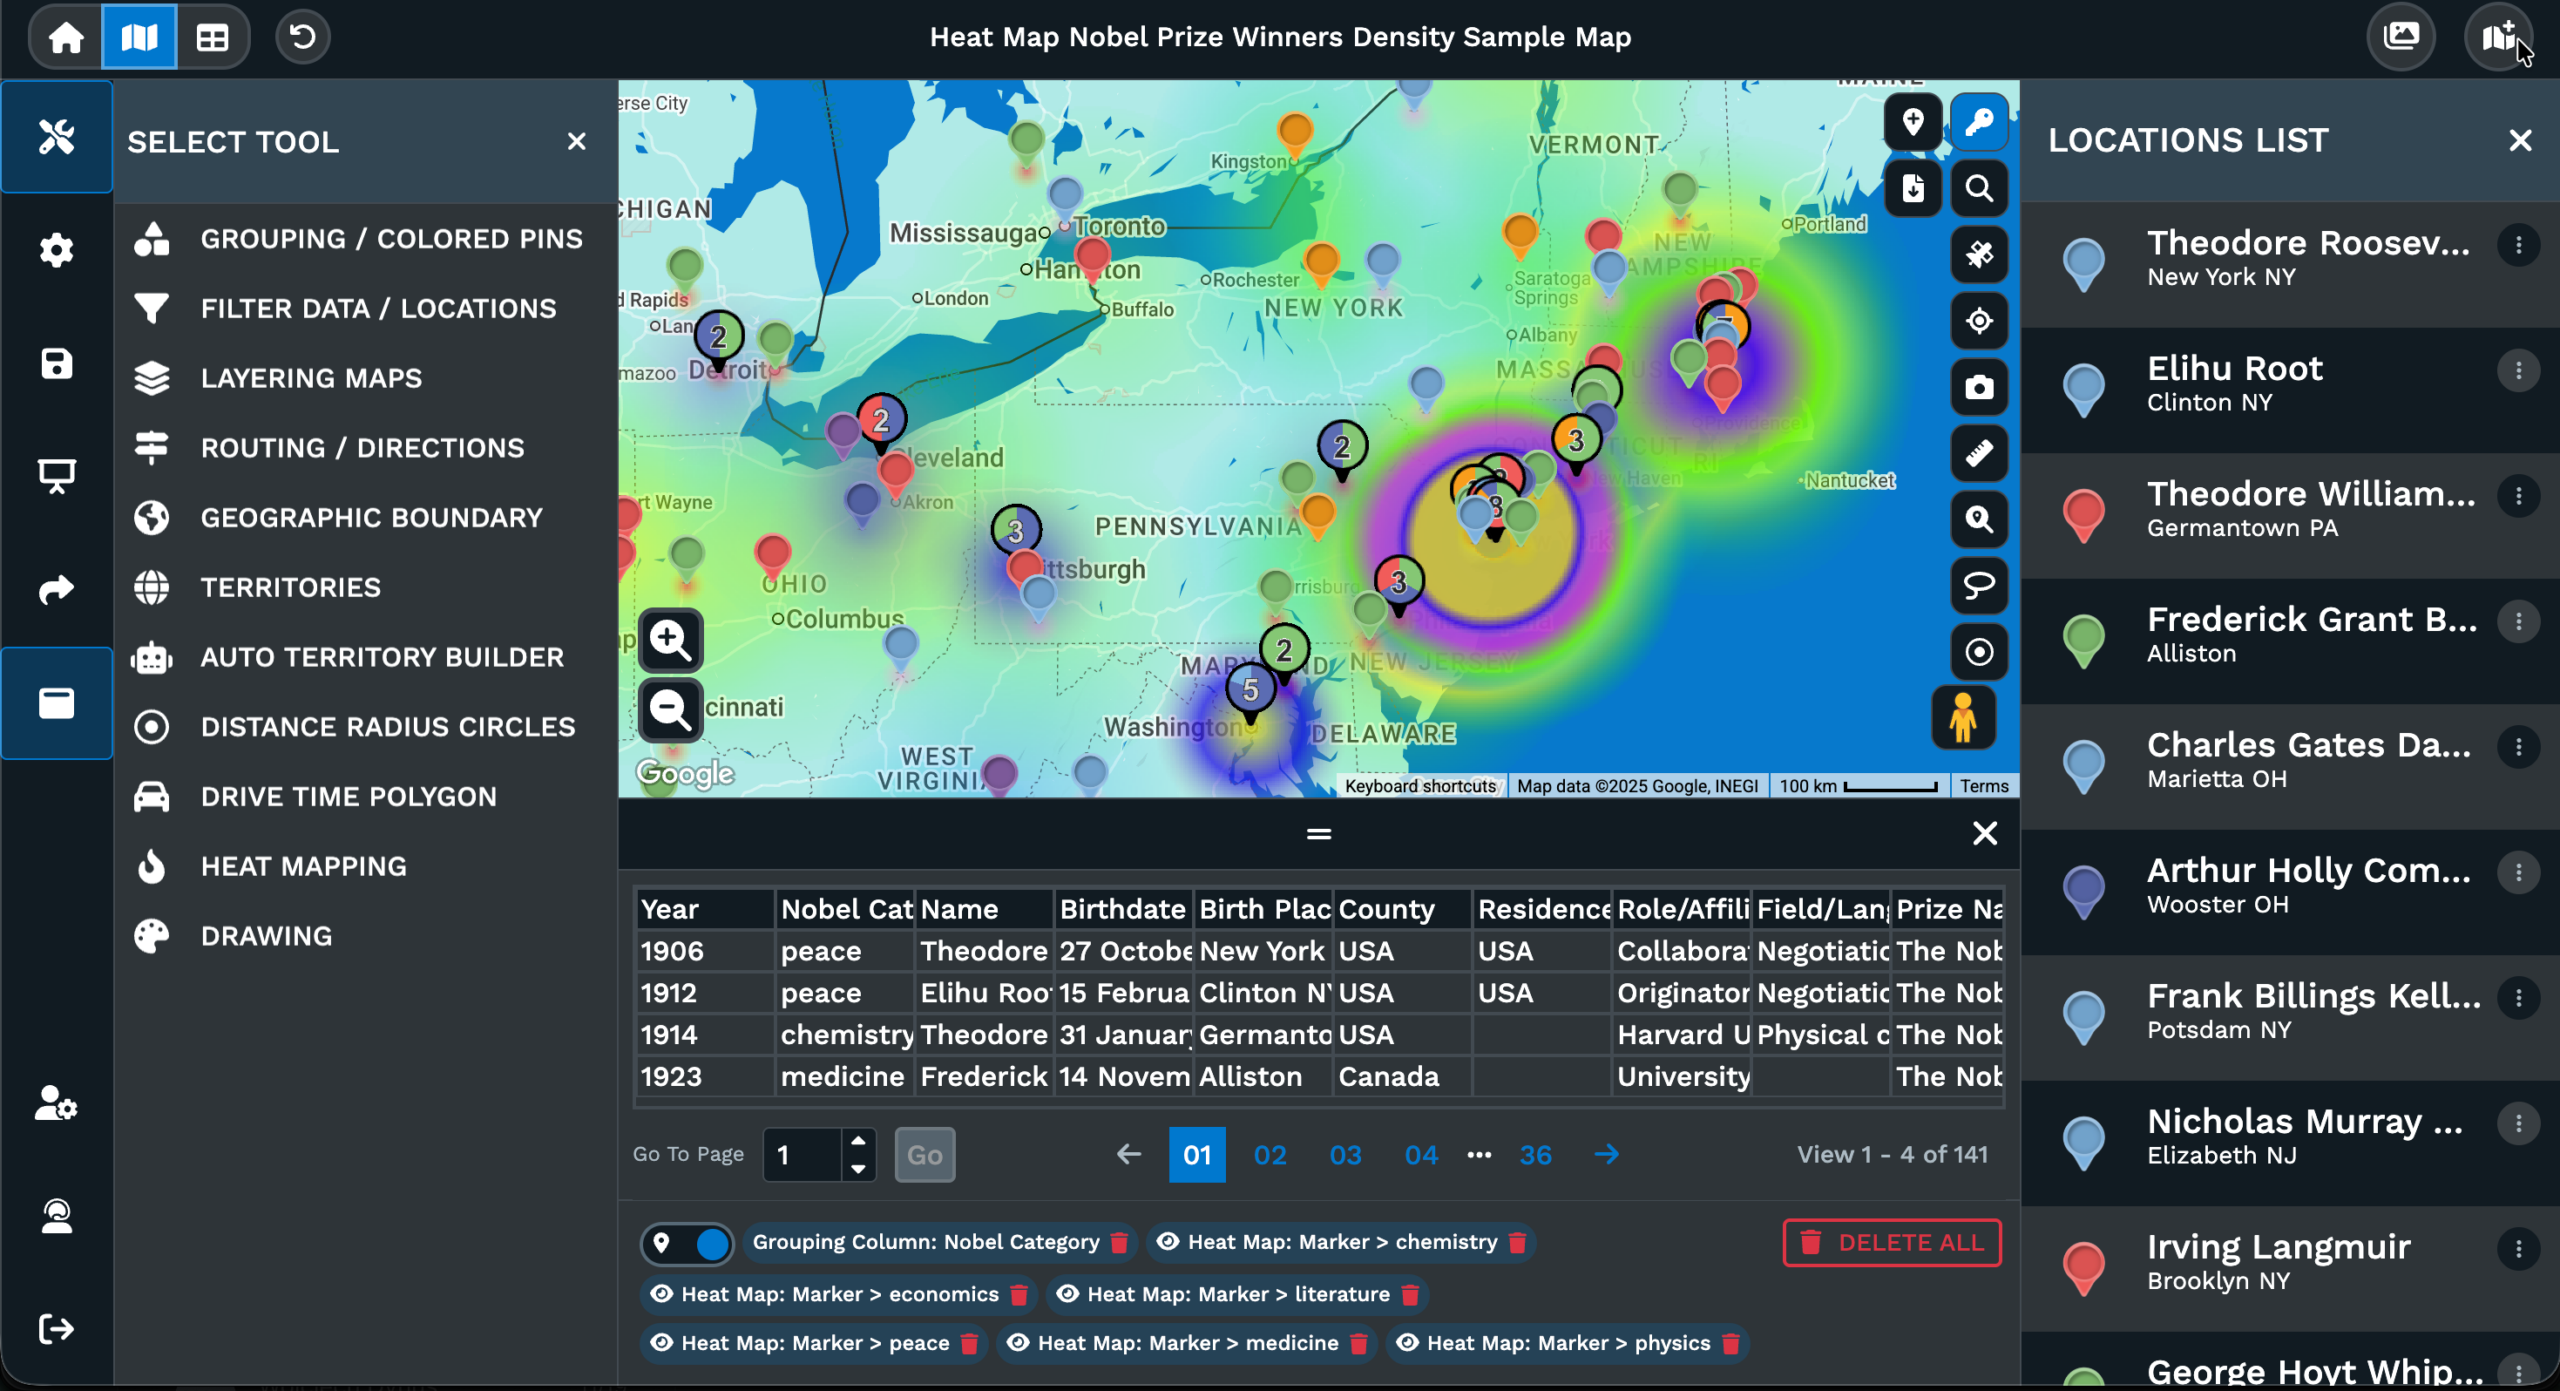
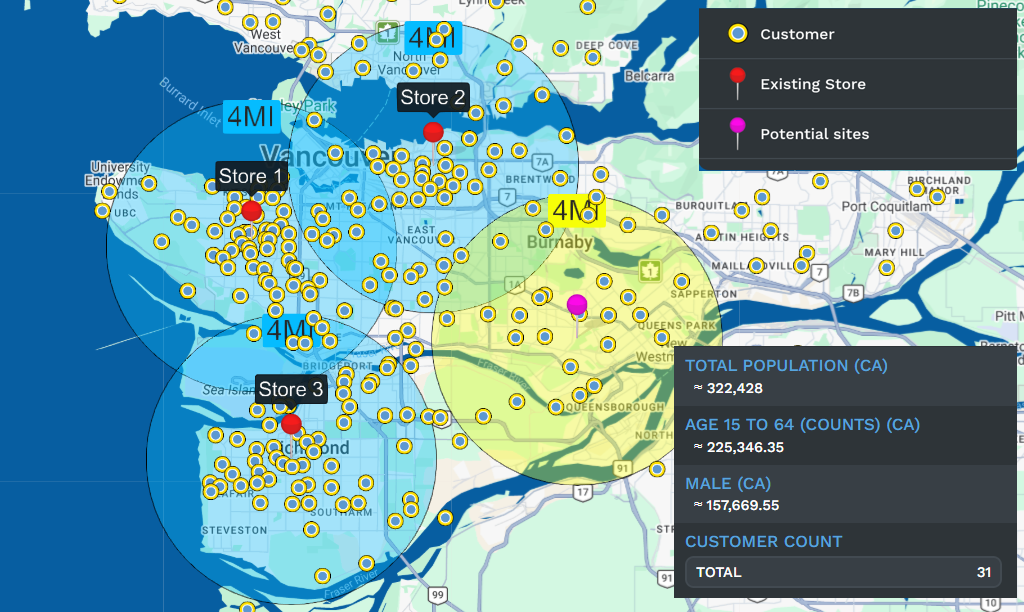
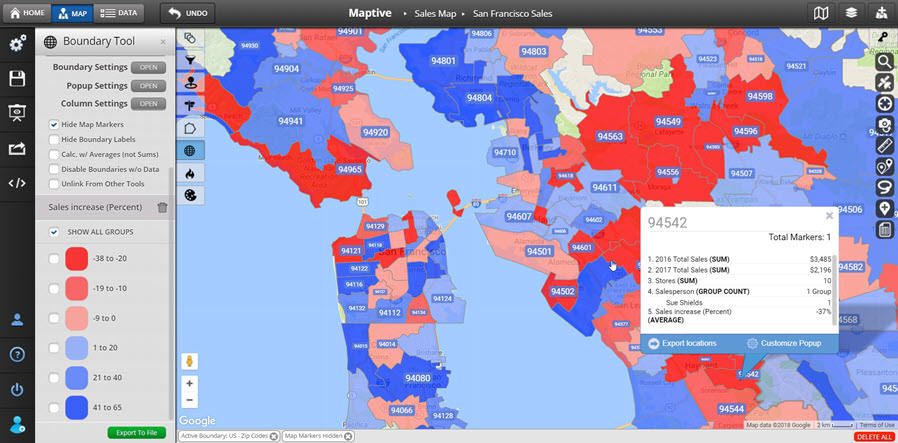
4Can I see demographic data inside a radius circle?
You can. Click inside any circle to open its popup, then select Customize Metrics. From there you can add columns from your uploaded spreadsheet or pull in built-in US and Canadian census fields like total population, median household income, and age distribution. The popup refreshes to include those numbers so you can assess the area's profile directly on the map.
5How do I move a radius circle after placing it?
Double-click the center point of the circle to enter edit mode, then click and hold inside the circle and drag it to a new position. When it is where you want it, click the green checkmark to save or the red X to cancel and return the circle to its original location. This avoids having to delete and recreate the circle.
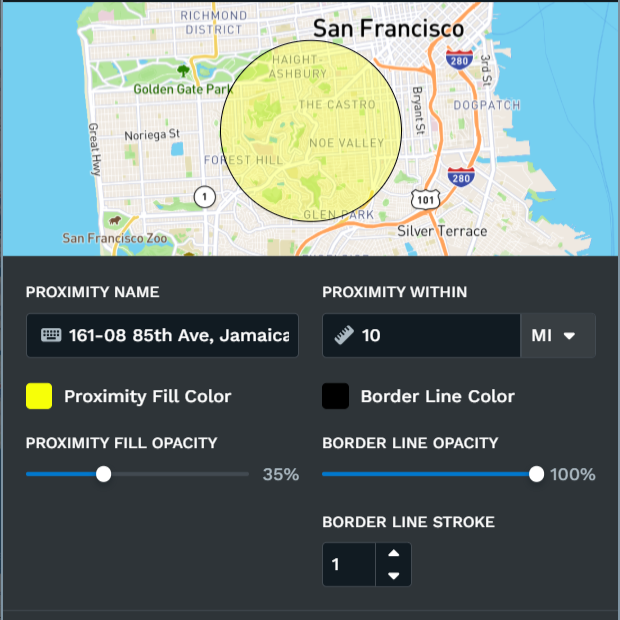
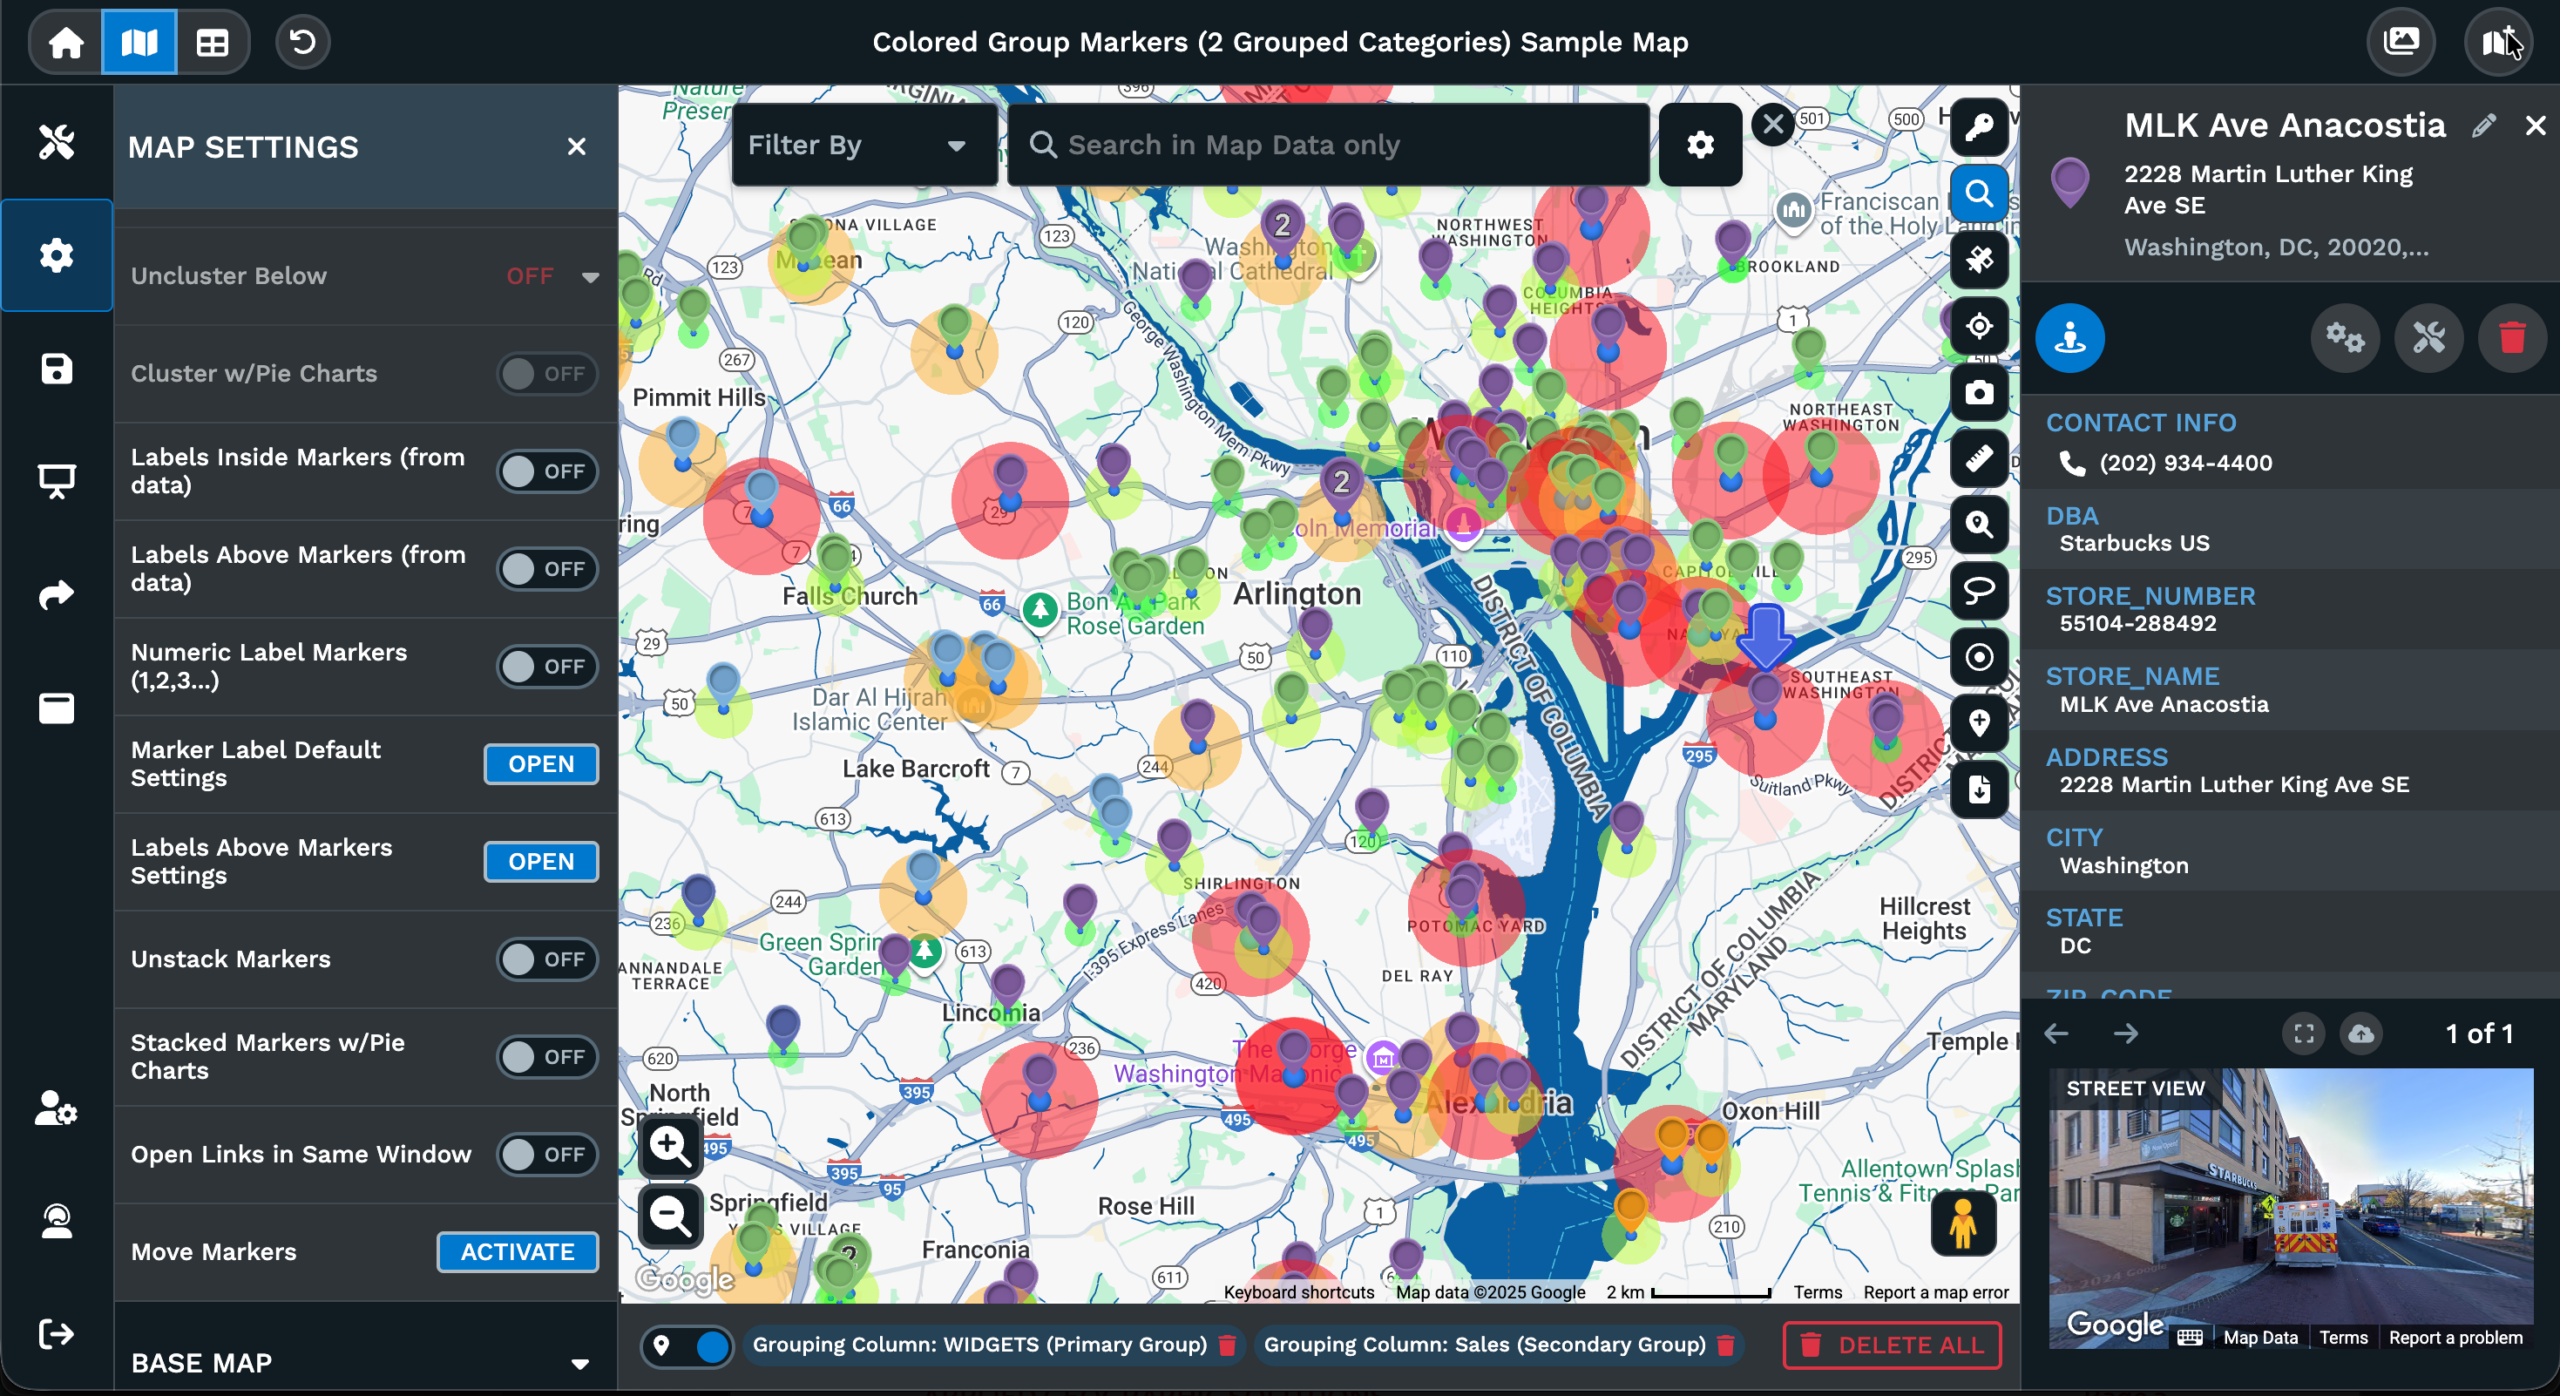
6Can I change how a radius circle looks after I create it?
Click the kebab menu next to the radius listing in the tool panel and select Edit Proximity. A dialogue box opens where you can update the circle's name, distance, fill color, fill opacity, border color, border opacity, and border line thickness. Click Save and those changes apply to the map immediately so you do not need to rebuild the circle.
7What file formats can I export radius data to?
Maptive supports exporting radius data to xlsx, tsv, and csv formats, and there is also a copy-to-clipboard option if you want to paste results directly into another application. Each exported file includes the markers from your data that fall within your radius, along with an optional distance column you can set to straight-line distance or driving distance with estimated drive time.
8Can I export only the closest markers to the center point?
You can. The export settings include an option to limit results to a specific number of markers nearest to the center point. This is useful when your radius contains a large number of locations but you only need the closest ten or twenty for a call list, delivery schedule, or field visit plan that your team can act on right away.
9What happens when I export markers from multiple circles at once?
When exporting from all circles at once, Maptive includes a deduplication toggle that assigns each marker to the single closest circle. This prevents the same row from appearing more than once in your file when circles overlap. You also have the option to export markers that fall outside all circles, which gives you a list of locations currently beyond your coverage.
10Does filtering my map data affect the radius circles I have placed?
Circles added through the Group function will filter along with your data, so only the circles whose markers match your active filter will remain visible. Circles placed individually around a typed address or a clicked point on the map are not affected by data filters and will stay visible unless you manually hide or delete them from the tool panel.
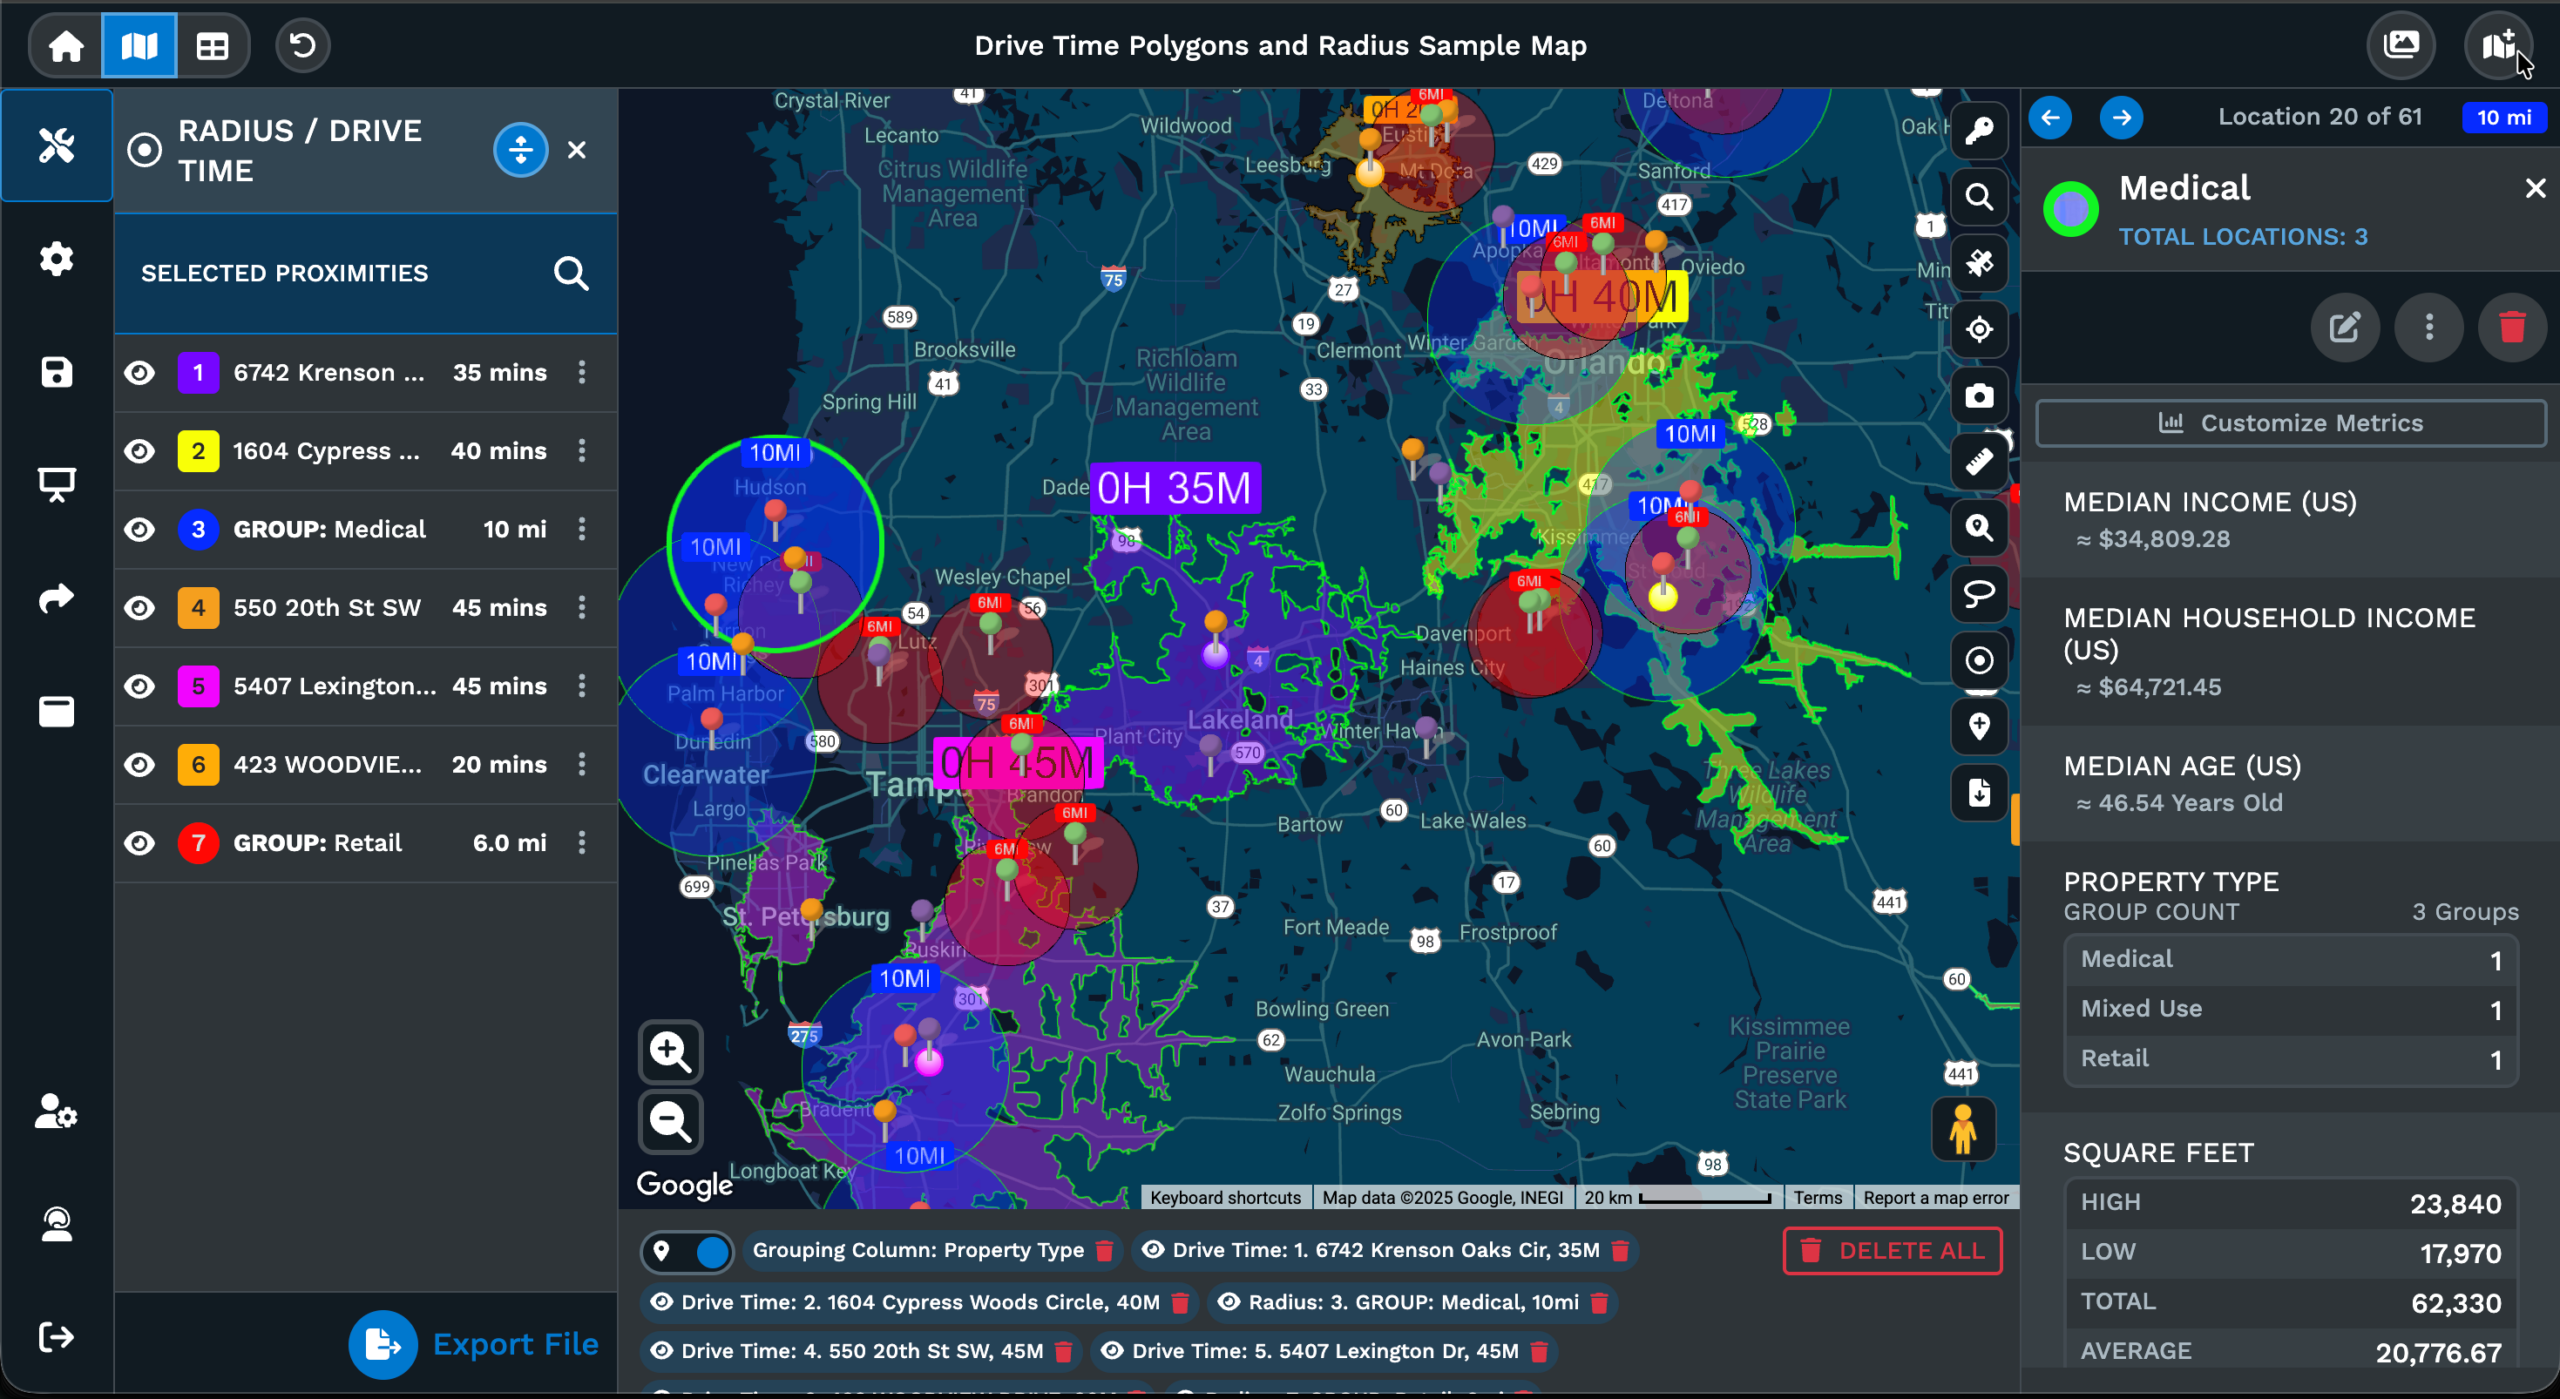
11Can I use the radius tool together with heat maps or boundary overlays?
Radius circles render alongside every other Maptive tool without any conflict between them. You can display them on top of heat maps, boundary overlays, grouped markers, drive-time polygons, or route layers all on the same map. Each tool operates on its own layer, so turning one on or off does not affect the others you have active on your map.
12Is there a way to share my radius map with someone who does not have a Maptive account?
You can generate a shareable link or an embed code for your map, and anyone with that link can view and interact with it in their browser without needing to log in. They will see your radius circles, markers, and any other layers you have active. Maptive also supports exporting the map view for use in slide decks or printed reports.