Retail Store Planning Software
Maptive shows you where your next store should open and where your current ones leave sales on the table. Plot customers, map trade areas, and rank sites on demand.
No credit card required
- Score sites by demographics
- Map trade areas & catchments
- Check store cannibalization
- Drive-time rings per location
- Layer income, age & density
- Compare candidate sites
Trusted by teams at


Where Retail Teams Come Out Ahead
Demographic and trade-area analysis on one screen replaces weeks of pulling reports from separate tools.
Targeting by demand rather than broad geography keeps the budget on the areas that return it.
Full chains, competing sites, and prospect lists load together, with no regional batching.
Inside a Retail Site Decision
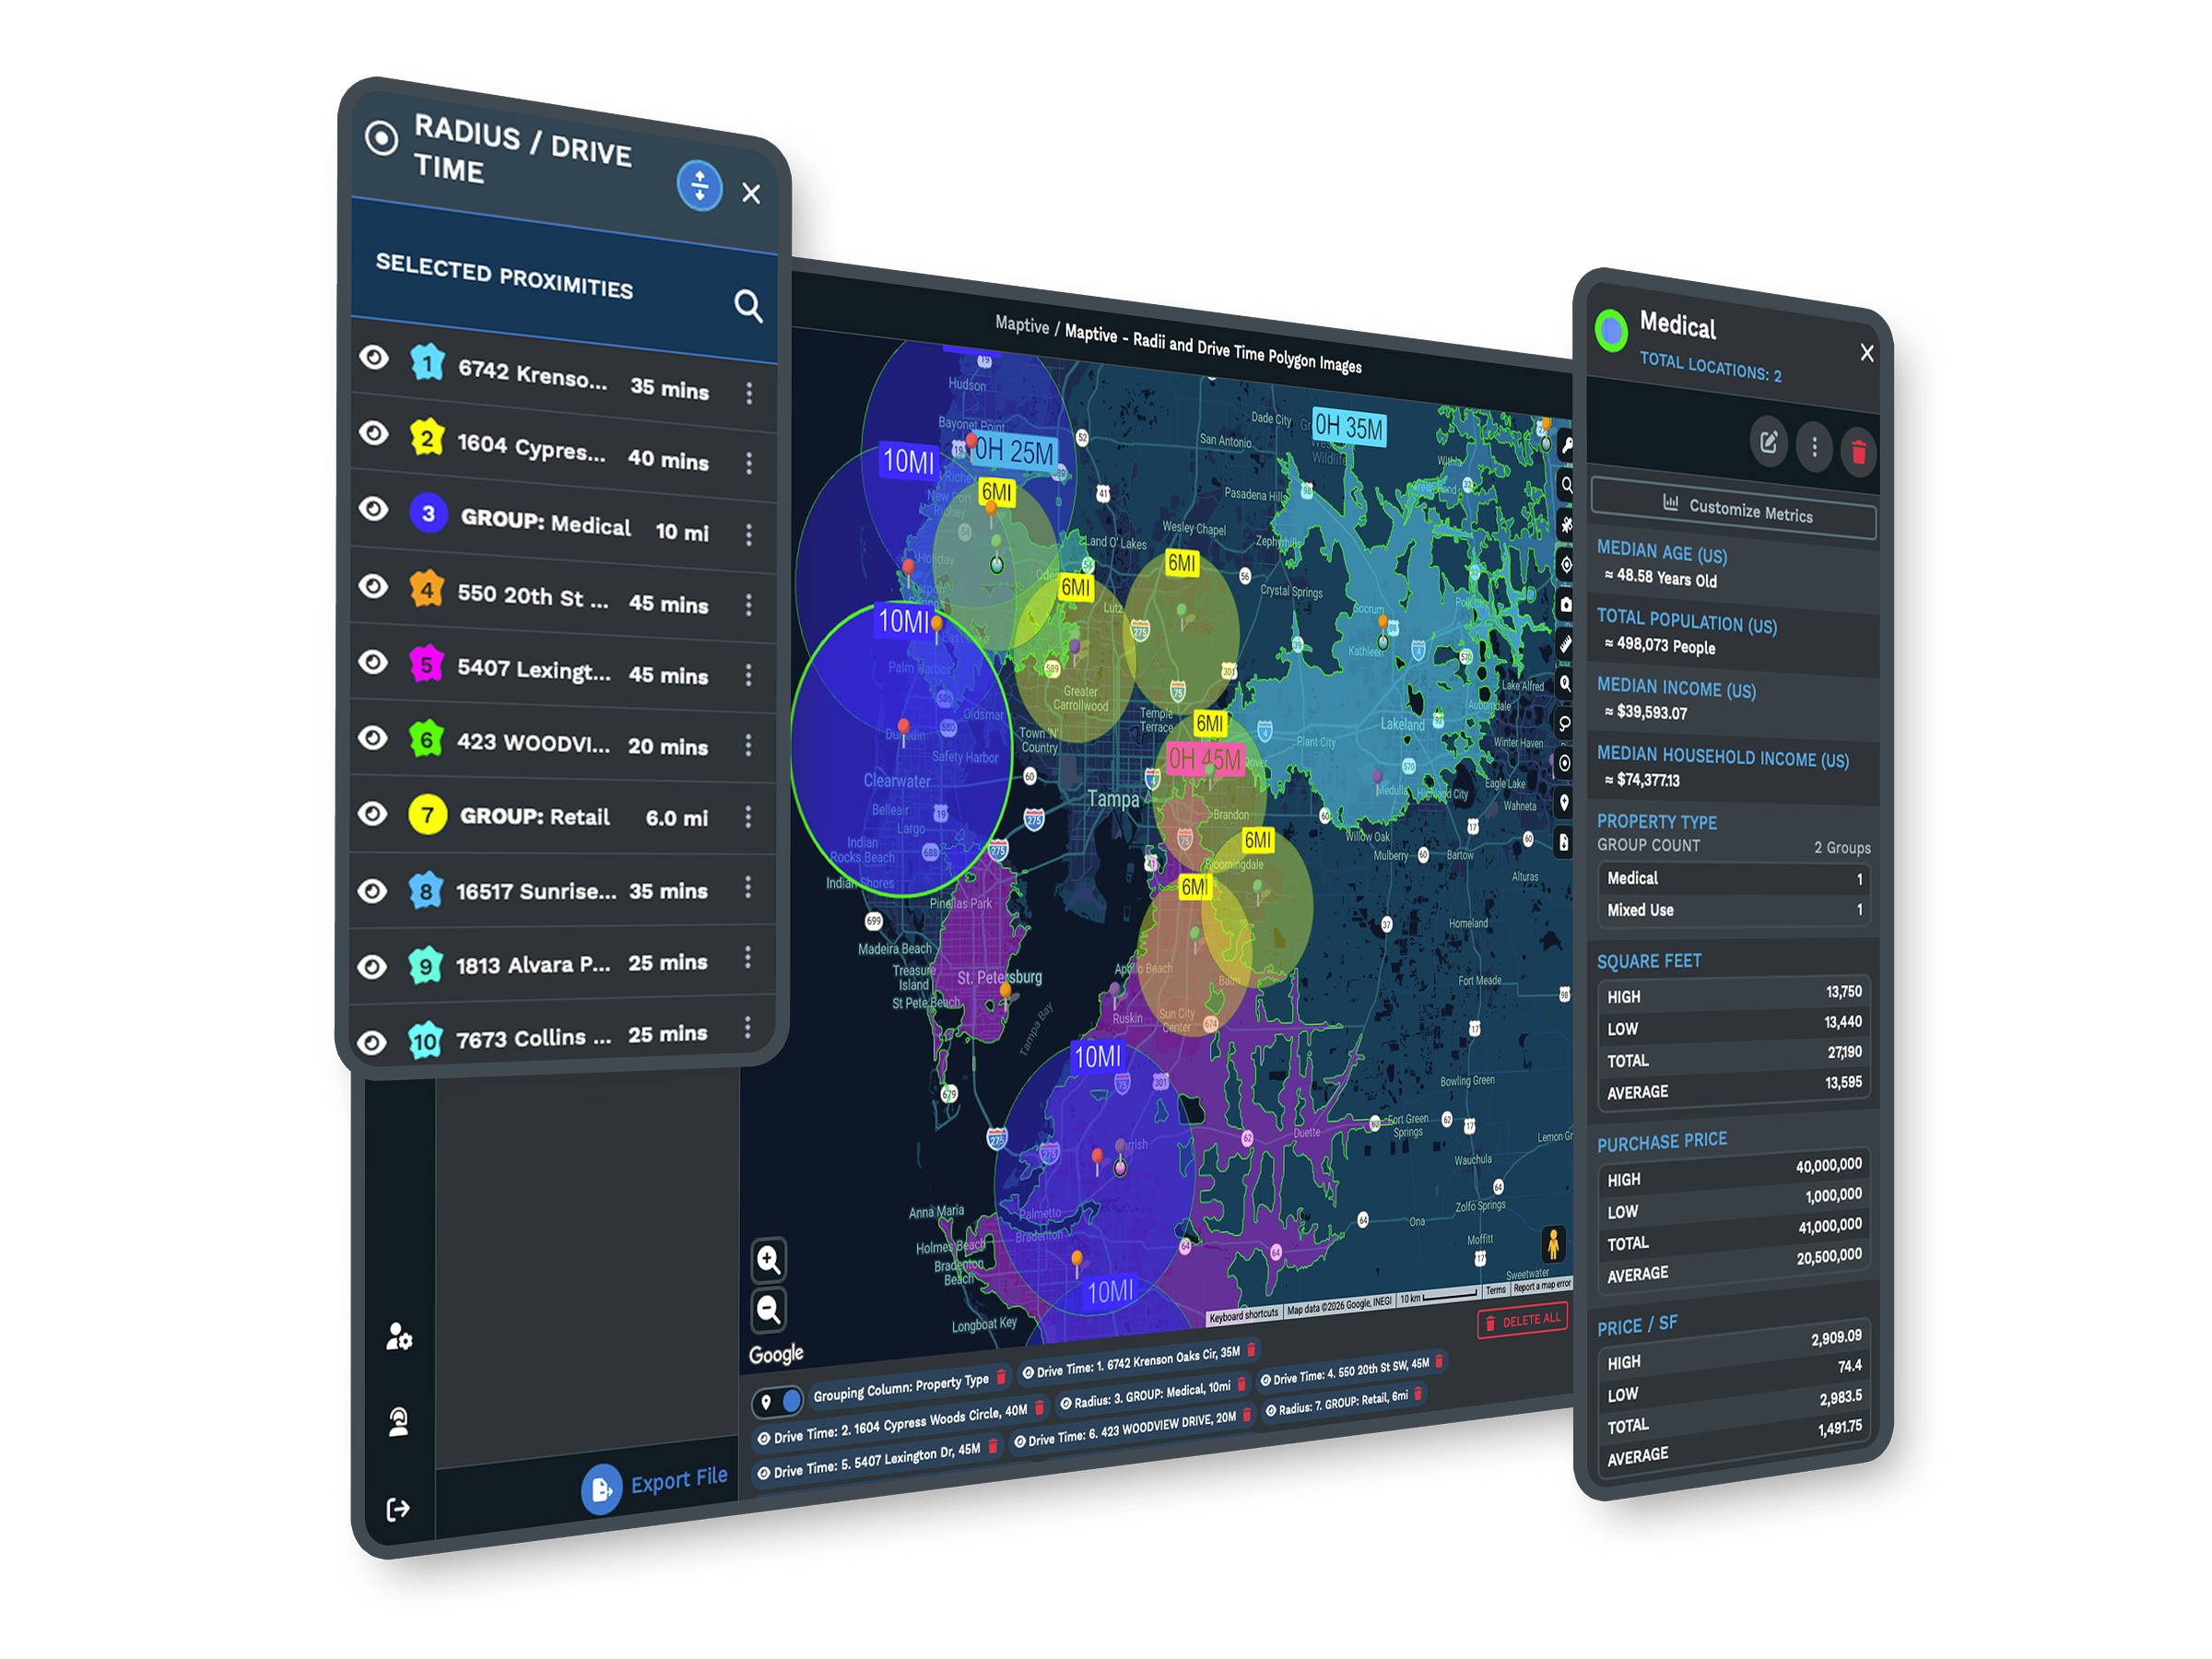
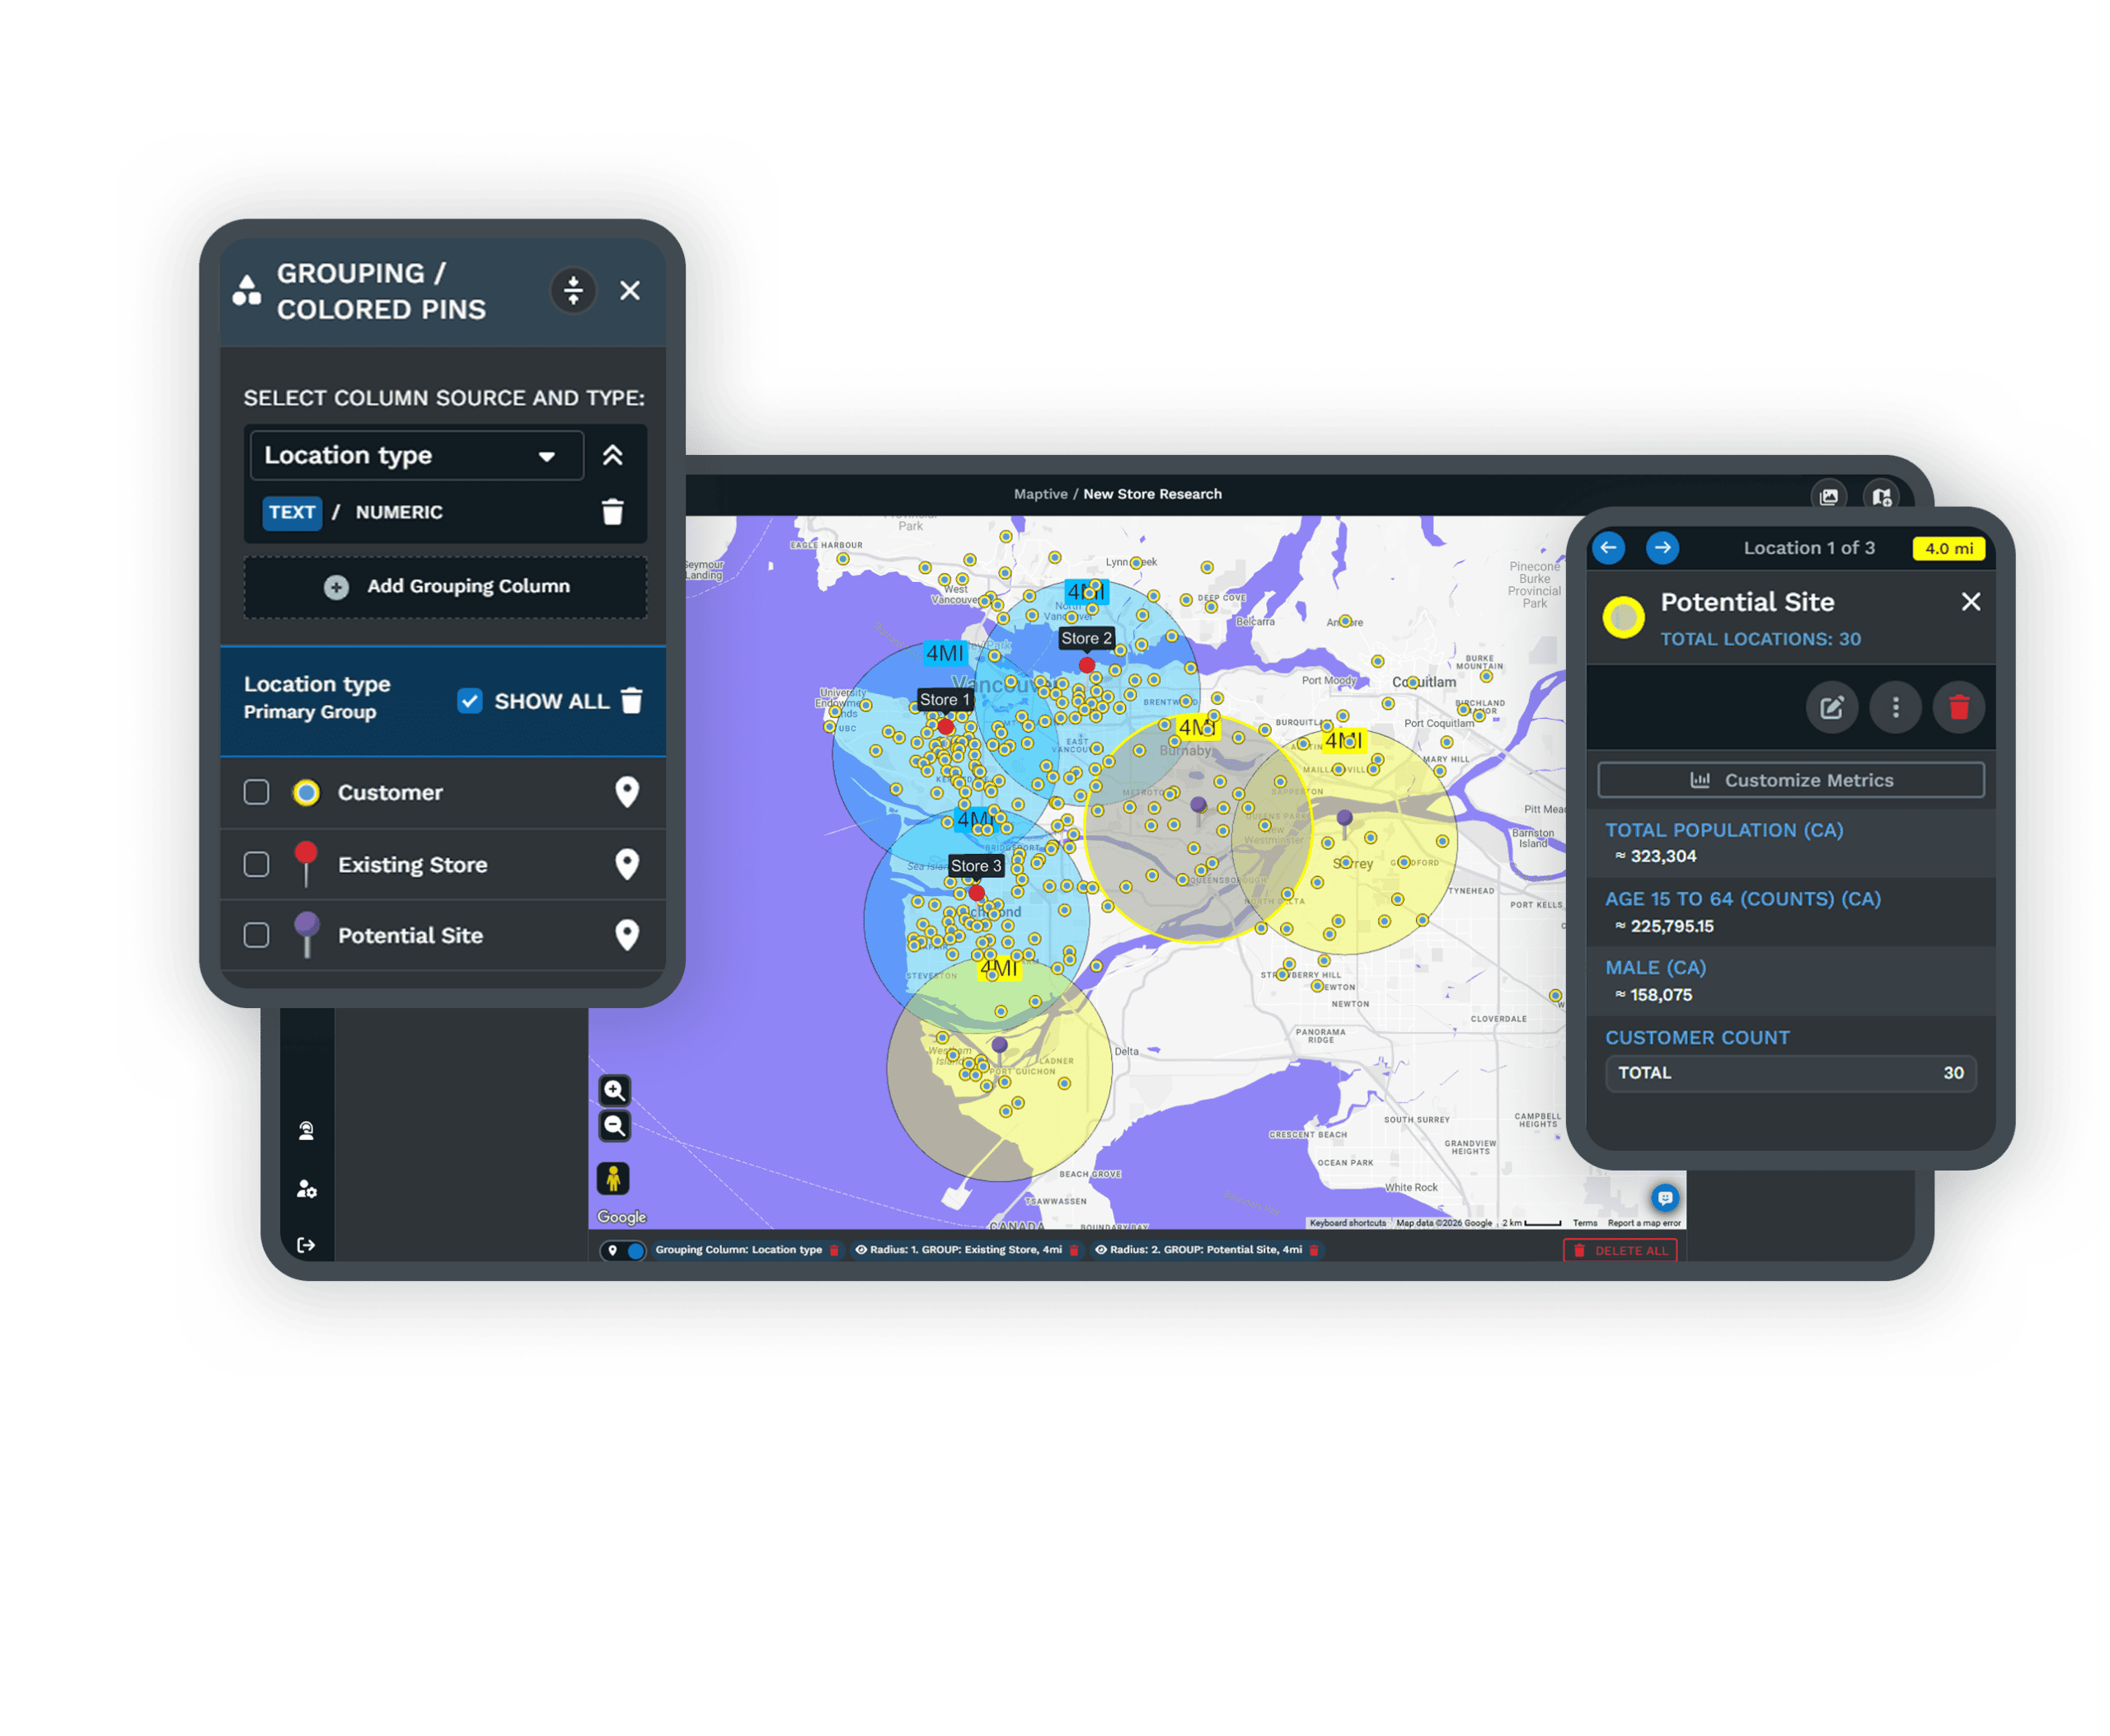
| 01 | Trade Areas on Real RoadsDrive-time polygons trace actual road networks, so a 10-minute trade area means a 10-minute drive for the shopper. Stack them around current and proposed stores to compare reach. |
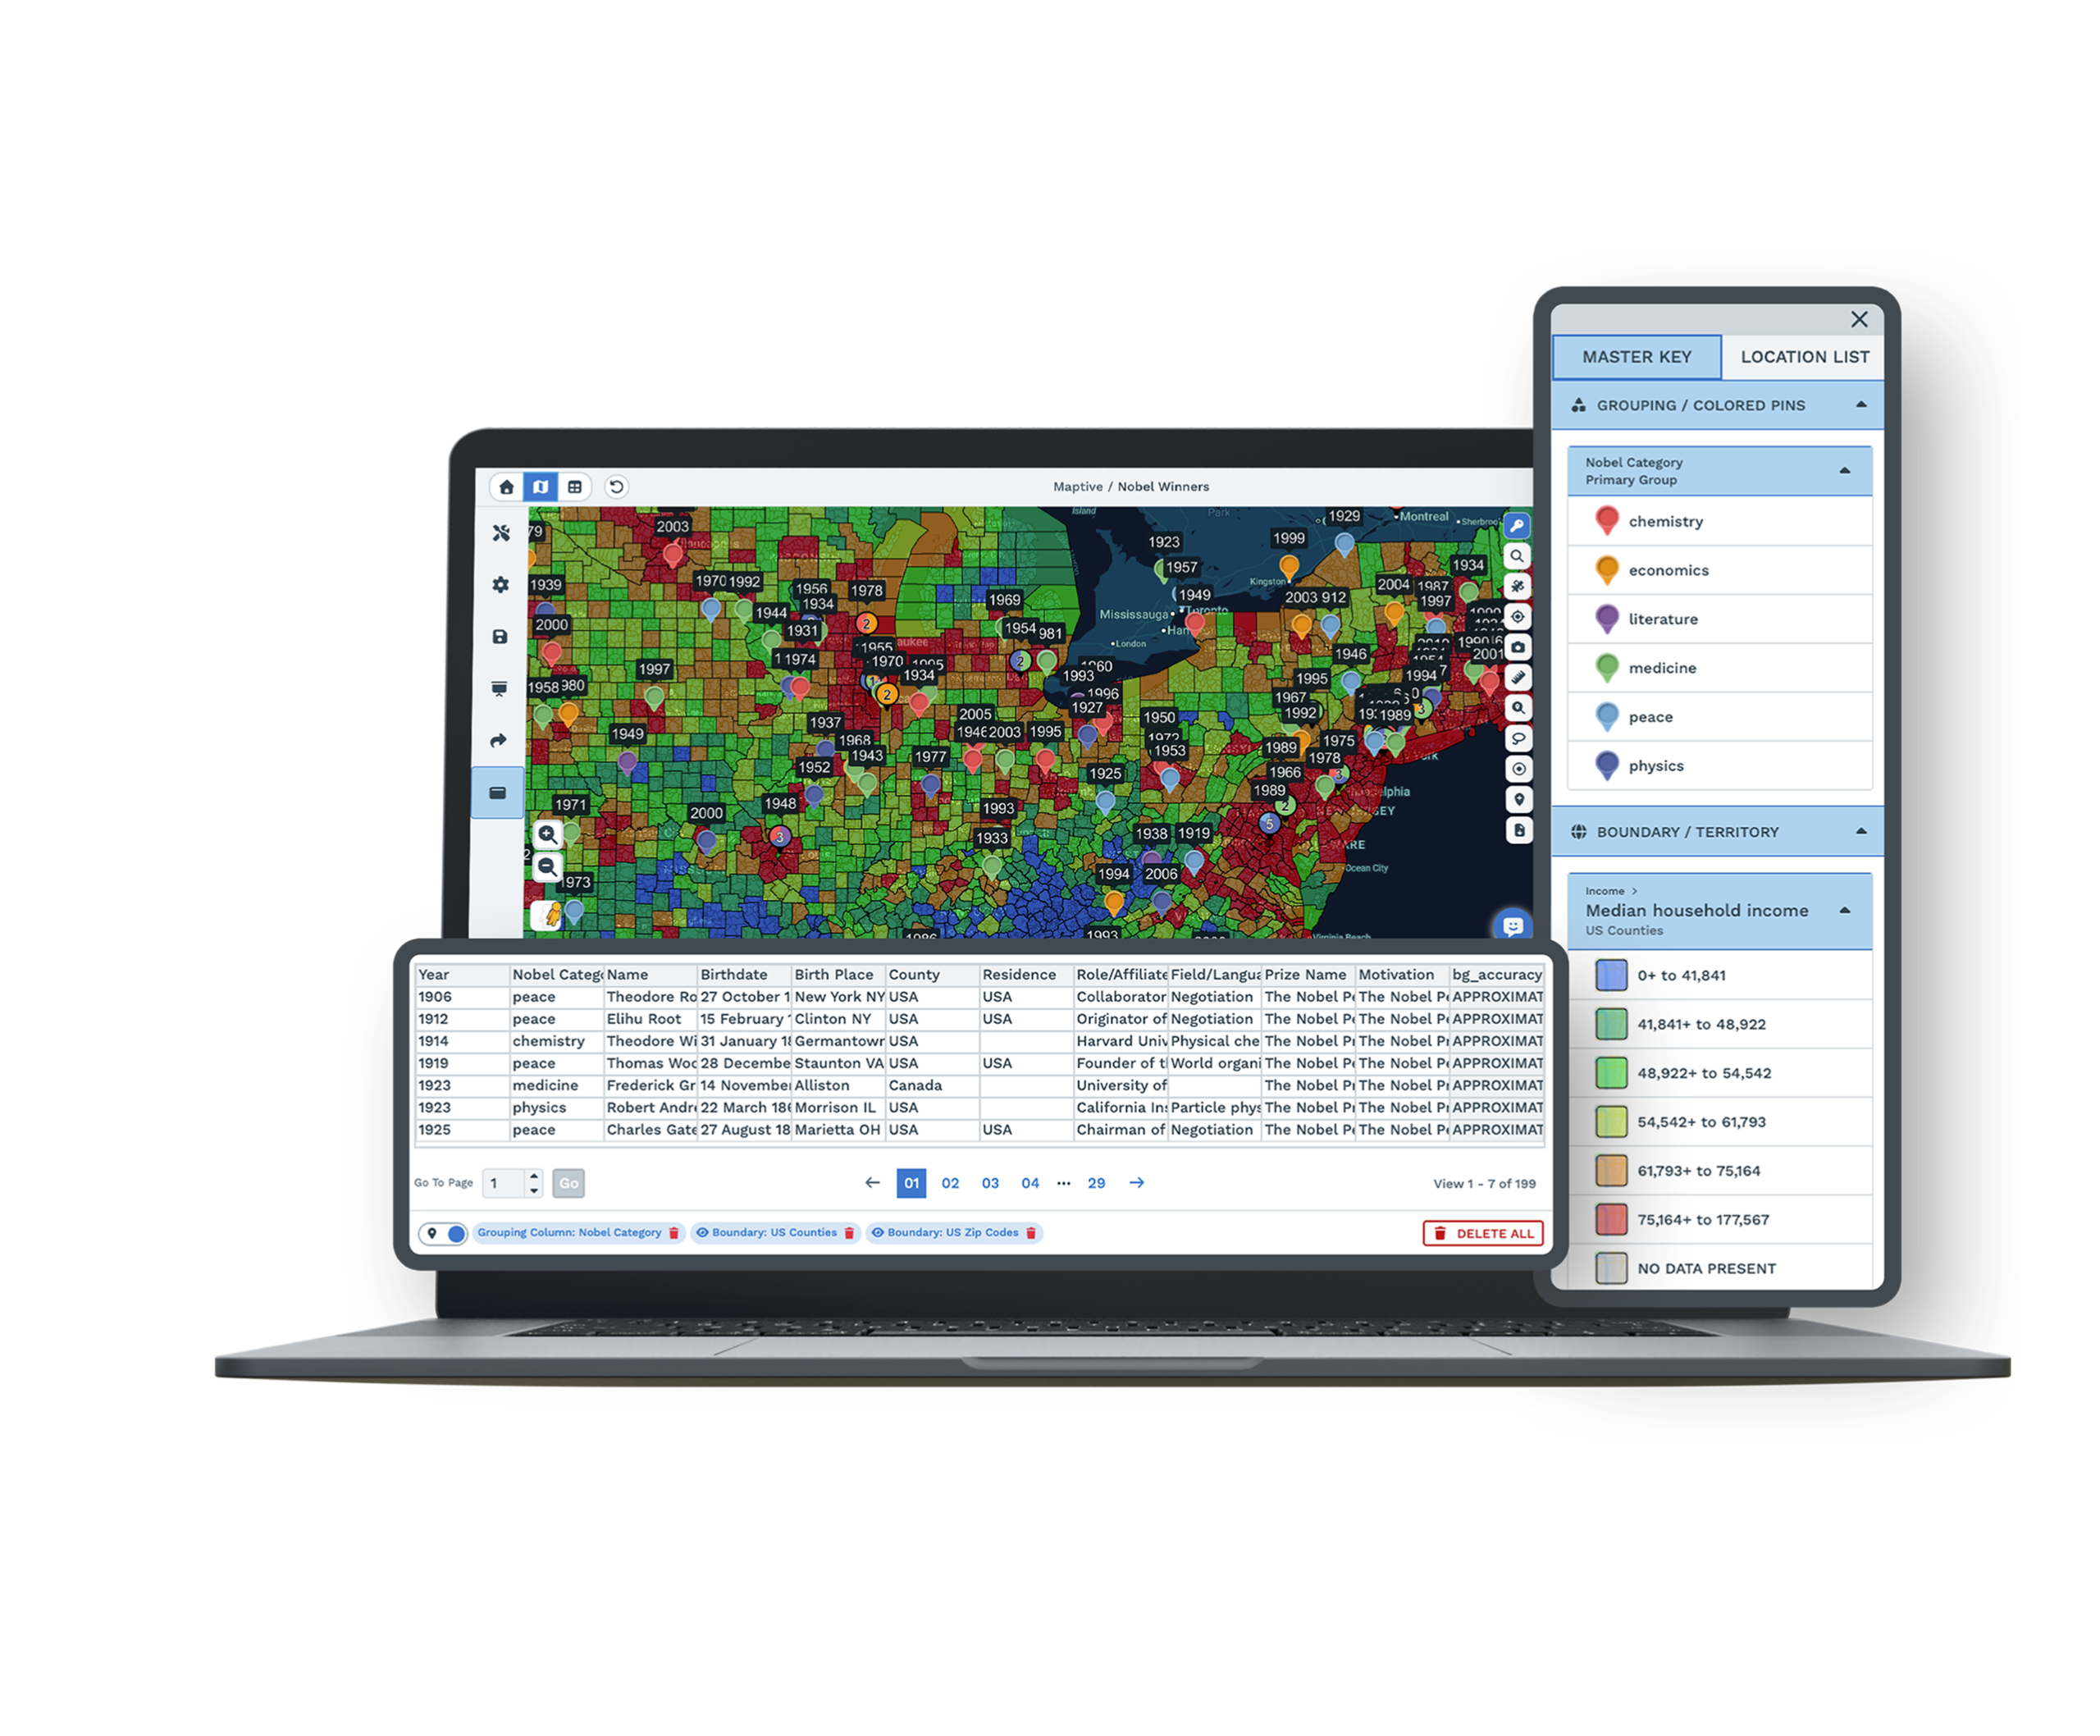
| 02 | Demand-Based Site RankingLayer census demographics under each candidate, alongside a growing library of 850+ retail and site-selection categories. The site that looks best on a drive-by is rarely the one that holds the strongest market. |
| 03 | Cannibalization ChecksOverlap two stores' drive-time polygons to see where they would draw from the same shoppers. Demographic data on the shared zone shows if it holds enough demand for both. |
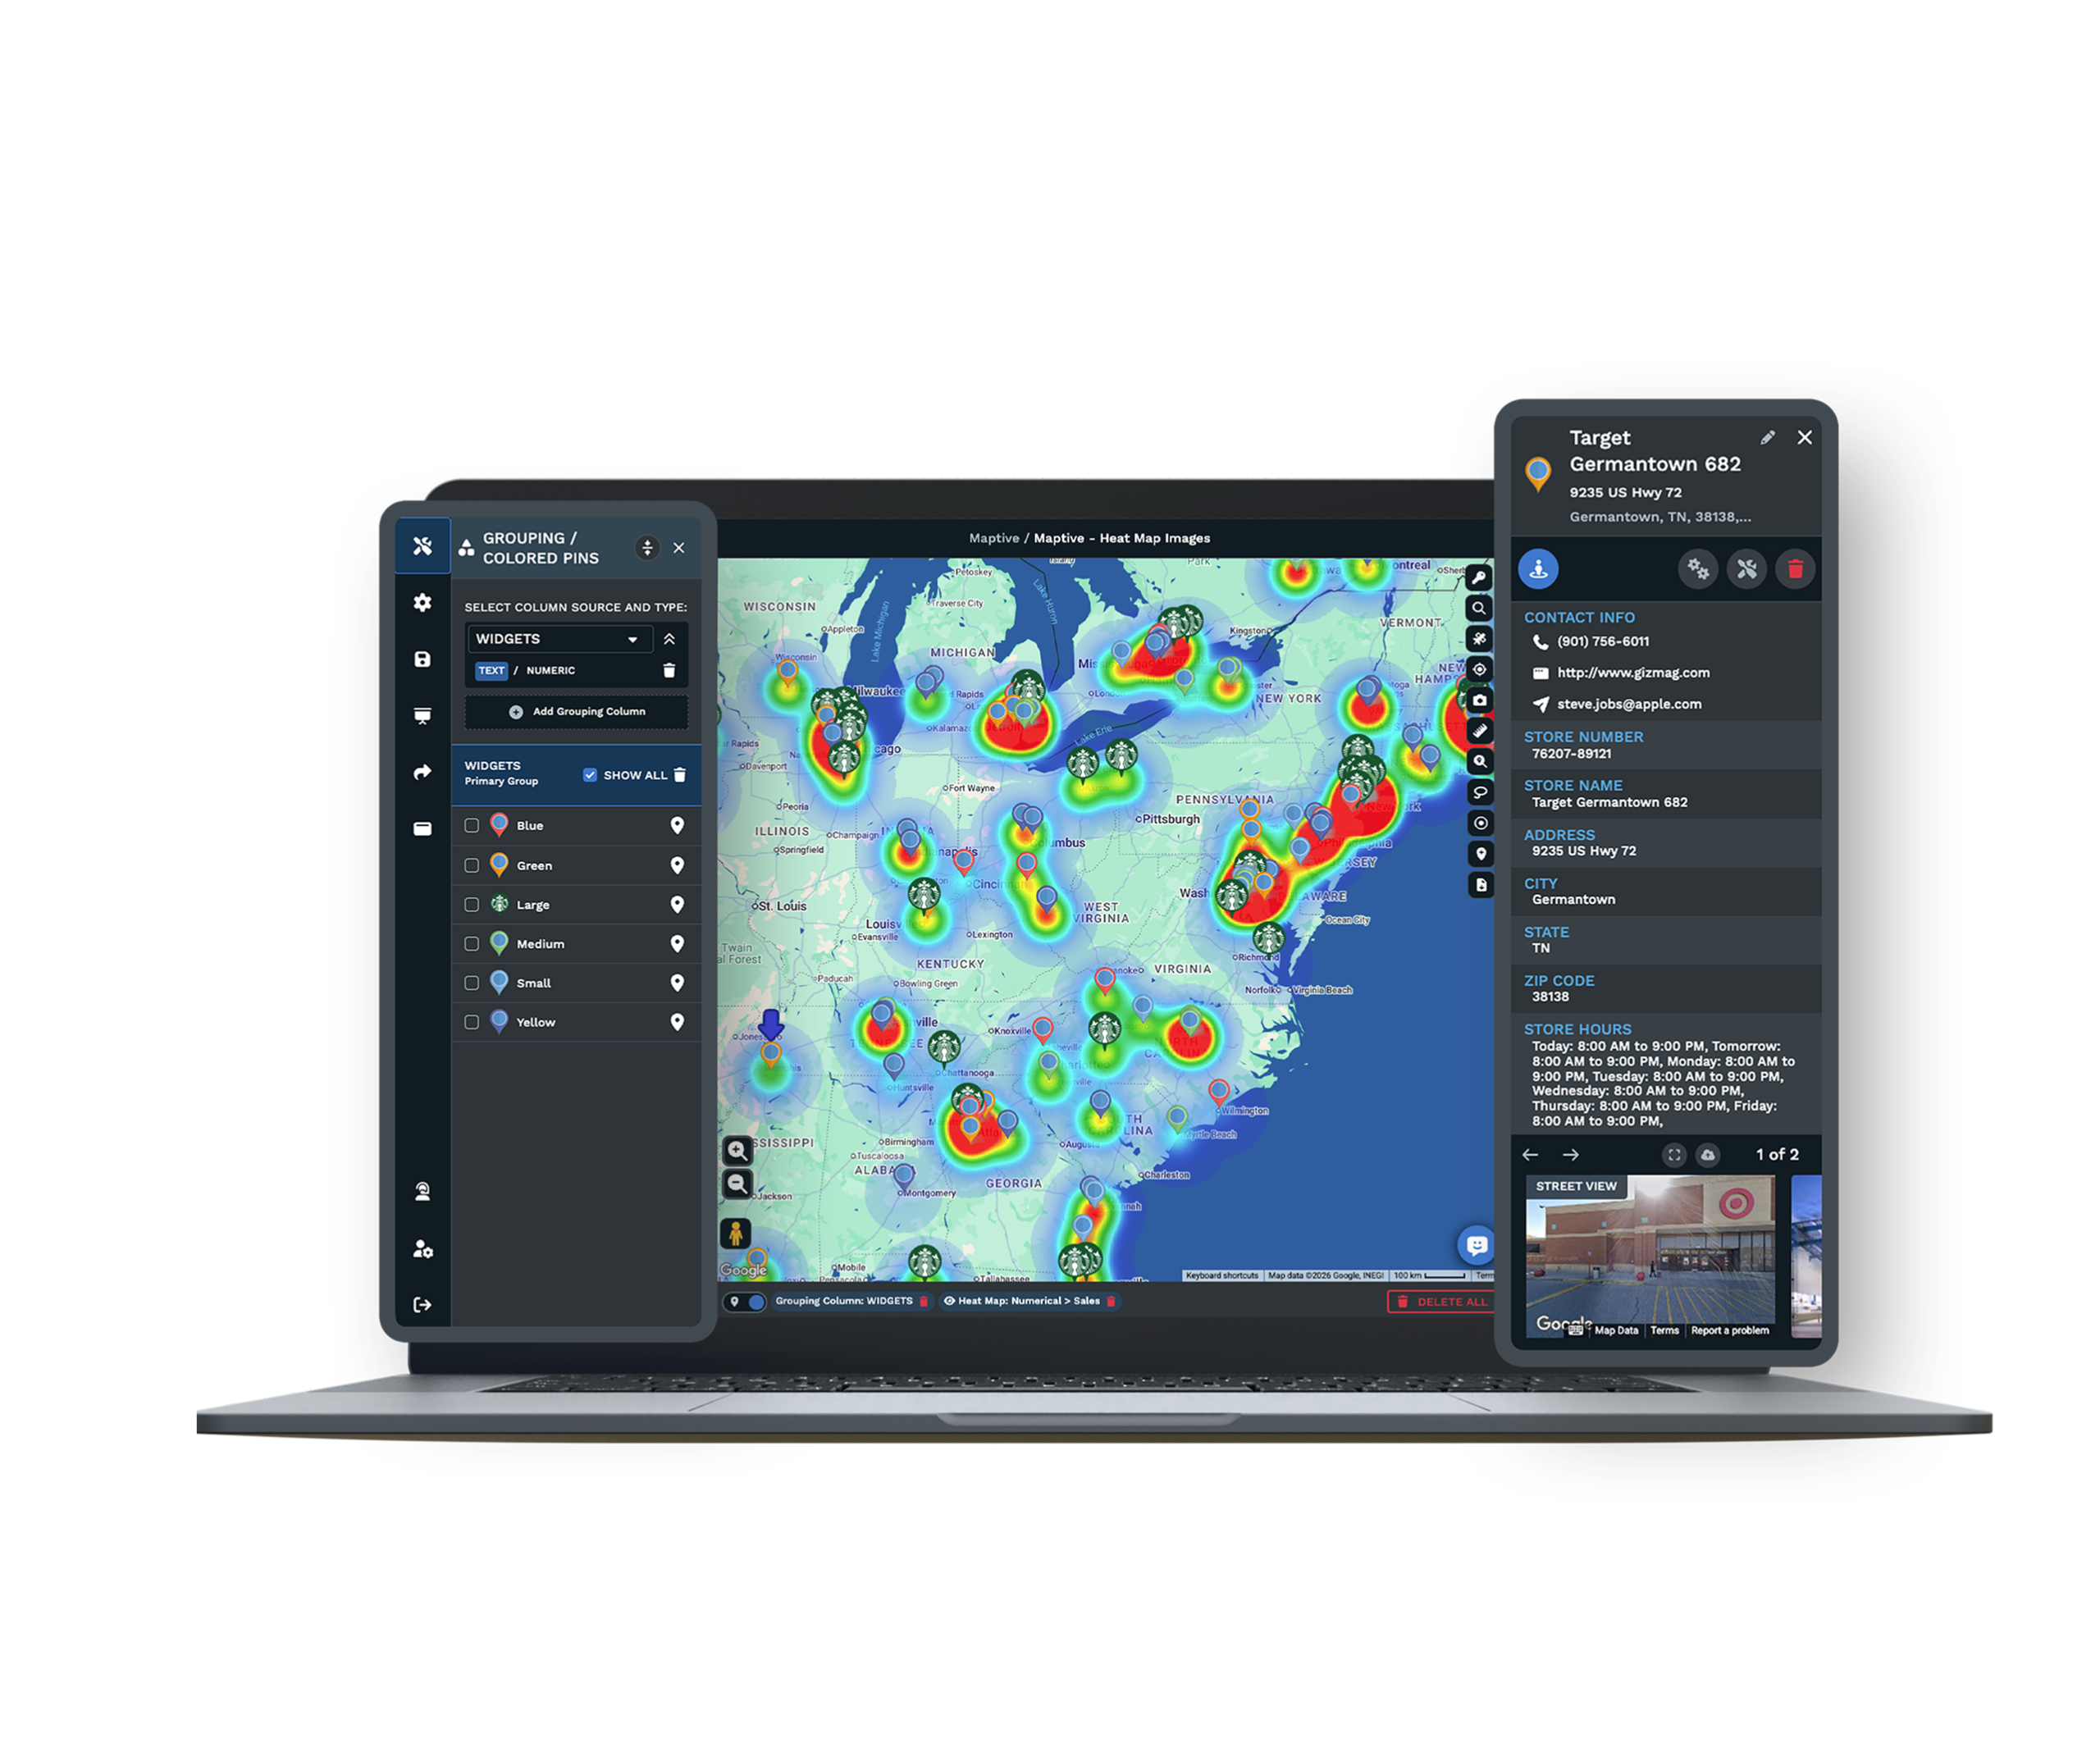
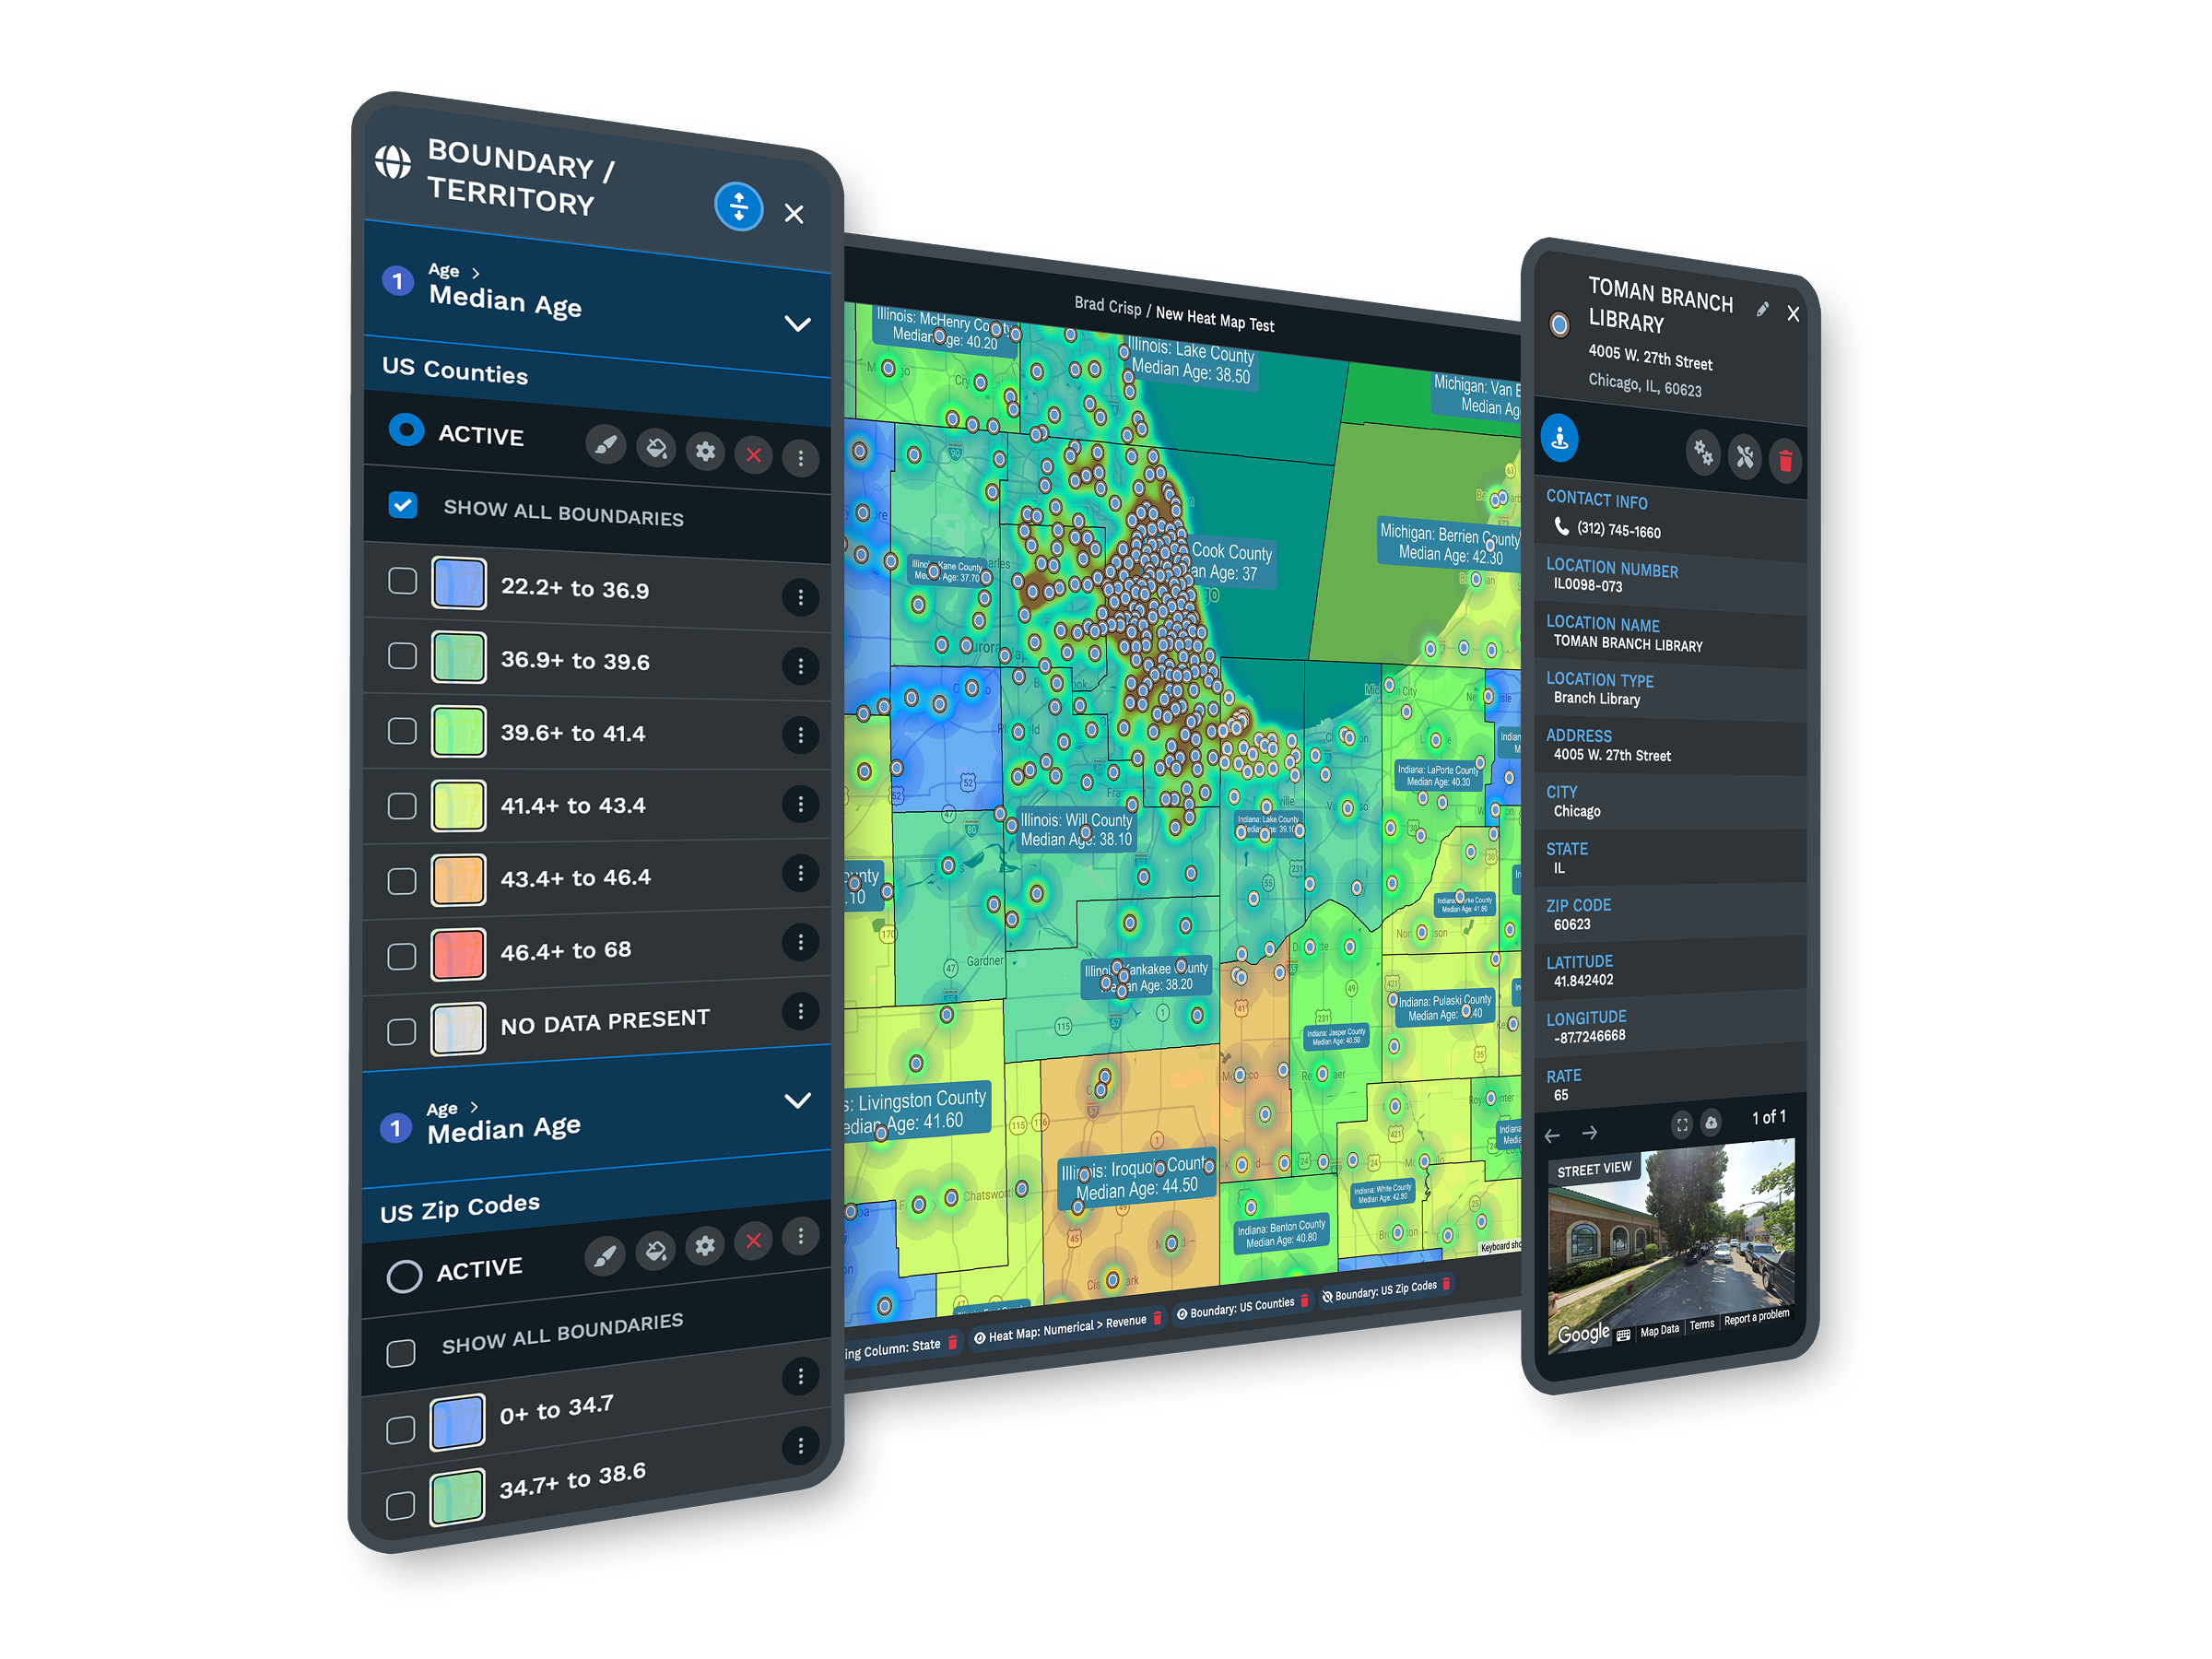
| 04 | Customer Heat MapsTurn loyalty, transaction, or any numeric field into a weighted heat map. The clusters point to where demand is dense and where coverage is thin. |
| 05 | Geographic Marketing TargetingOverlay customer pins on demographic and spending data to see which areas deserve regional spend. Marketing money follows demand rather than a flat radius around each store. |
Turning Data Into a Shortlist
From Customer File to Site Shortlist
Upload a customer export, a store list, or a transaction file, and the geocoding engine plots every row in minutes, correcting the messy addresses and missing ZIP codes that usually slow a project down. From there, demographic overlays bring income, age, and density to the block group around each candidate, drive-time polygons define the real trade area, and heat maps show where your customers concentrate. A shortlist that took weeks of separate reports comes together in a single session, ranked on the demand each site can reach.
Reading Store Performance Against Its Market
A store doing solid revenue in a thin market reads differently from one doing the same revenue where the market potential is far higher. That comparison only appears when a performance number sits beside the demand its territory can support. Maptive puts both on the same map, so an underperforming store in a strong market becomes a coaching or remodel decision, and a strong store near its ceiling is left alone. The result reorders an expansion plan around opportunity instead of around whichever site happened to be available.
Where National Retailers Already Map
Retail Brands on Maptive
Coca-Cola, Hilton, Frito-Lay, Bridgestone, and Chobani run location operations on the platform, each after its own security review. A regional chain and a national brand use the same tools, with capacity to scale as the store count grows.
Enterprise-Grade Security
Maptive includes 256-bit SSL encryption, two-factor authentication, single sign-on, role-based access, and audit logging, with 99.9% uptime and no major outage recorded in 2025. It runs on Google Maps Platform infrastructure, so a national chain stays responsive on one map.
Support That Sets Up Your First Map
Support runs from the US and Canada, answers in under 15 minutes at a 9.7 out of 10 rating, and will clean your file and configure your first map. The specialists know retail workflows, so the help is specific rather than generic.
Free trial, full platform, no credit card
Put a Real Site to the Test
Open a ten-day free trial, no credit card required. Upload your store list and customer file, draw a trade area around a candidate site, and layer the demographic and spending data underneath. Every retail planning tool is unlocked from the first login, so you can run a real site decision before the budget conversation starts.
Bring a Site to a Live Demo
For teams that evaluate tools through a formal process, a Maptive specialist will run trade-area and cannibalization analysis on your own store and customer data. This suits real estate committees and operators comparing platforms. Bring a candidate site and your customer file, and the session shows the analysis on your market rather than a sample one.
Frequently Asked Questions
What is retail site selection software?
Retail site selection software helps you choose store locations using data instead of instinct. Maptive plots your stores, competing locations, and candidate sites on one map, draws each trade area on real road networks, and layers census demographics plus a growing library of retail data categories underneath. You rank sites on the demand each one can reach, see where a new store might overlap an existing one, and export the analysis, all without a GIS analyst in the workflow.
What is a trade area in retail?
A trade area is the geographic zone a store draws its customers from. It is rarely a neat circle, because real customers travel along roads, so Maptive maps it as a drive-time polygon that follows the road network. Once the trade area is drawn, you can layer income, density, and spending data inside it to measure the demand a site can reach. That turns a vague sense of "good location" into a number you can compare across candidates.
How does Maptive help choose the best store location?
You plot every candidate on one map, draw a drive-time trade area around each, and layer demographic and spending data inside those boundaries. Maptive then lets you compare sites on the demand each reaches rather than on rent or curb appeal. Heat maps show where your existing customers concentrate, and overlap analysis flags sites that would compete with stores you already run. The result is a ranked, defensible shortlist you can take into a real-estate decision.
Can I see if a new store will cannibalize an existing one?
Yes. Draw drive-time polygons around the existing store and the proposed site. Where the two polygons overlap, the locations would draw from the same shoppers, which is the geographic signature of cannibalization. Layer demographic data on that shared zone to judge if it holds enough demand to support both stores or if the new site should move. Seeing the overlap before signing a lease is far cheaper than discovering it in next year's same-store sales.
What demographic data do I need to evaluate a site?
For most retail decisions you want household income, population density, age distribution, and household composition inside the trade area, and Maptive includes more than 50 US Census variables covering exactly those, down to the block-group level on every plan. A growing library of retail and spending categories adds consumer behavior detail alongside the census data. Together they let you match a site's trade area to the customer profile your concept serves, rather than guessing from a map alone.
What is a drive-time map and how does it help store planning?
A drive-time map, or isochrone, shows how far customers can travel to a location within a set number of minutes along real roads. Maptive draws these polygons around current and proposed stores, which is more accurate than a radius because it follows how people drive. For store planning, it defines a realistic trade area, reveals where two stores would overlap, and shows if a candidate site reaches enough households to support the format you have in mind.
How does Maptive help target store marketing?
Overlay your customer pins on demographic and spending data, and the map shows which areas around a store deserve regional spend and which are already well covered. Instead of spreading a budget evenly across a metro, you direct it toward the trade areas where demand and your customer profile line up. Retail teams using this approach report lower regional marketing spend, because the dollars follow the demand the map reveals rather than a flat radius around each store.
How many store locations can one map hold?
A single Maptive map holds up to 200,000 markers, rendered with WebGL so the view stays responsive. A full national chain, its competing locations, and a prospect list load together rather than splitting across regional files. That capacity matters for chain-level planning, because cannibalization and coverage gaps only become visible when every store and every candidate sit on one screen at the same time, not when they are scattered across separate spreadsheets.
Can I use my own loyalty or transaction data on the map?
Yes. You upload your customer, loyalty, or transaction file as a spreadsheet, and the geocoding engine plots each record, correcting messy addresses on the way in. From there you can build a heat map weighted by spend or visit count, or compare where your customers live against the demographics of a trade area. Using your own data alongside census and market layers is what turns generic site selection into a decision grounded in your actual customer base.
Do I need a GIS analyst to use Maptive?
No. Maptive is built for retail and real-estate teams, not GIS specialists. You upload a spreadsheet, the platform geocodes it, and the trade-area, demographic, and heat-map tools work through a plain interface. Most users produce a usable site analysis in their first session, and support is on hand to set up the first map. The point is to put site-selection analysis in the hands of the people making the call, without routing every question through a specialist.

