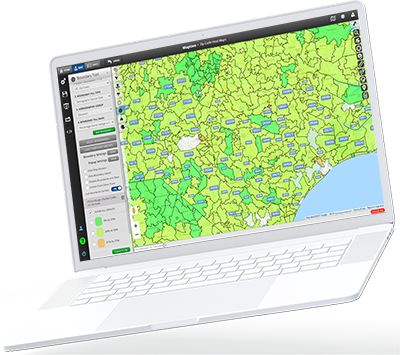
We are all familiar with the five-digit numbers that provide us all with a way to send & receive mail, but what most people might not realize is that zip codes are also used for demographic analysis, market research, and other data analysis purposes.
So if your business serves the entirety of the United States, every sales and marketing campaign you design may be targeting nearly 42,000 zip codes, which translates to an incredible amount of data to analyze and turn into a compelling and digestible story.
So how do you bring it all together and still deliver an outstanding data narrative?
The answer is simple: you create a zip code boundary map using your data. A zip code map outlines the boundaries of each zip code in your data set, so that you can gain a clear vision of where your stores are located, where your customers live, where competitors are, etc–ultimately helping you reveal insights that would otherwise stay buried deep inside your spreadsheets.
If it’s the first time you create a zip code heat map, you already know that while Google Maps does have some functionalities to get you started, you need a professional mapping software tool to plot zip codes, create maps or heat maps, or run comparison analysis.
With Maptive, you can do all that and more, bringing your data to life and creating beautiful, custom zip code maps within minutes– and without any programming or coding needed.
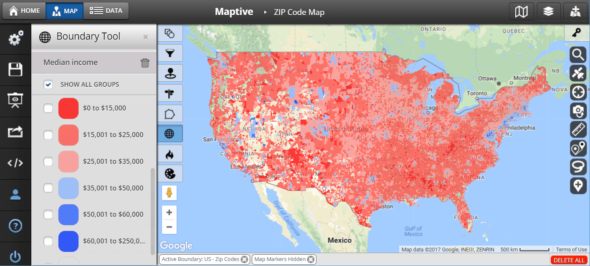
Common metrics like population density and median household income from the US Census Bureau are automatically available in Maptive, ready to complement your proprietary data and help you develop more meaningful insights into your consumers or competitors.
Plus, the geographic data available through Maptive is provided by Google Maps, so you know it is the most complete and up-to-date data available.
Types of Zip Code Maps You Can Create with Maptive:
Benefits of Creating Zip Code Maps
Zip code maps can help you visualize relevant map data and gain insights into your complex data sets.
By mapping data across geographic locations, you can reveal patterns and trends that may otherwise stay hidden in your Google Sheets. But the benefits don’t stop there:
Visualize data in a more meaningful way.
By assigning data to specific geographic locations, you can easily see where the data is clustered and where it is spread out. This can be especially helpful if you’re looking at large data sets and allows you to create your own custom map for each.
Identify patterns and trends.
Mapping data to zip codes can help you uncover patterns and trends that you may otherwise miss when viewing the data in other formats, like a spreadsheet where all you can see is a sequence of “address city state zipcode” over and over. For instance, you might be able to see new competitors opening or closing up stores in certain areas, creating new opportunities for the recalibration or expansion of your marketing efforts.
Make informed decisions based on data insights.
Creating a zip code map can help you make better, more informed decisions that are grounded in data. For example, if you run a retail business selling hiking gear, you might use zip code maps to identify areas with high concentrations of your target demographic and segment by age, income, and any other characteristics. Based on this information, you can then decide where to open new stores or focus marketing efforts.
Communicate data insights more effectively.
Zip code maps can be powerful tools to show others the data insights you uncovered. By presenting data in a visual format that’s easy to digest, users can help others understand the data more intuitively and make more informed decisions.
How Businesses Use Zip Code Maps
Successful businesses and public agencies use zip and custom area code maps to gain a competitive edge against their competitors, enhance their marketing and sales strategies, and streamline their logistics and operations.
Territory Management
Territory management is one of the most popular applications of zip code mapping because, after all, understanding and managing sales territories can make or break your sales efforts.
By dividing sales territories into zip codes, businesses can assign salespeople to specific areas and optimize their efforts. This can lead to more efficient sales operations that translate into a boost in revenue.
Government agencies, businesses, and organizations can uncover crucial insights about their operations and make informed decisions based on data insights just by using zip code maps and location data.
Market Analysis
Zip code heat maps can be used for market analysis by overlaying demographic data onto the map generated by your own proprietary information.
Essentially, after you’ve created your own custom territory map, you can then pull information from the US Census and see how your offerings or service coverage compare with the real market.
This allows organizations to identify areas with high concentrations of potential customers and target their outreach sales efforts accordingly.
Site Selection
If you’re thinking of expanding your business and or are scouting for your company’s first-ever location, zip code mapping can be extremely helpful.
By analyzing demographic and economic data within specific zip codes, businesses can make informed decisions about where to locate their stores, offices, warehouses, logistics centers, and operation hubs.
This can help you avoid opening up shop in areas that are already saturated by competitors, minimizing risk and increasing your chances of success.
Marketing Strategy
Zip code maps can be used for developing effective marketing strategies. By analyzing data such as income levels, consumer behavior, and other demographic information within specific zip codes, businesses can create targeted campaigns to reach their ideal customers.
They can also use zip code maps to identify areas with high potential for growth and expansion.
Urban Planning
Urban planners can use zip code maps to analyze and visualize information related to their city or town. For example, they can use maps with zip code boundaries to identify areas with high traffic congestion, poor air quality, or inadequate access to public transportation.
They can then use that information to decide where to invest in infrastructure improvements, zoning regulations, and other policies to improve the quality of life for residents.
Real Estate
Real estate professionals can use zip code mapping to gain insights into the local housing market.
By analyzing trends in home values, sales volume, and other factors within specific zip codes, real estate agents can provide valuable information to their clients.
Plus, they can also use popular mapping services to identify areas with high demand or potential for development.
Service Area Planning
Utility companies and delivery services often use zip code mapping to plan their service areas.
By overlaying service routes onto your own map, companies can identify gaps in their coverage and optimize their operations, which includes finding the most efficient routes for their field crews and delivery teams.
This can lead to cost savings and improved customer satisfaction.
How to Create a Zip Code Map with Maptive
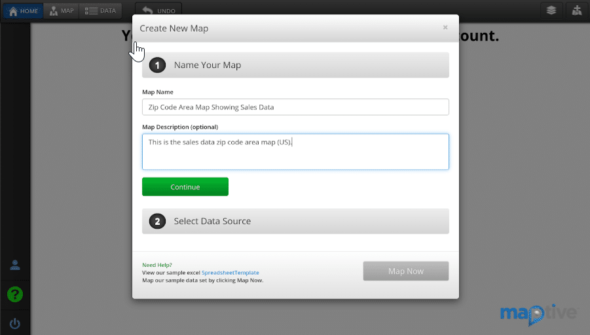
Let’s create a zip code heat map showing sales density. While this default map view is a common use case, you can use your own Excel data to map zip codes in any way that suits your needs.
Step #1: Sign up for a free Maptive trial account.
Step #2: Login and click on “Create My First Map“.
Step #3: Name your map, and add a description. Click “Continue“.
Step #4: Now, paste your data into the input area or upload your Excel spreadsheet data or import a Google sheet. For this tutorial, we’re uploading an Excel spreadsheet with our sales data.
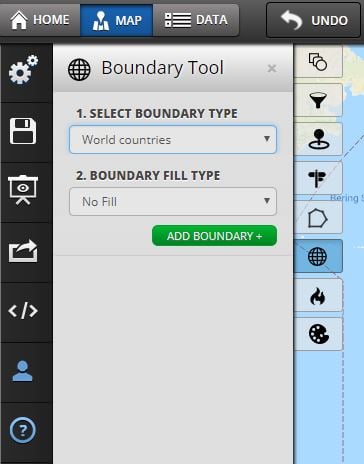
Step #5: There are five sub-steps here. Depending on the Excel data that you want to show inside your zip code boundaries, your choices might differ.
- Select the Boundary tool (so that you can draw the zip code boundaries on your map).
- Choose US Zip Codes from the SELECT BOUNDARY TYPE field dropdown menu.
- Choose My Numerical Data from the BOUNDARY FILL TYPE field dropdown menu.
- Choose Sales from BOUNDARY FILL DATA field dropdown menu.
- Click Add Boundary.
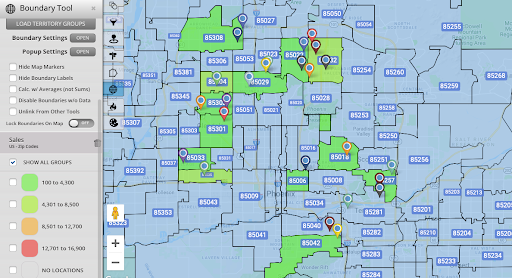
As soon as you’re done, the page will show a map with an overlay of zip codes, and sales density will be represented by a range of colors.
If zip codes are less useful to your business, you can also create a boundary map by city, county, state, or country. Alternatively, you can create custom territories using Maptive’s territory drawing tool or automatic territory creation tool (coming soon).
The map automatically includes customizable info popups for your boundaries. You can see the popup showing statistics such as the zip code’s population, its median individual and family income, and the number of locations that fall within it.
Once you have created a map, share it with your sales teams or export it and add its unique map link to your presentation. No one has to be a data expert to understand what the data is telling (or showing) when using a Maptive map!
Common Mistakes to Avoid
When zip code mapping, there are a few frequent errors that you can easily side-step as they can compromise the accuracy or usefulness of your map.
Using incorrect or incomplete data
One of the most common errors when creating a zip code map is using incorrect or incomplete data. This can lead to an inaccurate territory definition that does not reflect the true nature of your data and might lead you to arrive at the wrong conclusions.
Choosing the wrong map projection
Different types of interactive map apps and projections can distort the shape and size of geographic features, making it difficult to accurately represent your data.
That’s why it’s important to always use mapping software like Maptive that offers accurate map styles and projections that are appropriate for your data and the geographic area you need.
Failing to normalize data
Another common error when zip code mapping is failing to normalize your data. If you are unfamiliar with the term, “normalization” is the process of adjusting data to account for differences in population size or other factors that can affect the way your information is represented on the map.
If you skip this step and fail to normalize your data, you run the risk of creating inaccurate or misleading maps that do not accurately reflect the true nature of your data.
Ignoring data outliers
Ignoring data outliers can also be a common error when creating a map with only zip codes used. Outliers are data points that are significantly different from the rest of the data set and can skew the results.
By avoiding these common mistakes, you can make sure that your zip code maps are accurate, useful, and reflective of the true nature of your data.
Conclusion
When you woke up this morning, “create map” might not have been a task on your to-do list, but now that you know how useful zip code boundary maps can be for business, you will definitely want to add it!
Maptive’s boundary tool allows you to create zip code boundaries populated with our complimentary data sets, such as demographic data from the US. With that information, you can fill in the gaps in your own data set to develop more successful strategies for sales, marketing, logistics, real estate, urban planning and so much more.
For example, if you use the zip code labels and codes to map the sales territories of your sales teams, they’ll know the region they’re accountable for, and you can measure performance, study trends, and strategize through maps.
In addition to supporting zip code boundaries, Maptive lets you draw a host of other geographical boundaries on your maps at the block, county, city, state, and even country level.