Mapping Software for Academia: University Administrators and Researchers
Bring Data to Life
Countless fields in academia rely on data to complete work. Administrators, graduate researchers, and professors across disciplines constantly encounter the common challenges related to organizing and presenting data.
There is a reliable and affordable solution for those who work with location-based data: Maptive’s mapping software. No matter your program area, whether you focus on the social sciences, natural sciences, public health, or mechanical engineering, Maptive will bring your data to life.
Maptive makes it easy to turn rows in a spreadsheet into academic maps for presentations and research. Or, use Maptive’s software to analyze your data and delve into new insights about students in your program, alumni, donors, or research subjects.
Because the applications of Maptive’s software are so broad, it can be of great use to faculty, staff, and students alike. Each map is fully customizable and shareable, either publicly or privately with password access to anyone in your academic program.
What Are Administrators and Researchers Looking to Achieve?
Administrator Goals
- Improve efficiency throughout the academic year.
- Track student/alumni achievements and demographics.
- Organize fundraising efforts.
- Plan events and conferences.
Cities
- Clearly visualize and analyze data.
- Present research in a compelling format.
- Plan excursions for field research or data collection.
This is the heading
Here are a few ways Maptive can help faculty and administrators achieve their goals:
Pin Maps
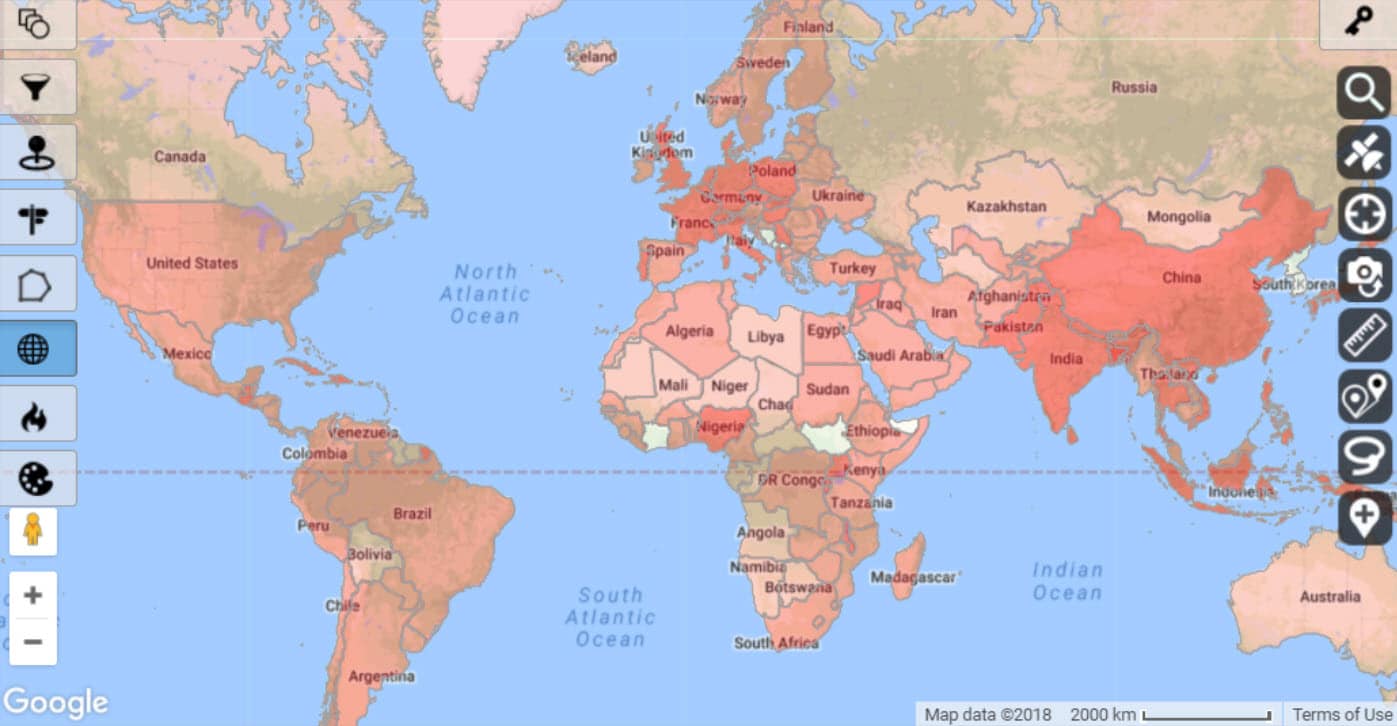
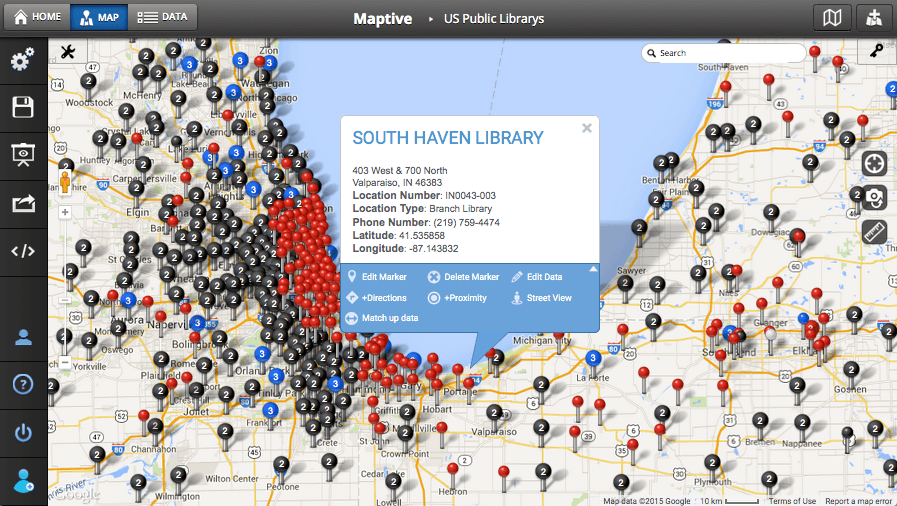
Pin maps are endlessly useful. Administrators can use them to visualize where current students, donors, and alumni are located. Combine them with the demographic census data built into Maptive’s boundary tool for a more powerful analysis of student, alumni, or donor demographics (including gender, age, and income statistics by zip code). Pin maps can even be used to plan conferences: map event locations, display the full schedule, and share your map with participants.
Faculty and researchers can use pin maps to plot any kind of data point that is relevant to their research (so long as it’s location-based). Maptive can help you interpret data gathered from studies, surveys, fieldwork, research, and more.
Filter Tool
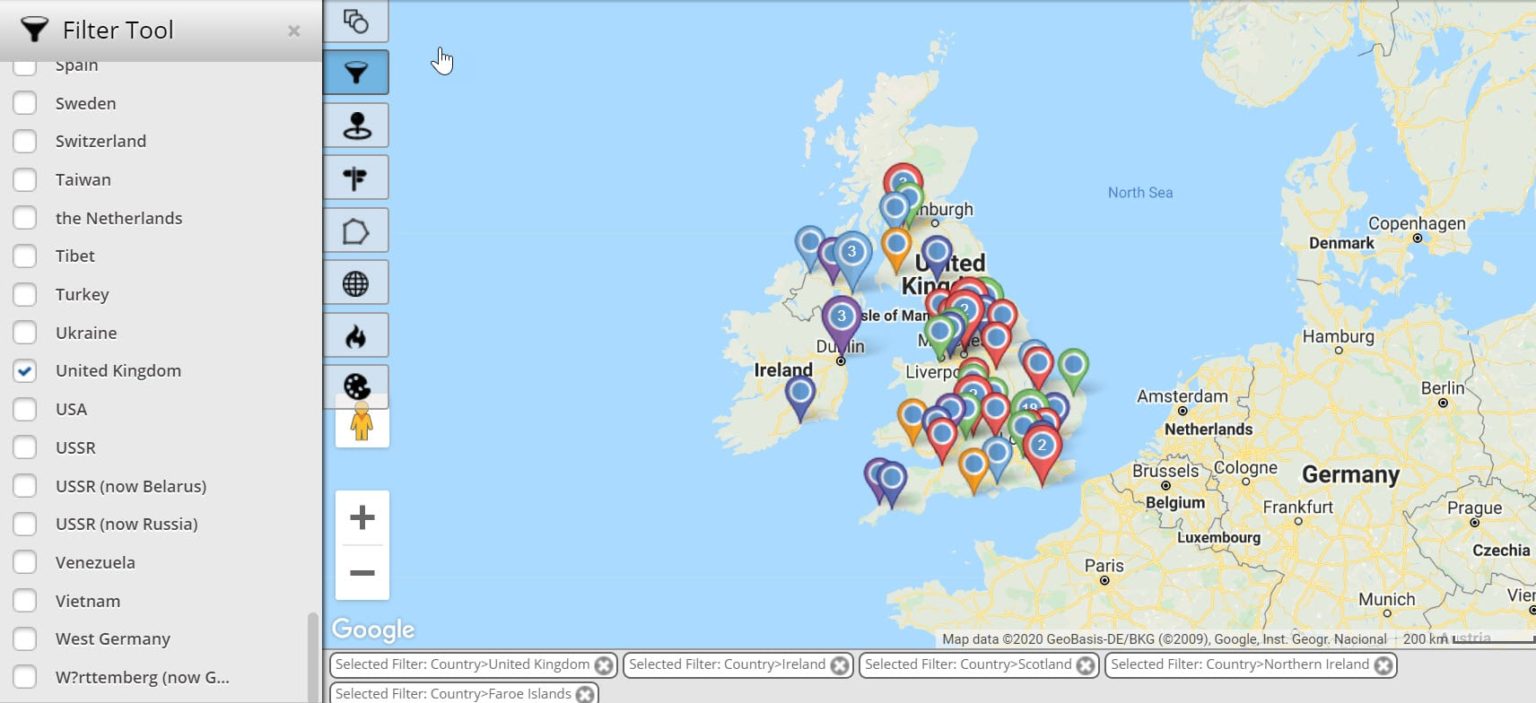
If you’re like most researchers, you gather more data than you need. There’s nothing wrong with being thorough, but data without filters can become incredibly overwhelming. As a general guideline, you need to make sure your maps are not busy with extraneous information.
Use filters to pare down your current information and show only what you need. For administrators, assign custom attributes to students, alumni, or donors and filter based on those categories, like major, field, employment status, etc. Or, use any column in your data to filter or group your data points, and focus on the main content in your data.
For researchers and faculty, this tool is crucial. Turn filters on and off or customize them on the fly to analyze your data in a variety of ways. No matter your program of study, clean up your maps for presentations, and show only the most relevant data points, based on custom attributes or any column in your data.
Route Optimization
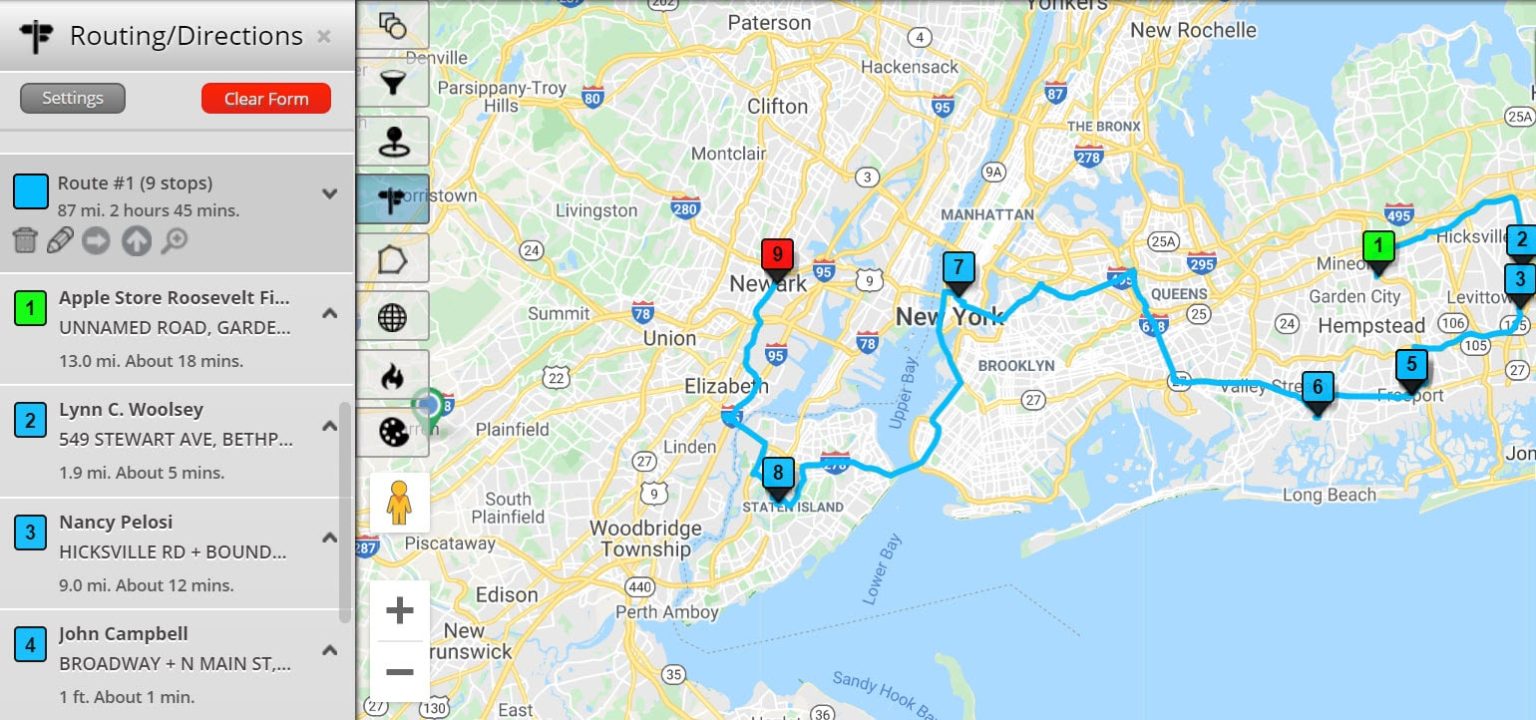
Do you need to drive to multiple sites for fieldwork? Or do you need to travel to conduct survey research? Even class excursions can be planned with Maptive’s route optimizer. Simply click on any data point on your map and add it to the route optimization and directions tool. You will get turn-by-turn directions as well as the option to optimize for the most optimal route between 20+ locations. Add over 70 stops to your route if needed.
Presentation Mode
Get ready to present your research in style. Whether you’re teaching a class, presenting research for your degree program, or applying for funding, Maptive can help. Our maps are fully customizable, so change the markers on your map, base map styles, and essentially every color to better match your presentation. Either present straight from Maptive’s software with our full-screen presentation mode or export an image of your map to add to a digital or physical presentation.
Why is Maptive the Best Mapping Software for Academia?
The answer is, for all the reasons above and more:
- Communicate your research effectively with customized maps.
- Filter data to display the information that is most important.
- Plan conferences and excursions more efficiently.
- Enhance your research capabilities and find new insights.


