Want to gain meaningful insights in the blink of an eye? Color-coded maps assign different colors to different values, giving you an equally powerful and beautiful visualization tool. From sales teams to political campaigns to public health, leaders use color-coded maps to communicate massive amounts of data in a simple and easy-to-understand format.
Turn your Excel or spreadsheet data into a color-coded map with Maptive. In only a handful of clicks, Maptive visualizes your location data into a map rich with opportunities and illuminating from the very first glance.
What is a Color-Coded Map?
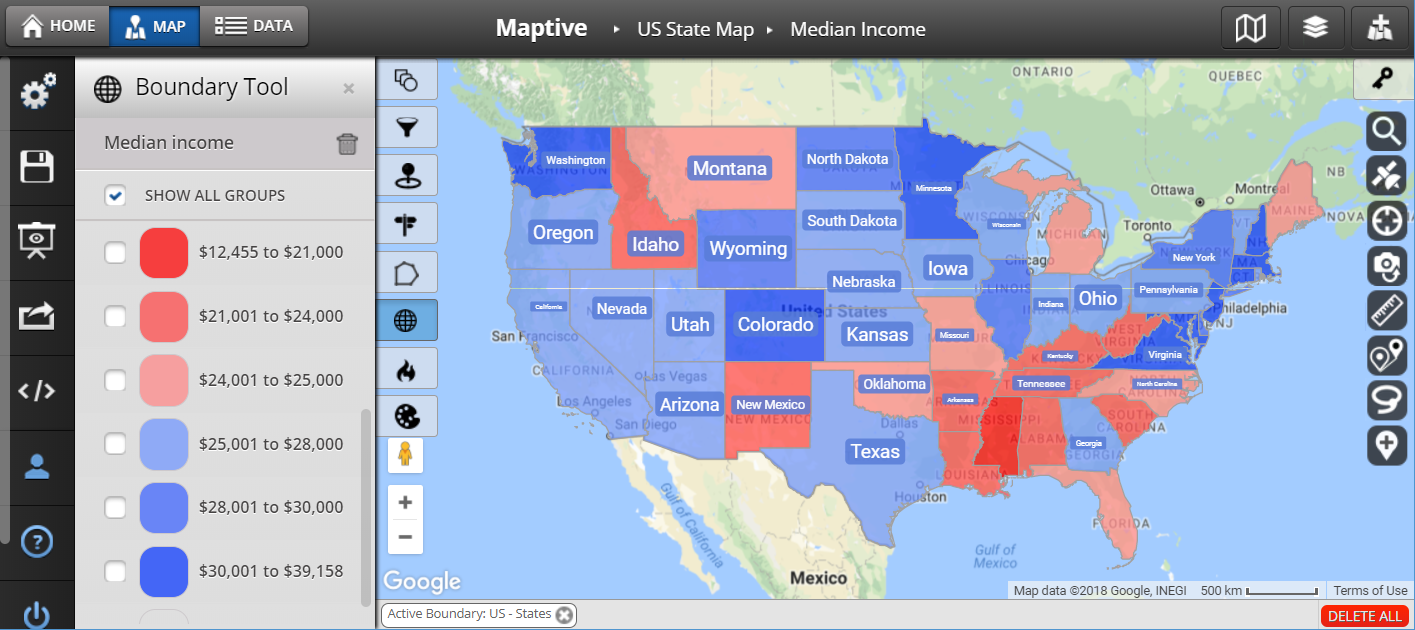
Color-coded maps visualize variations in your data by assigning colors to ranges of values in your column data, then displaying them on a map. You can color-code your maps in several ways, from coloring individual pins to predefined territories (state, city, zip code, census tracts, etc.)—even custom geographical boundaries!
Color-coded maps can be simple or complex. For example, you can color US States red or blue based on election results for a traditional map. Or, you can assign different shades of those same colors to express margin-of-victory at different zoom levels. Maptive even offers a full swatch of custom colors for any idea you can imagine!
What is the Purpose of Color Coding in Maps?
Color-coded maps are thematic maps used by organizations to identify trends, extract insights, simplify large volumes of data, and more. Color coded-maps are best-suited for distinct variations.
Color-Coded Maps vs. Heat Maps
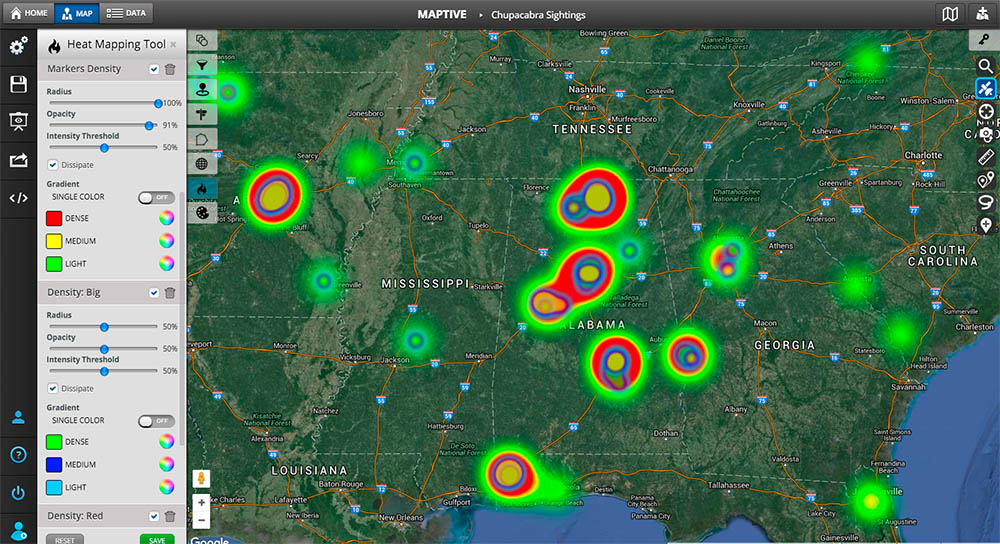
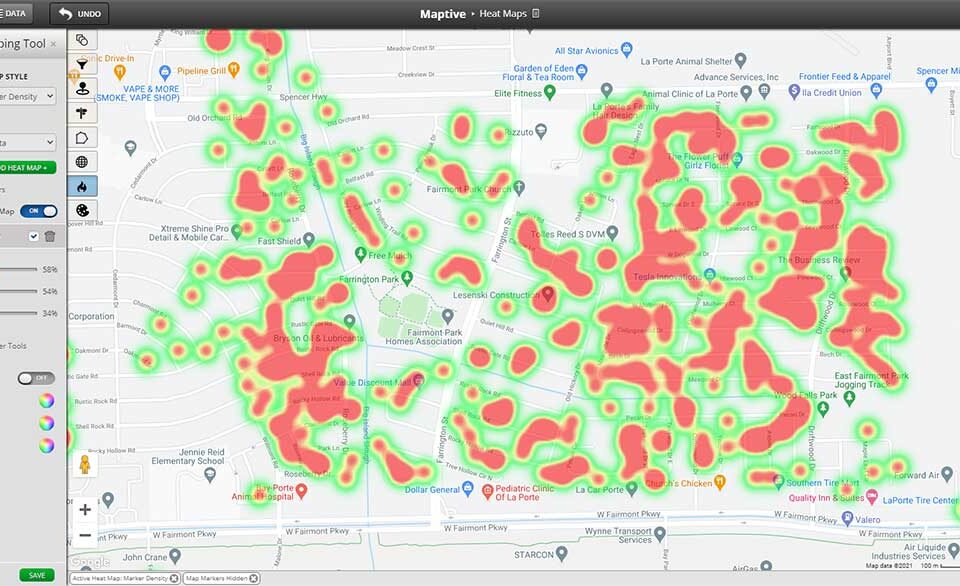
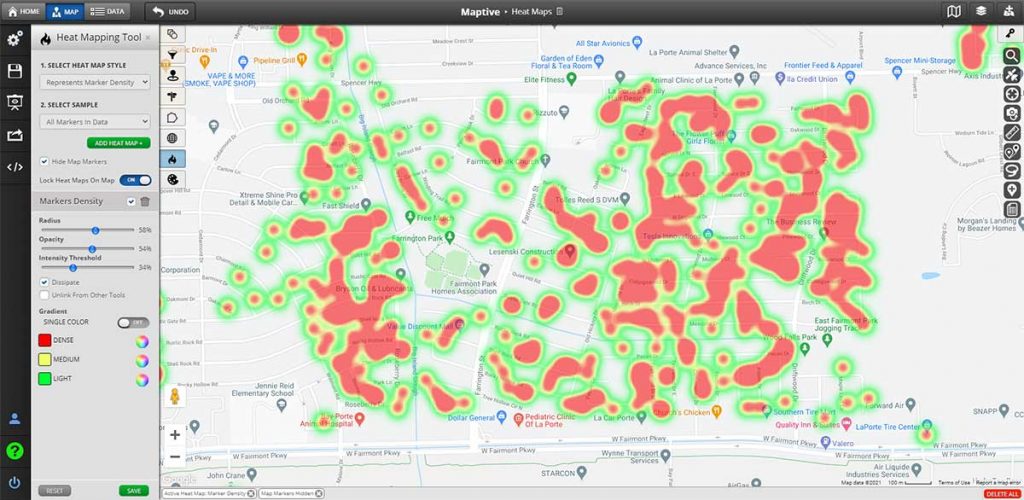
While both types of maps use color to express the range of values in your data, they serve two different purposes.
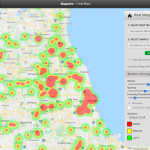
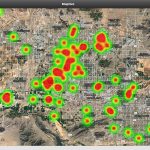
Heat maps measure density over specific geographical areas: the darker the color, the higher the density. Like isopleth maps, heat maps are great for comparing and contrasting the distribution of density within an area. However, heat maps are not defined by set boundaries and are inherently less absolute than color-coded maps, making them a better fit for more qualitative analysis.
Color-coded maps are better for more simple and distinct analysis. In fact, color-coded maps don’t even require analysis! If you assign different colors to all 50 US States, provinces in Canada, or countries in a continent, you have a color-coded map on your hands.
Luckily with Maptive, you don’t have to decide! Maptive’s enterprise-level GIS mapping software gives you access to all the rich and relevant features you’ll ever need, without the complication that comes with cluttered alternatives. Select your preferred mapping tool, and Maptive will handle the analysis for you. No coding is required.
Explore the endless benefits of a fully-customizable, interactive color-coded map. Start your free 10-day trial of Maptive today.
What Are the Benefits of Color-Coded Maps?
The benefits are as vast as the possibilities. Color-coded maps are capable of solving any problem or hypothesis that calls for the relationship of a data’s value and geography. Here are some examples:
- Sales and Marketing Teams: Define territories, track regional sales volumes, and target new markets. Map layers market characteristics like population density, demographics, and spending habits over your business data.
- Political Organizers, Strategists, and Analysts: Track voter turnout, party lines, and election results. Forecast outcomes, present findings, and plan strategies. Color-coded maps are often used by media outlets for election coverage.
- Government, Policy, and Public Health Agencies: Analyze demographics, conduct studies, and measure a variable’s effect by region. For example, color-coded maps have been a powerful resource for cataloging active cases from zip code to total population.
- Academics, Teachers, and Students: Discover meaningful insights, patterns, and relationships hidden deep in your spreadsheet data, regardless of your area of Color-coded maps are particularly useful for study areas like sociology, geography, ecology, economics, and business administration—with a simplicity fit for K-12 students as well.
Can I Color Code a Google Map?
Google Maps does not allow you to color-code a map. However, as far as GIS Software goes, Google Maps offers an incredible foundation: supreme reliability (99.99% up-time), enterprise-level security, global coverage, cloud-based access, and the most accurate real-time maps in the world.
That’s why Maptive is built on the Google Maps API: to pair the power and ease-of-use of Google Maps with the complete range of features you need to solve your unique problems—including the most robust color-coding map tools available.
How to Color Code a Map With Maptive
With Maptive, creating your color-coded map is as simple as 1-2-3. All you need is a Maptive account. You can sign up for a free, 10 day trial of Maptive here.
STEP 1:
Upload your data from an Excel Sheet, Google Sheet, or CRM. You can even copy and paste your data by hand.
STEP 2:
Select “Create Map.” Maptive will automatically plot your data.
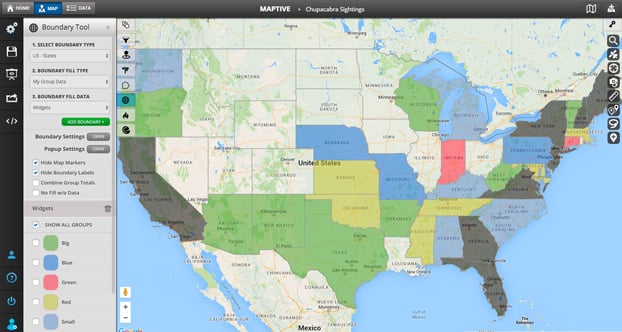
STEP 3:
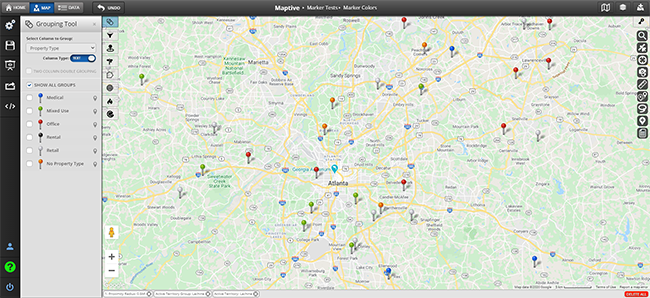
Color code your map with the Boundary Tool. If you prefer, you can color your pin markers with the Group Markers by Color Tool.
Even better? With access to the most comprehensive, intuitive map tools available, you can uncover and unlock a major competitive edge! For example:
- Find relevant data in a breeze, like specific value ranges or categories, with the Filter Tool.
- Identify trends easily with the Multiple Variable Grouping Tool, which expands on your color-coded territories by grouping your data even further.
- Fully customize your map. Upload custom images and brand assets, change your map’s appearance, set default map views, add custom labels, and more.
- Share and present your map on your terms. Print your map up to poster-sized, embed it on your website, export it as an image and more. With Maptive, you can password protect your map to share it privately with a single click.
Create Your Color-Coded Map Today
Start Your Free, No-Risk, 10-Day Trial of Maptive, No Credit Card Required.
From visualizing massive amounts of data to making it easy to get powerful insights and analysis, a color-coded map can quickly become your most convenient and comprehensive asset. With Maptive, you get even more: total customization, rockstar support, and rich features—built on the world’s most reliable interactive mapping software.


