Map Your Customer Locations
Upload the customer list you already keep and watch every account land on an interactive map. Color-code by status or value, read the demographics around each one, and plan routes between them, all from one workspace.
No credit card required
- Plot up to 200,000 customers
- Color-code by status or value
- Map & spreadsheet side by side
- Census data for US & Canada
- Drive-time areas around accounts
- Optimize routes up to 73 stops
Trusted by teams at


What Our Customers Say About Us
See what others have to say about Maptive.
What You Can Do With a Customer Map in Maptive
You start with the spreadsheet you already keep, and from there you can color-code accounts, read the market around them, and plan how you reach each one, all in the same place.
| 01 |
Plot From a SpreadsheetUpload the customer list you keep in a spreadsheet and Maptive places every account on one interactive map. It holds up to 200,000 markers with WebGL rendering, so a large book of business stays smooth as you pan and zoom across it. |
| 02 |
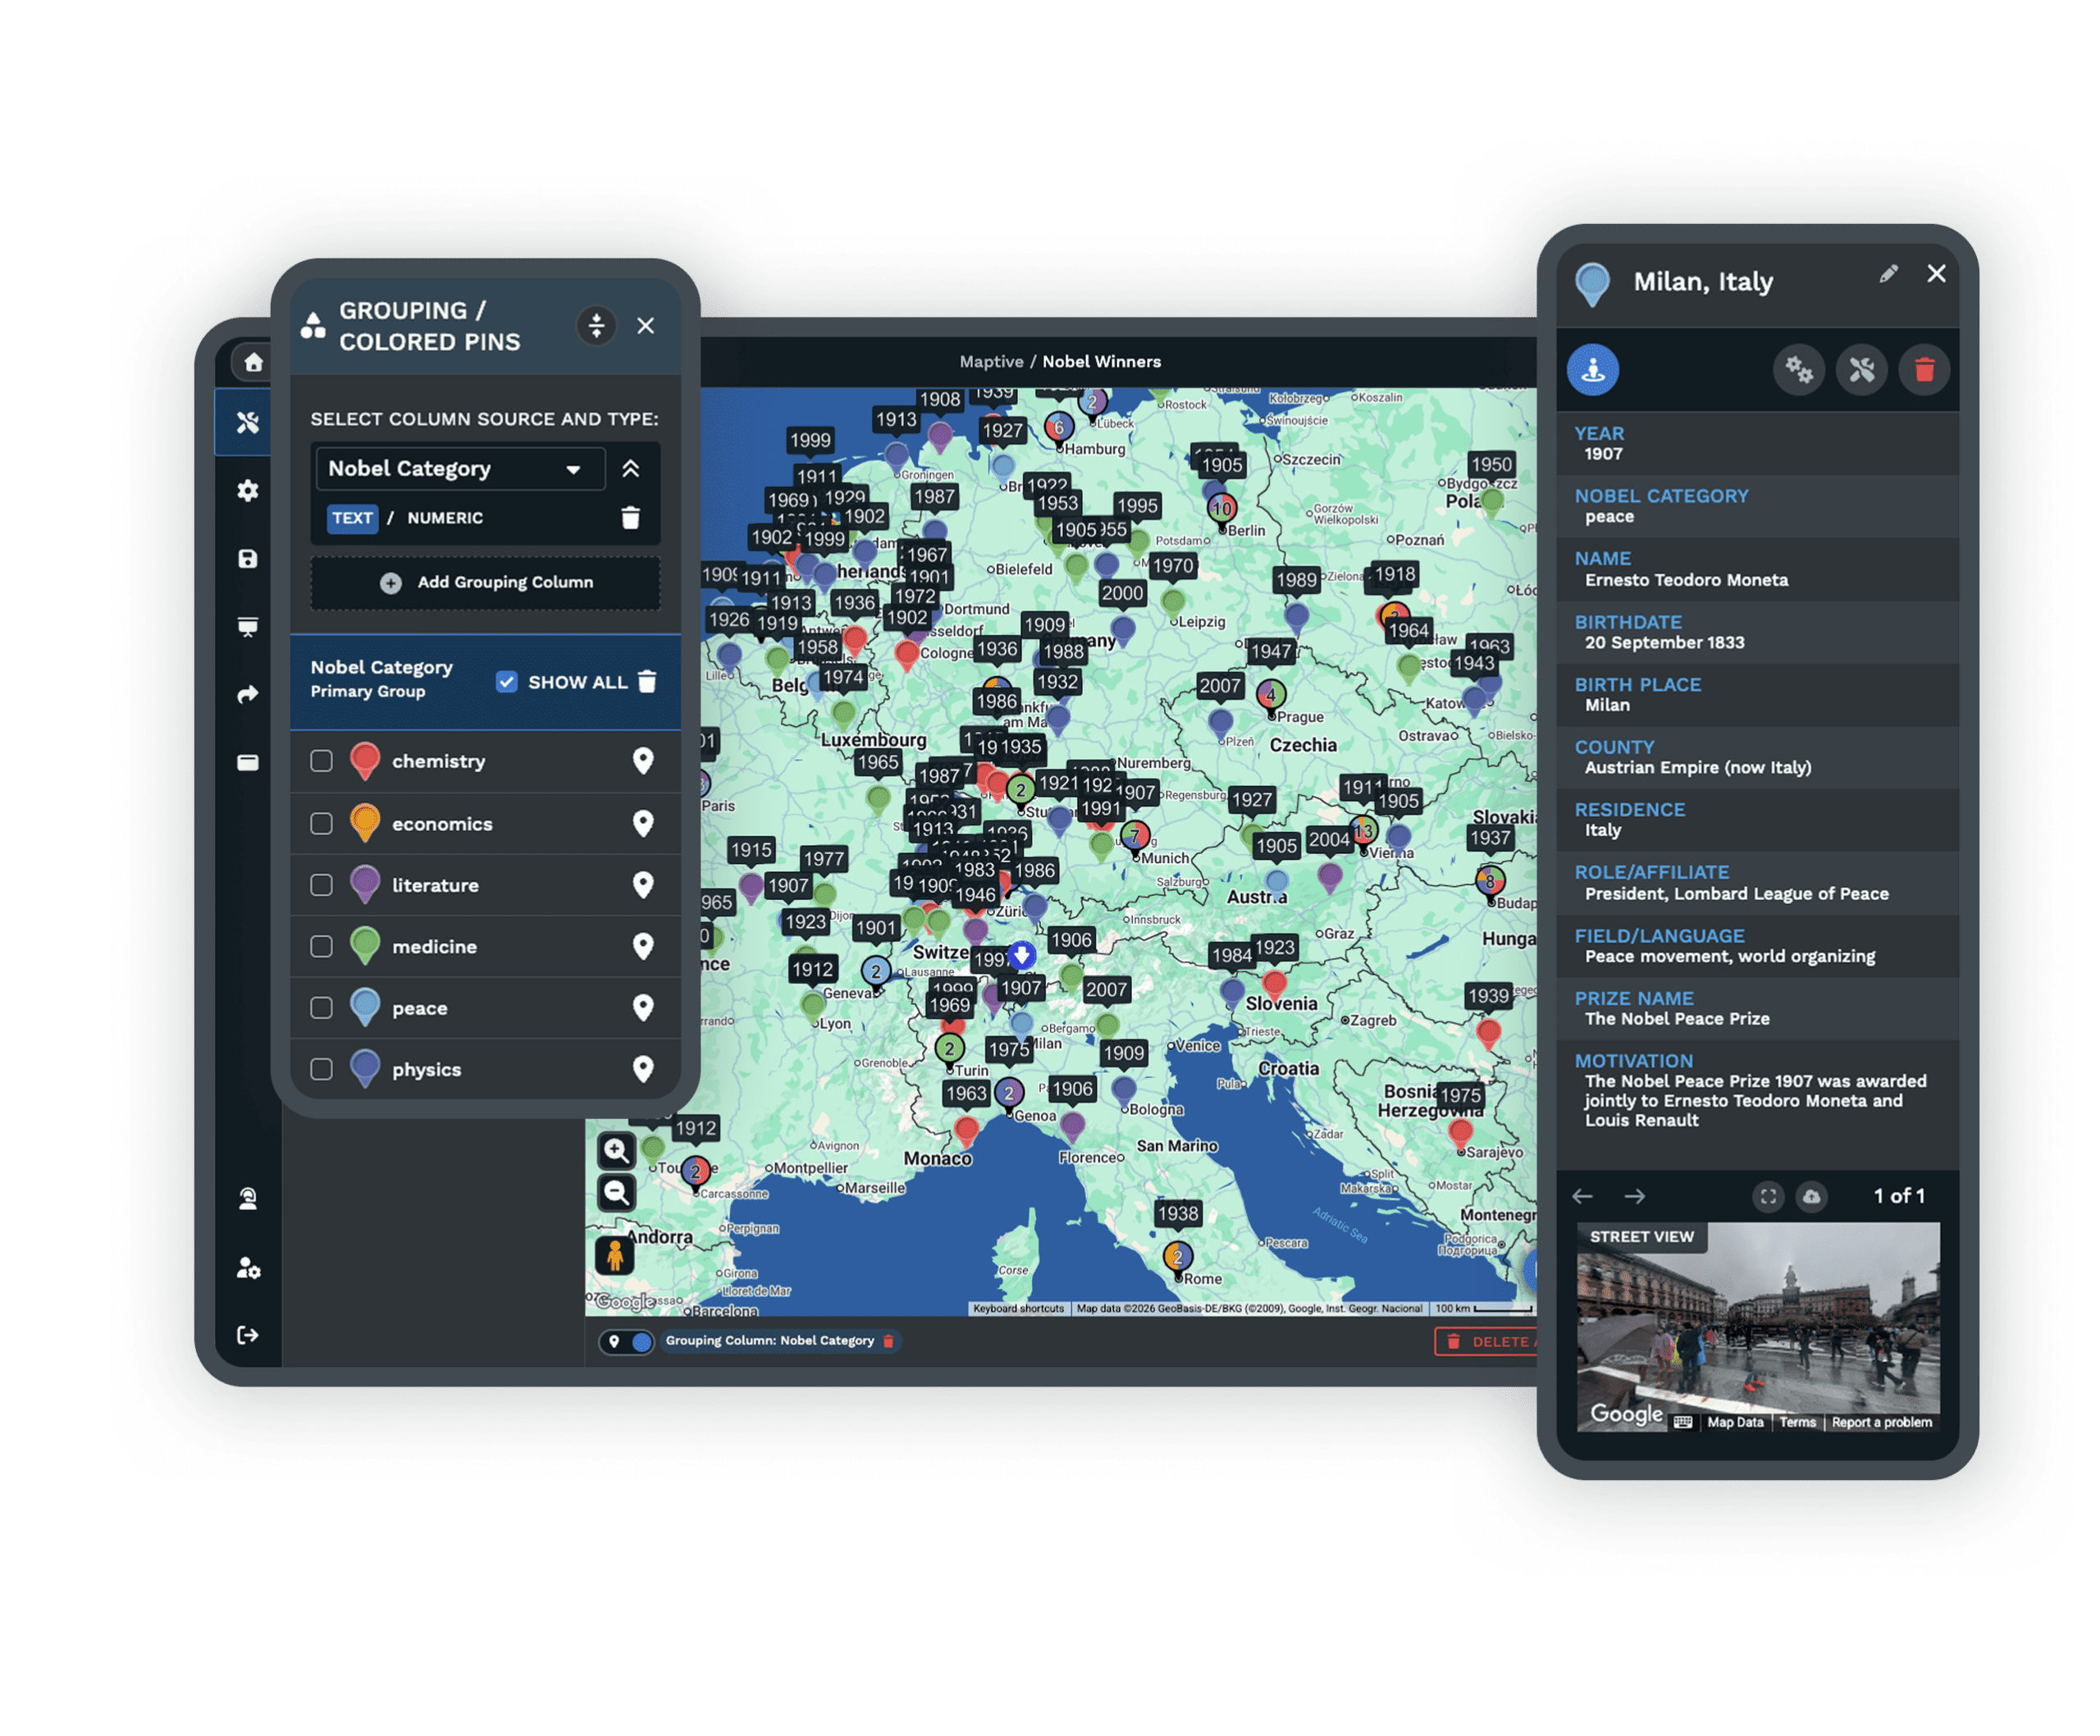
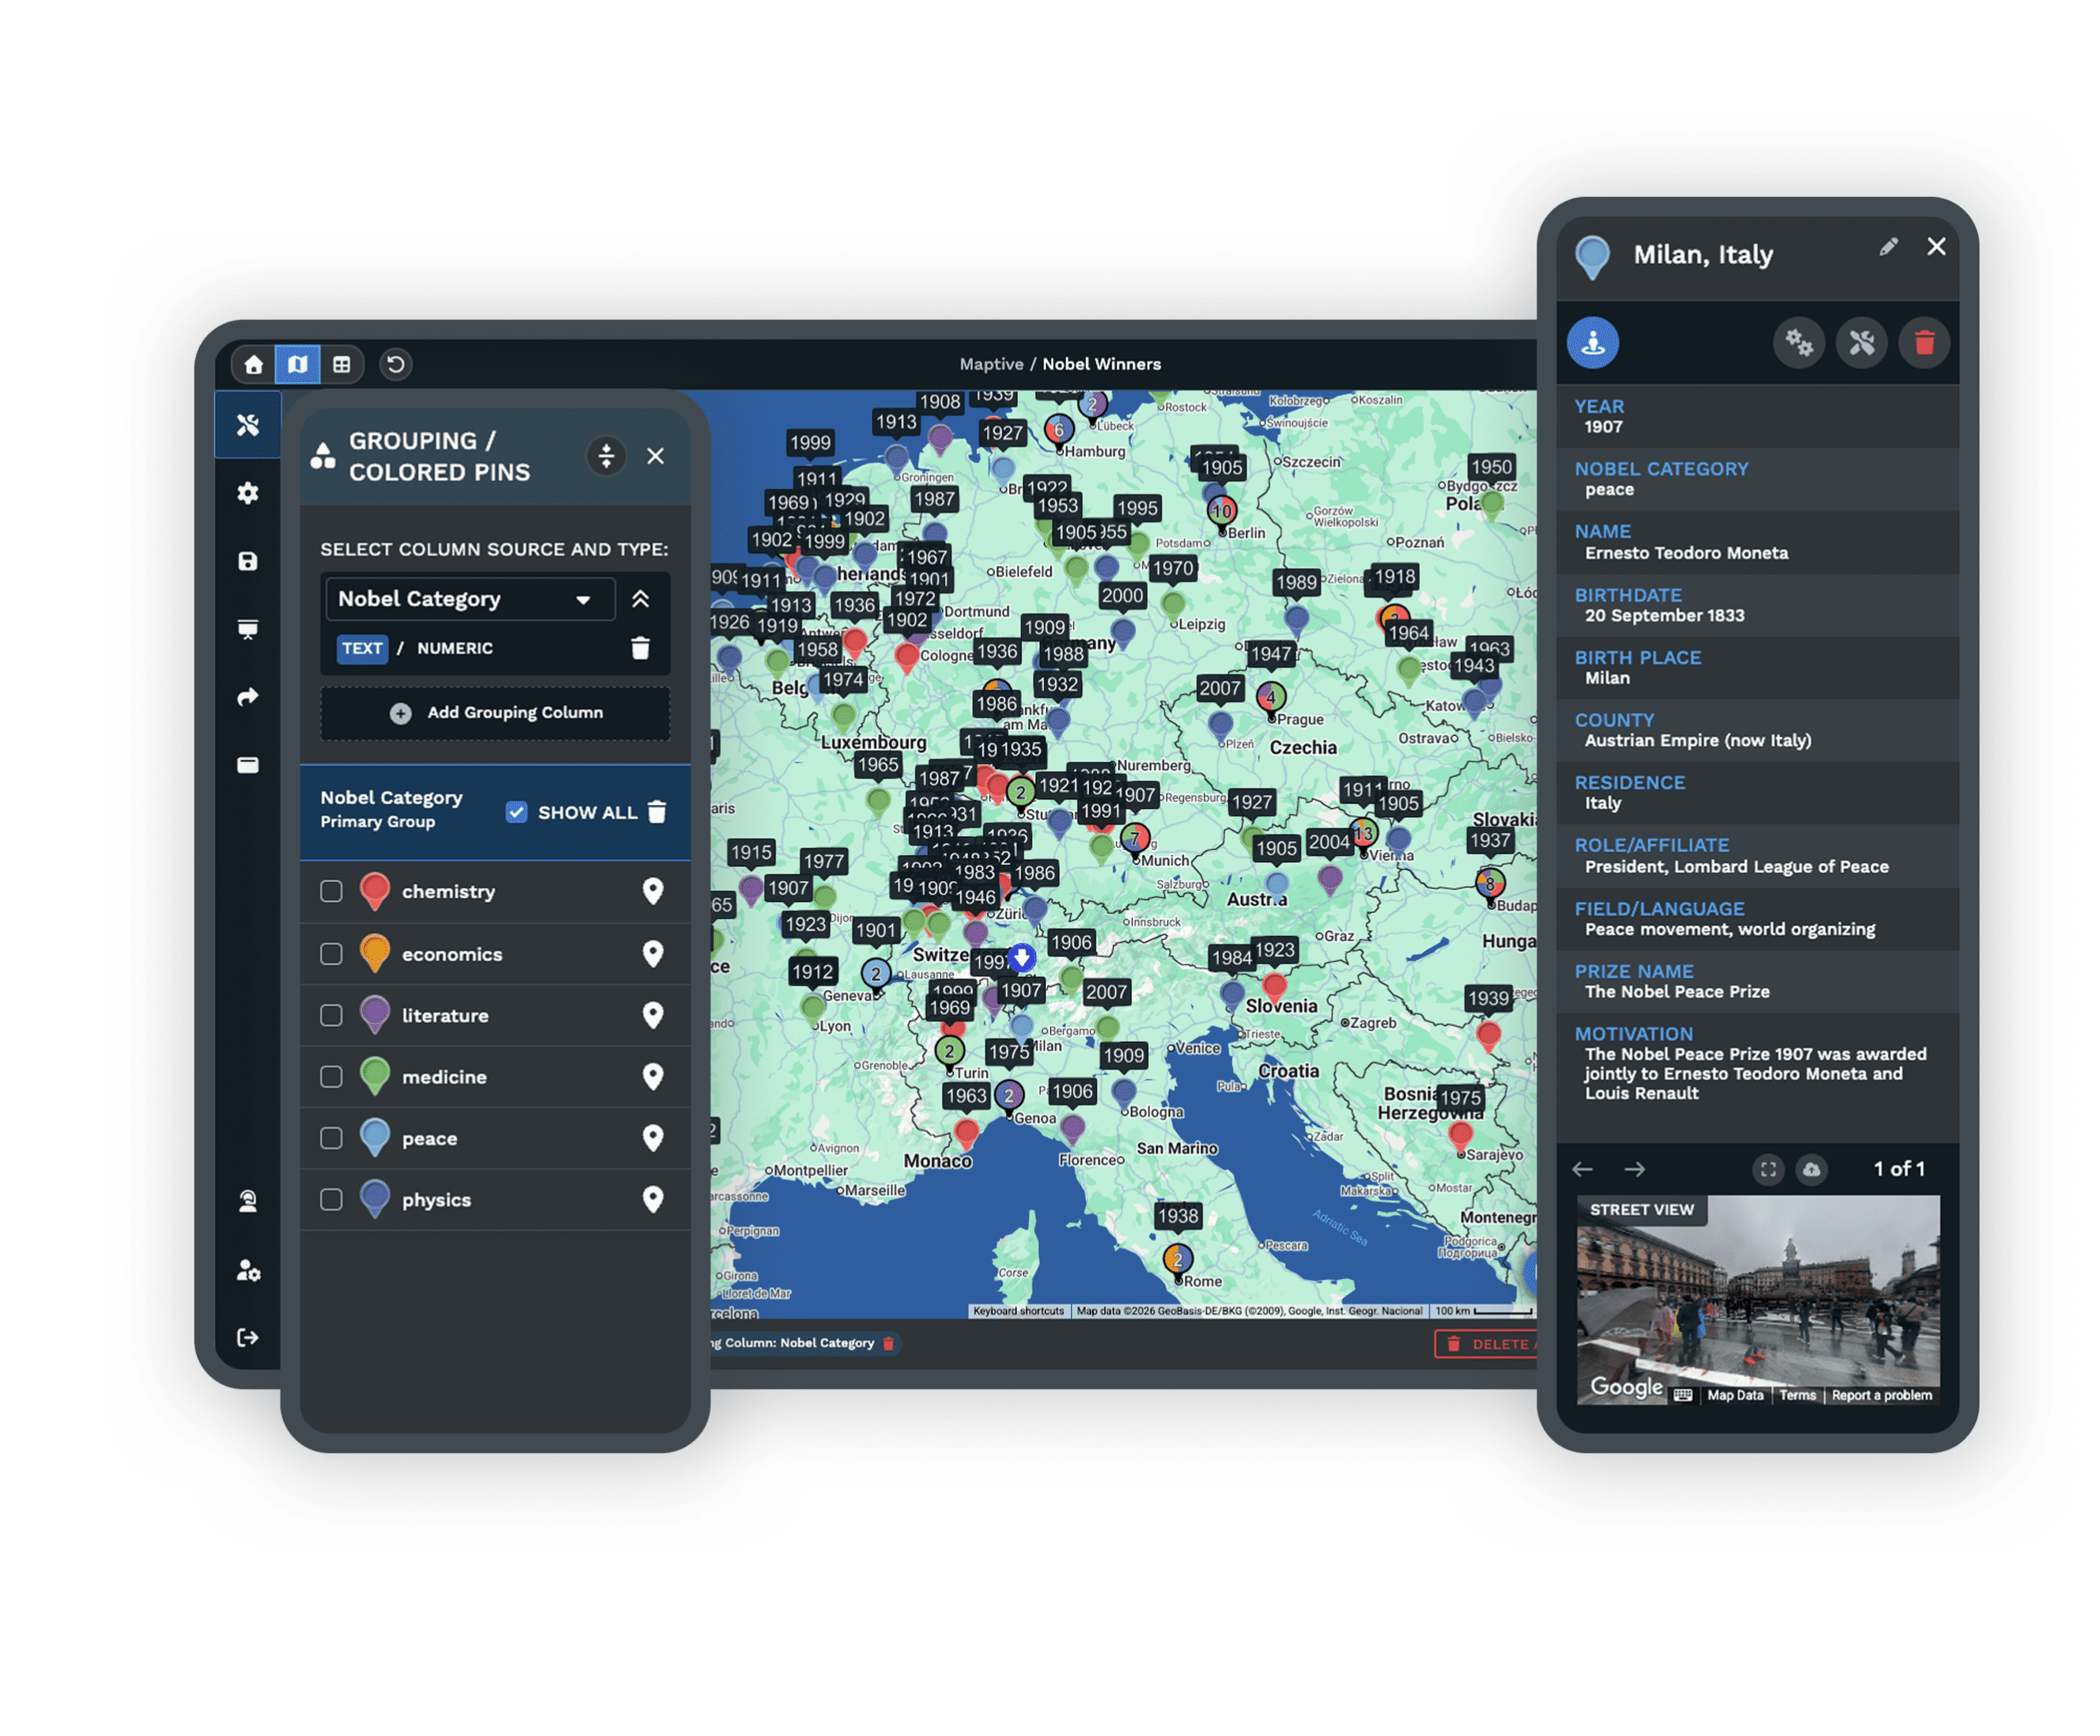
Color-Code and FilterGroup your markers by a column such as status, value, or customer type, and Maptive gives each group its own color with a key beside the map. You can then filter down to a single segment and read it on its own. |
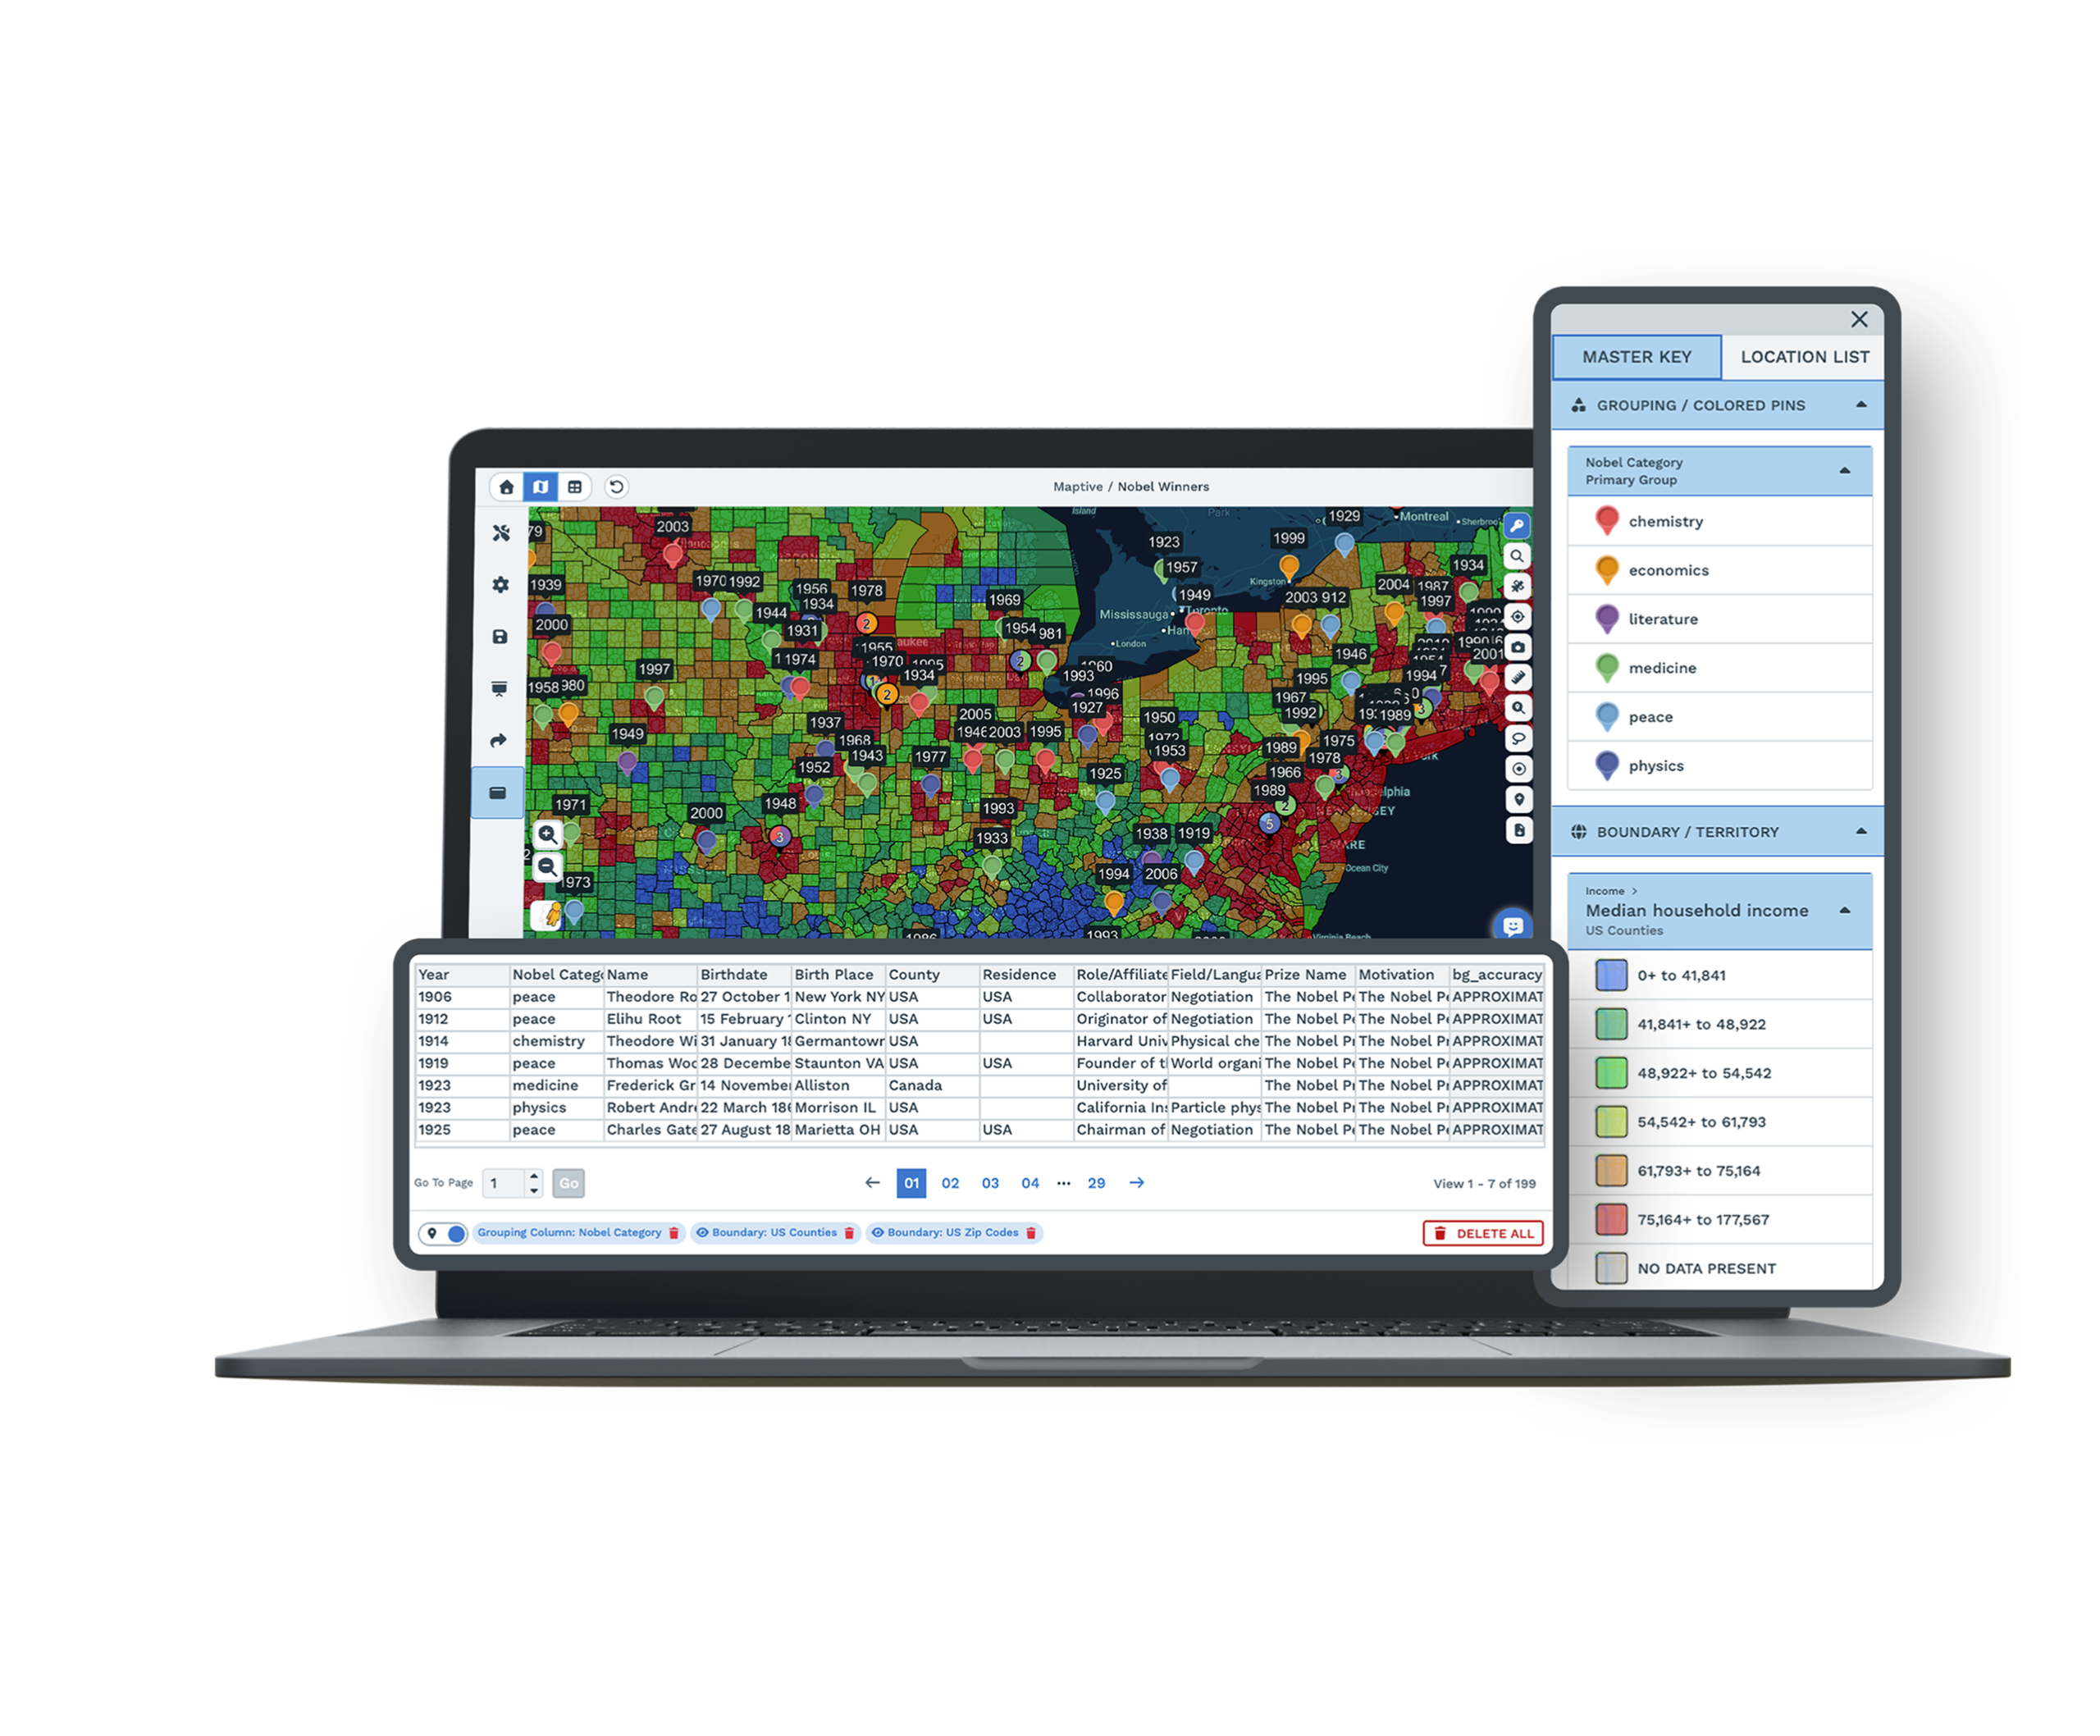
| 03 |
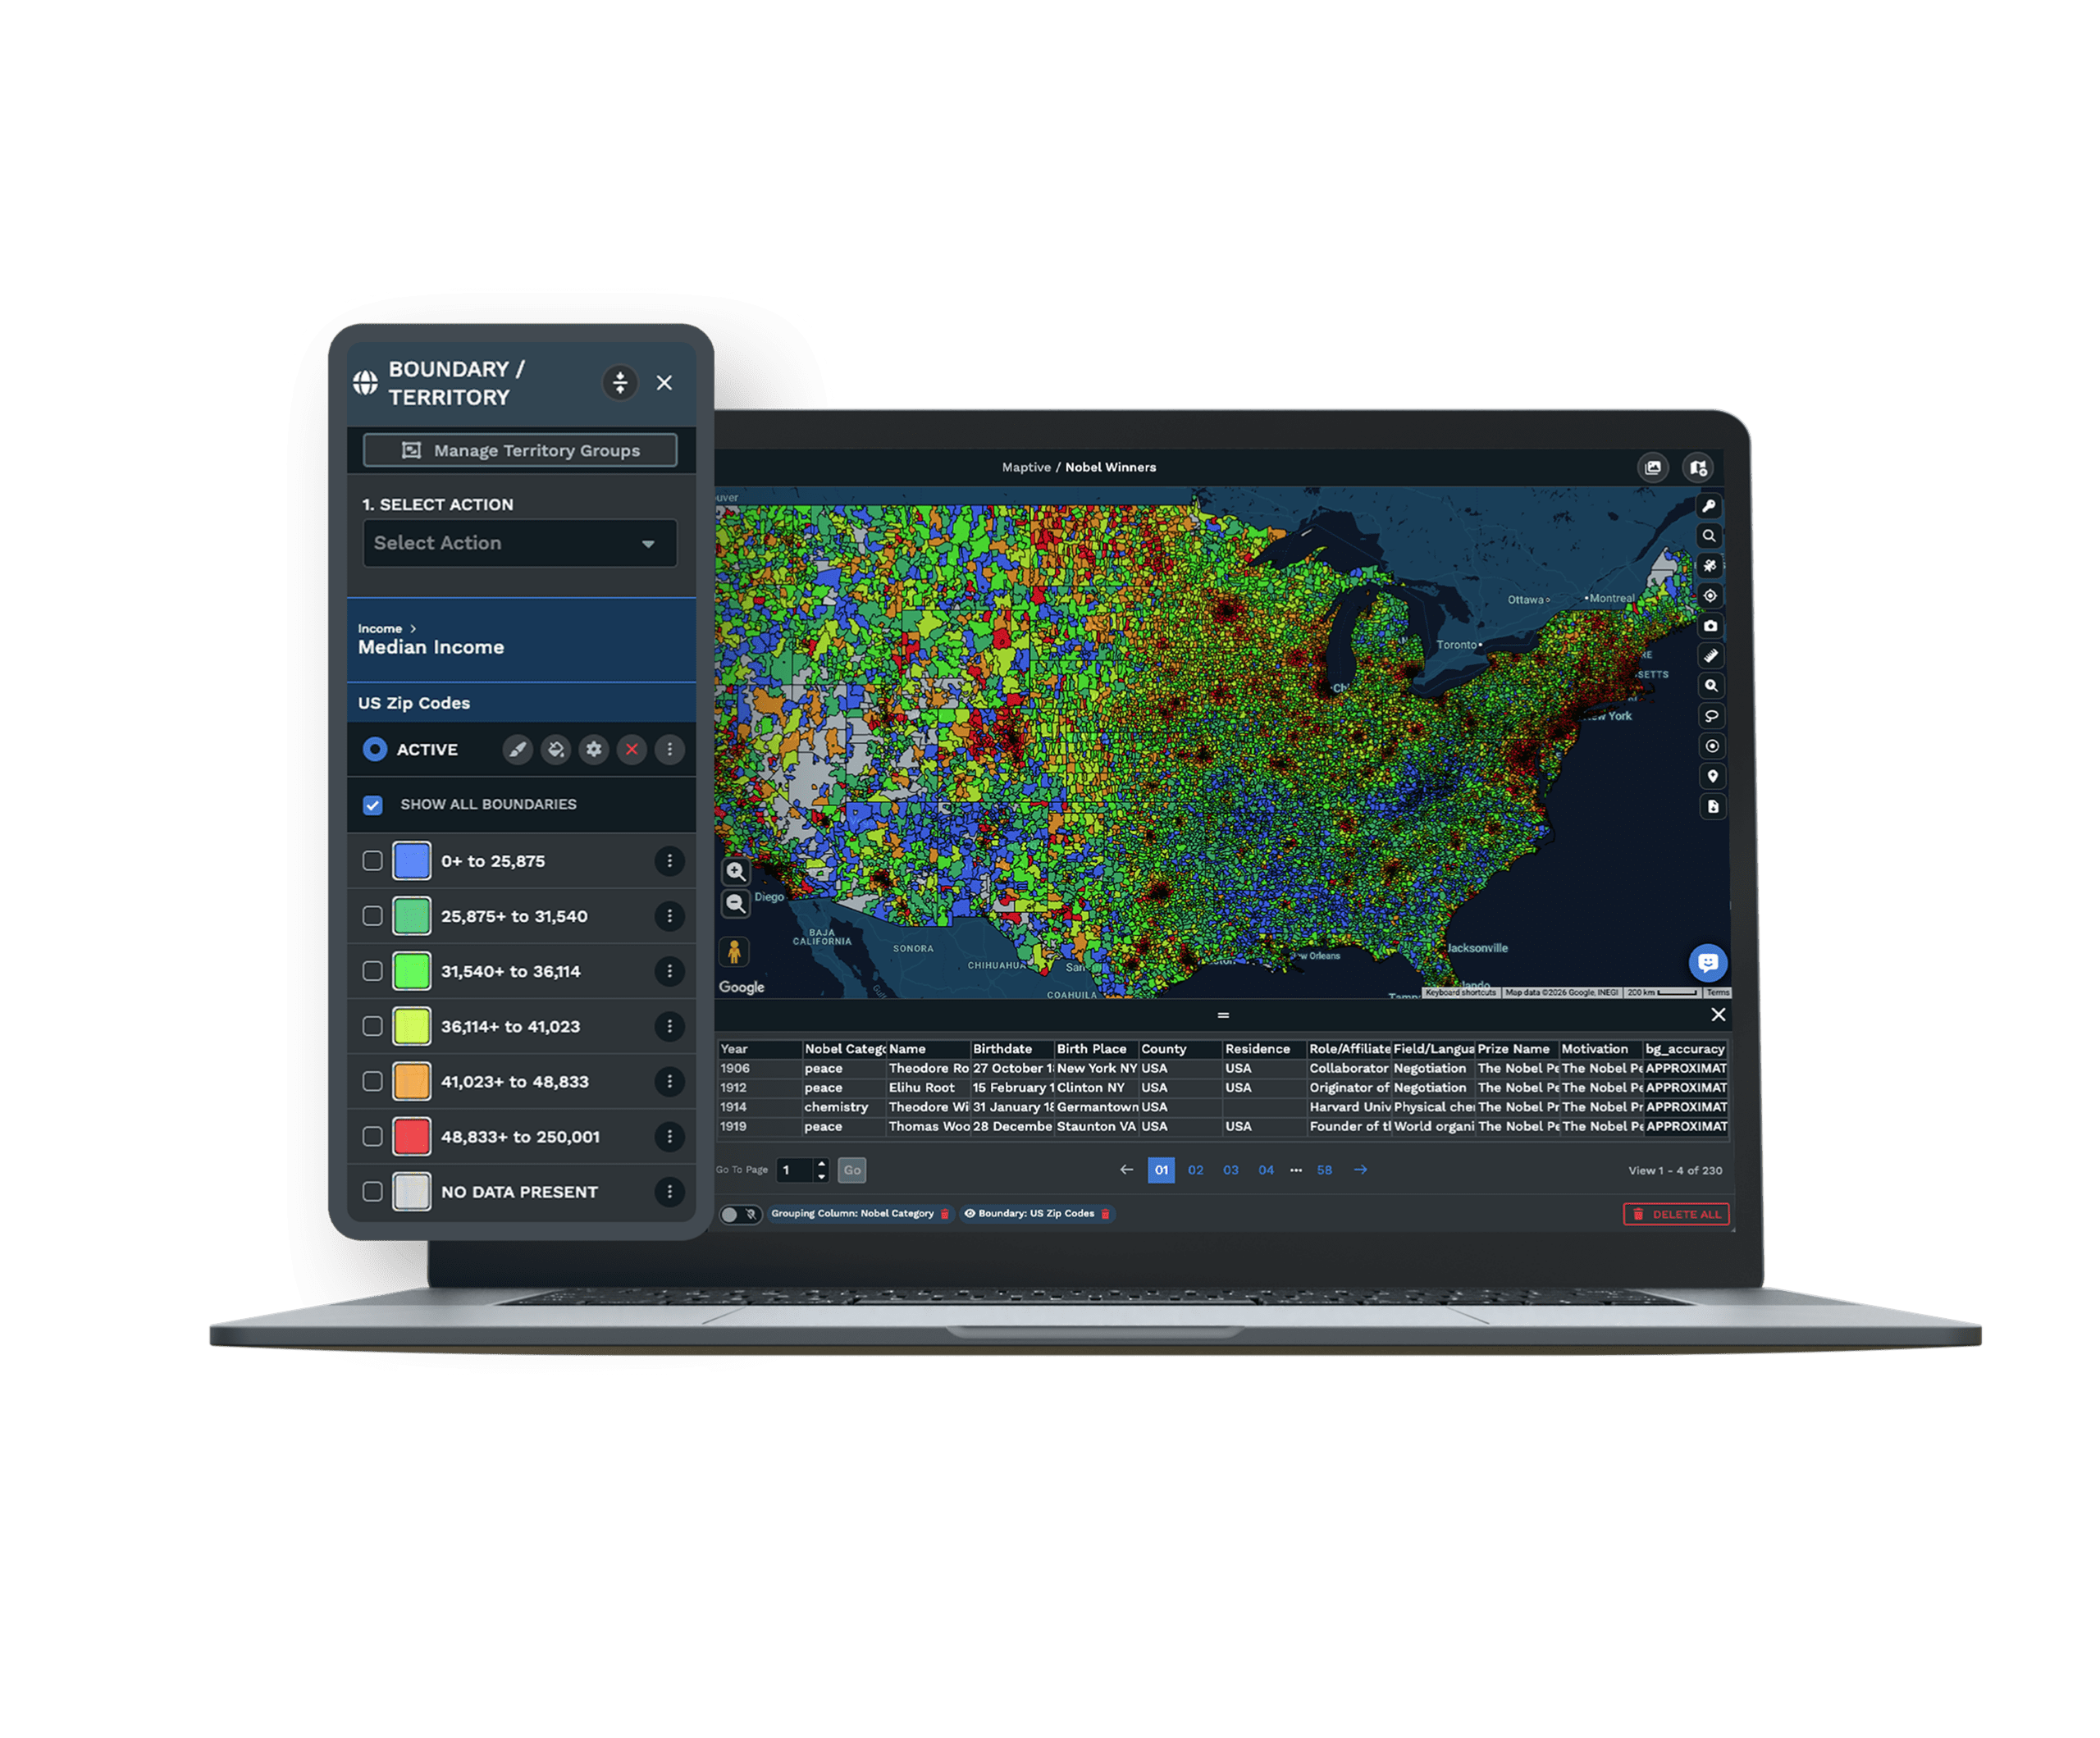
Demographics Around Each AccountAdd census data for the US and Canada over your customers. You can read population, income, and age on radius rings, drive-time areas, boundaries, and territories, so you understand the market sitting around every account. |
| 04 |
Territories From Your CustomersBuild sales territories by zip, county, or state, or draw your own by hand when an area falls outside the usual lines. The boundary and territory tools work together, so you can shape coverage around where your customers actually are. |
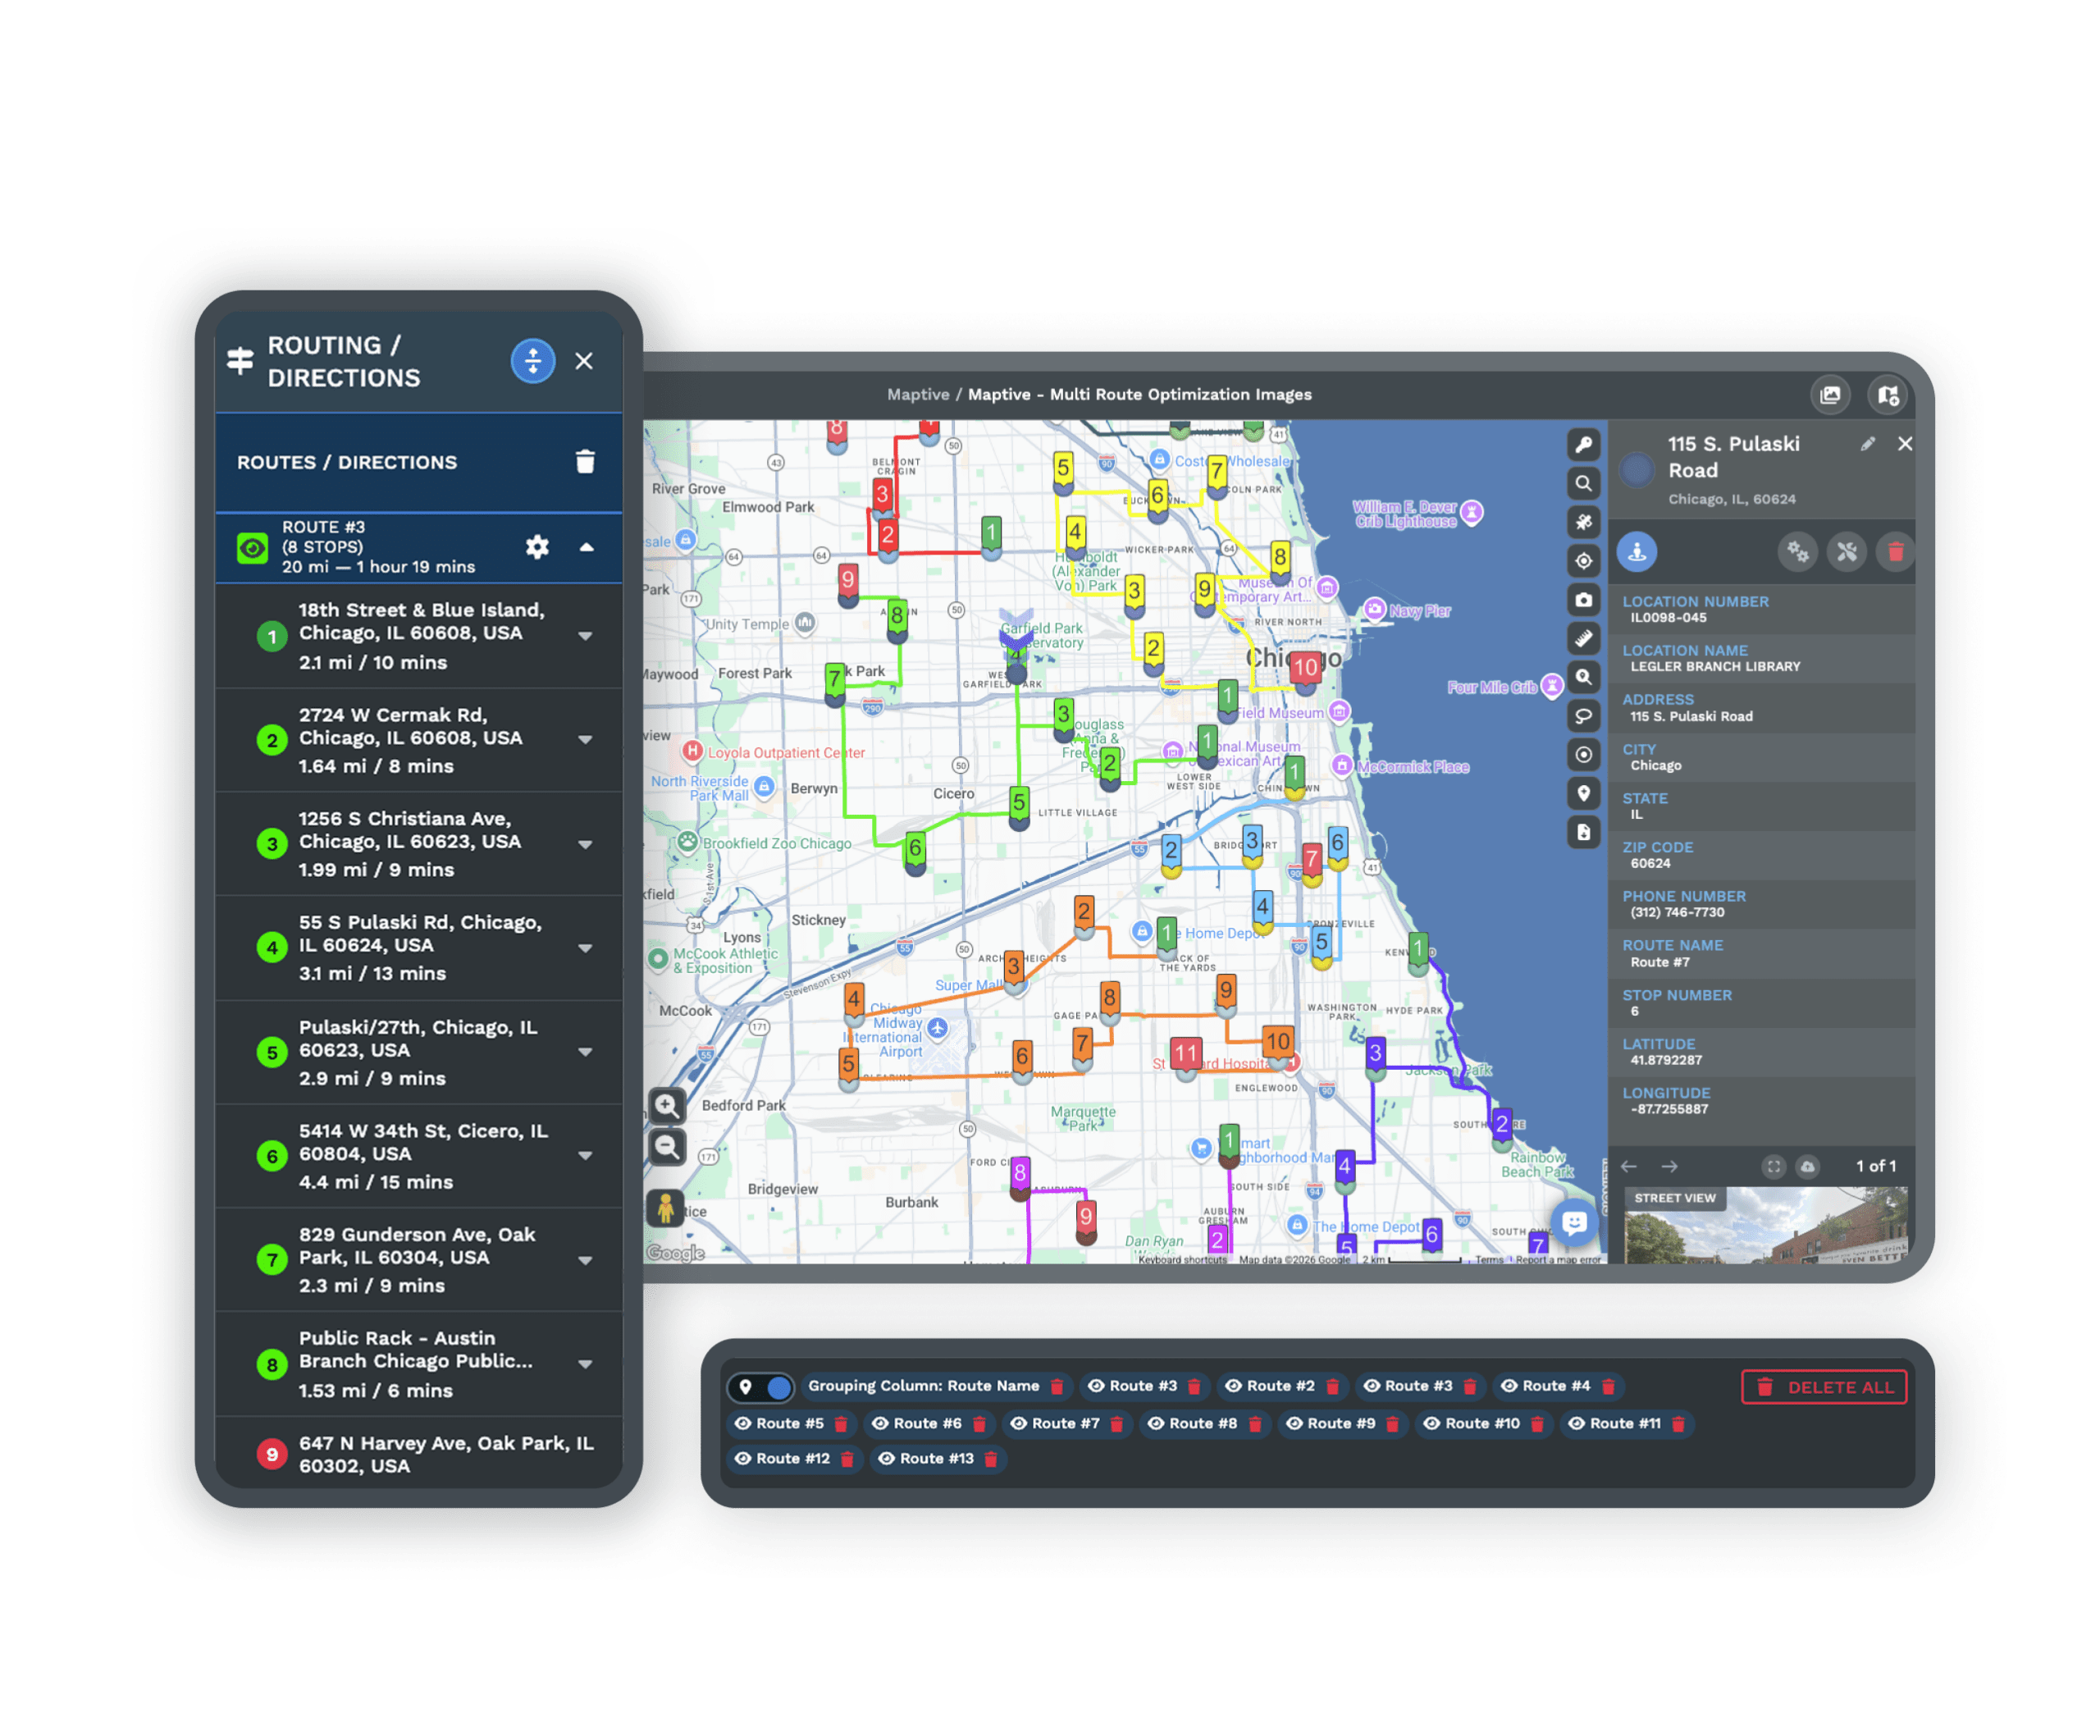
| 05 |
Routes Between AccountsPlan a day of visits with route optimization across up to 73 stops. Maptive orders them for you and gives you turn-by-turn directions you can export, so the person in the field knows exactly where to go next. |
From a Spreadsheet to a Living Customer Map
The list of customers you keep already holds names, addresses, and the numbers you care about. When you upload it to Maptive, every row becomes a point you can see, and the columns you brought along travel with it.
The split-screen view keeps your map and your spreadsheet next to each other. When you edit a value or fix an address in the table, the map updates as you work, so the two never fall out of step. With color-coding by a column and a saved filter, you can move from a flat list to a view that shows you who is where, and what matters about them, in a few minutes.
Read the Market Around Every Account
A customer on a map tells you where they are. The area around them tells you what kind of market they sit in, and that is often where the next decision comes from.
With demographic overlays, you can place census data for the US and Canada over your accounts and read population, income, and age on radius rings, drive-time areas, and territories. From there you can shape coverage with the territory map maker, grouping zip codes, counties, or states into sales territories, or drawing your own when the lines need to follow your customers rather than a county border.
Plan the Day Around Your Accounts
Seeing your customers is the start. The next question is usually how to reach them, and Maptive carries the same map into that part of the work.
You can draw drive-time areas around any account, accurate up to four hours, to see which customers fall within a reasonable trip. When it is time to go, route optimization orders up to 73 stops into an efficient path and hands you turn-by-turn directions you can export for the field. Filter to recent customers, top accounts, or prospects first, then plan the route around only the segment you care about that day.
The Tools Behind Your Customer Map
Each one is a complete tool that you use inside the same workspace.
Marker Grouping Tool
Color-code and group your customers by status, value, or type, with a clear key beside the map.
Explore the tool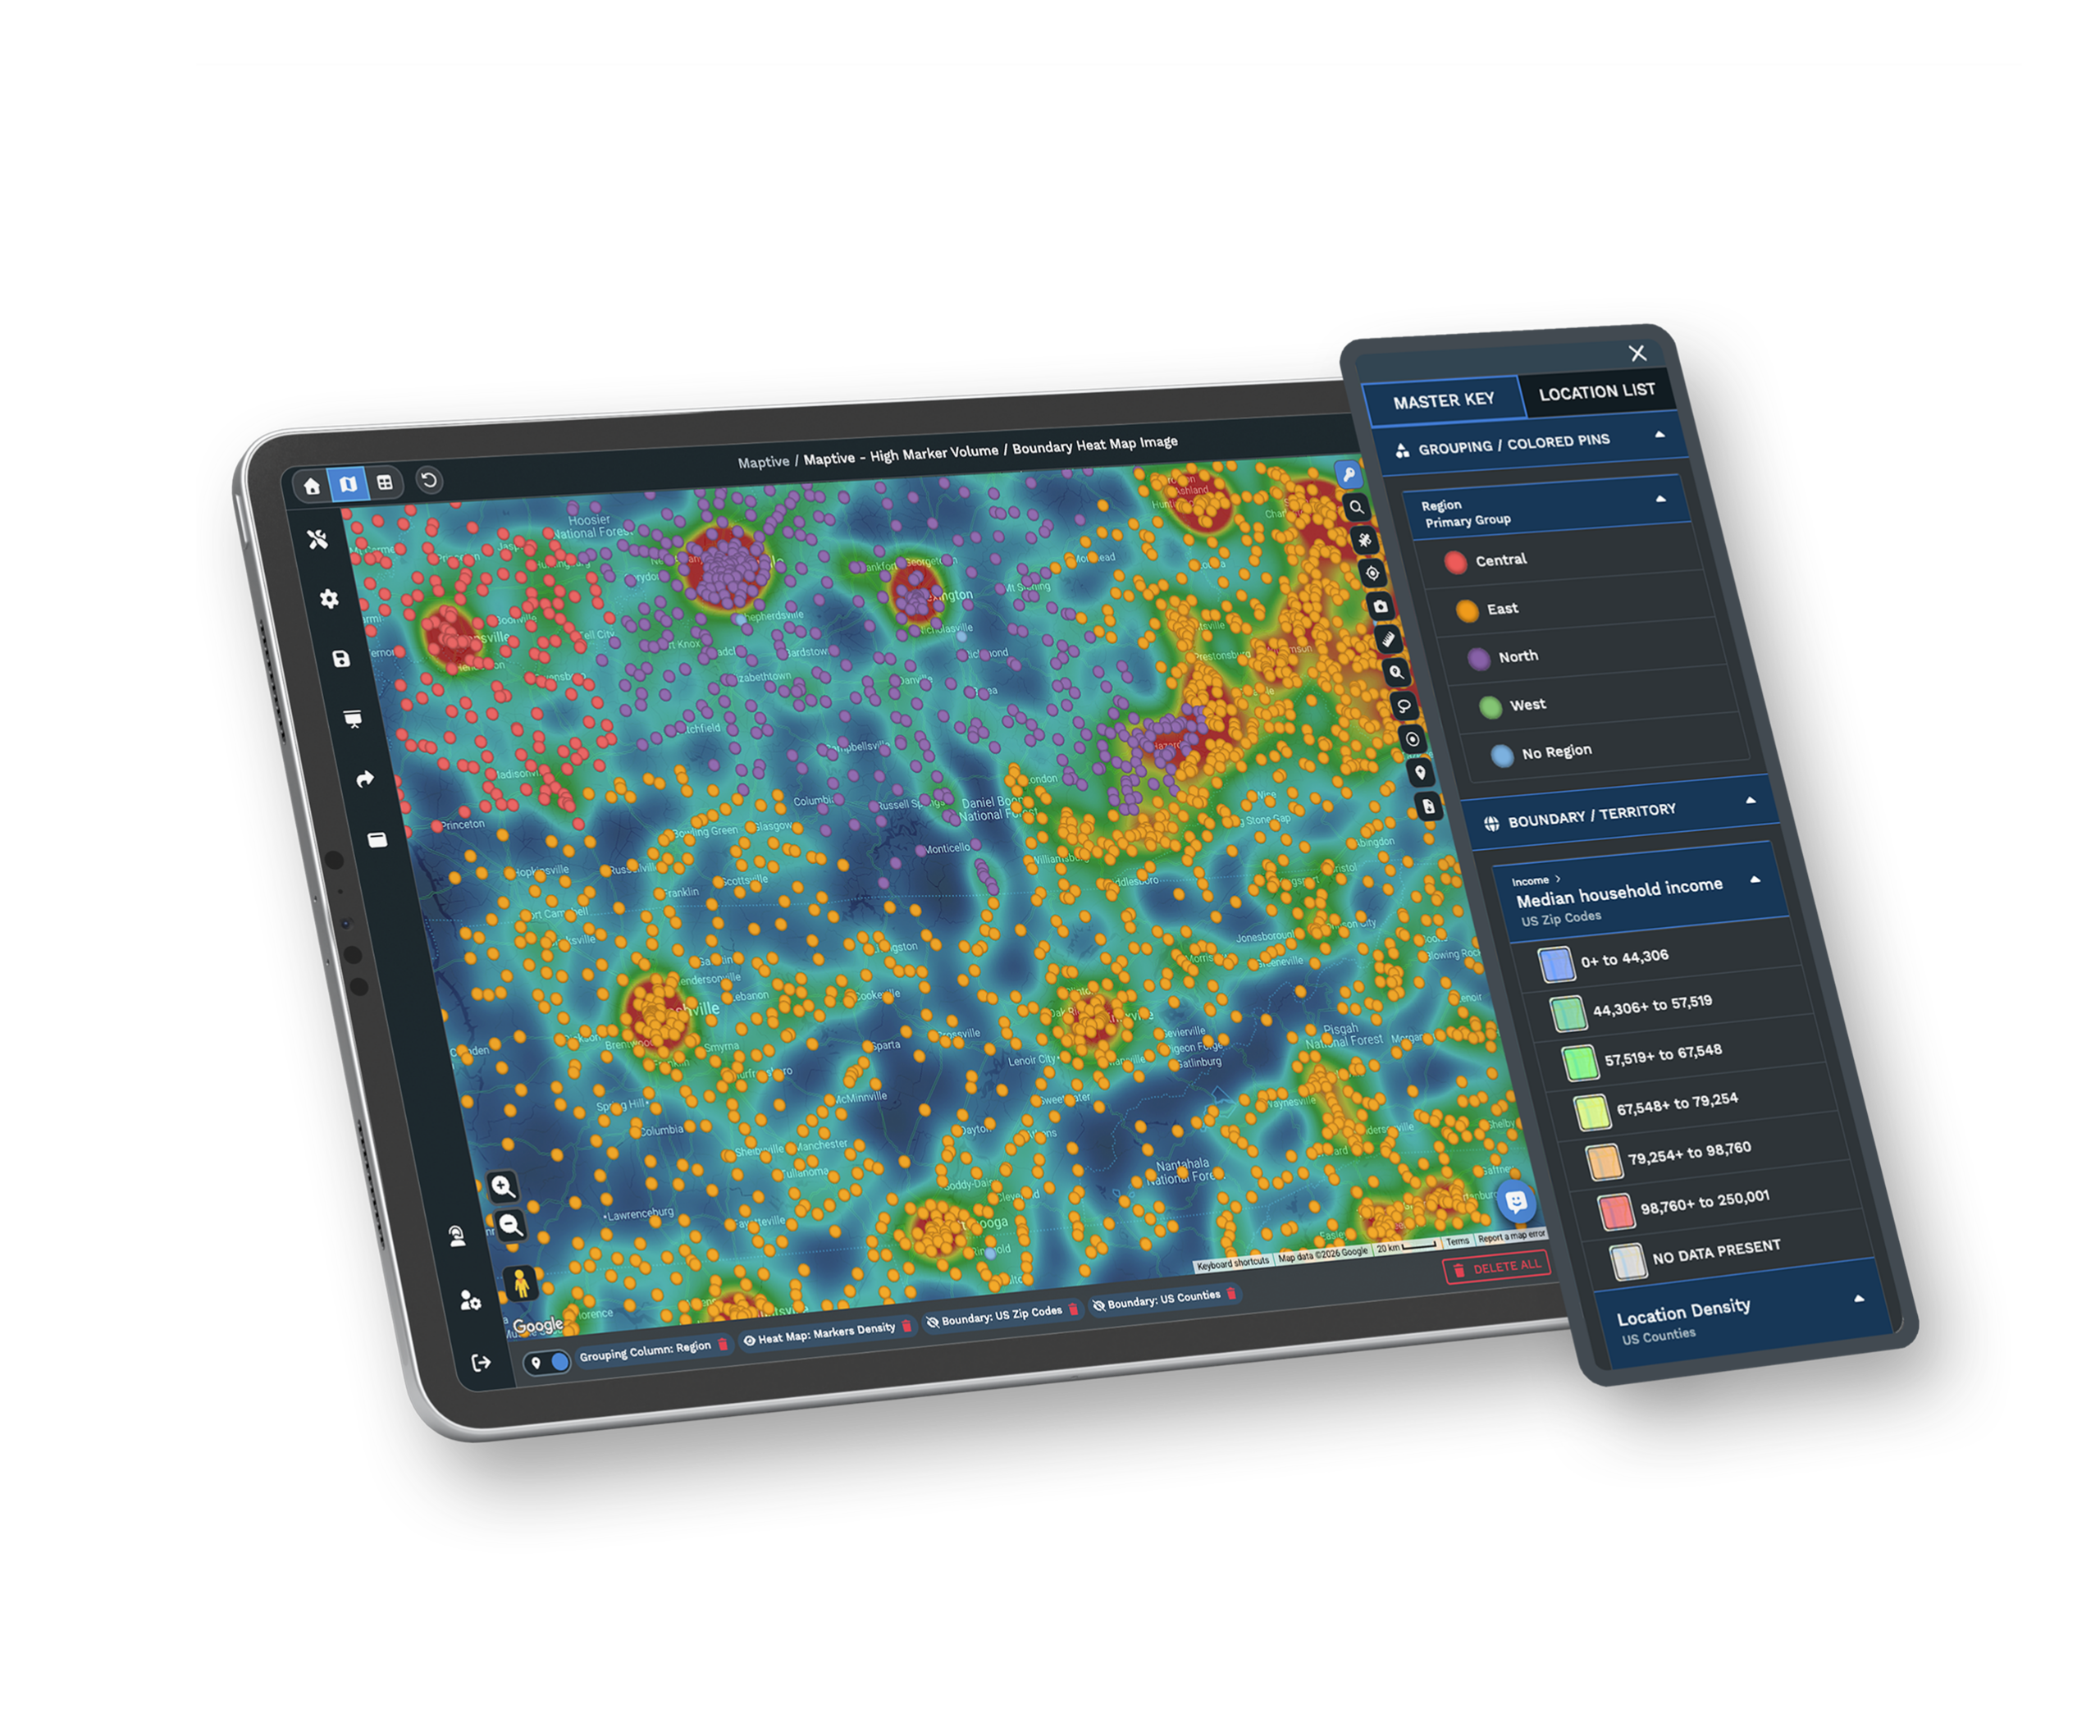
Demographic Overlays
Add US and Canada census data over your accounts to read income, population, and age around each one.
Explore the tool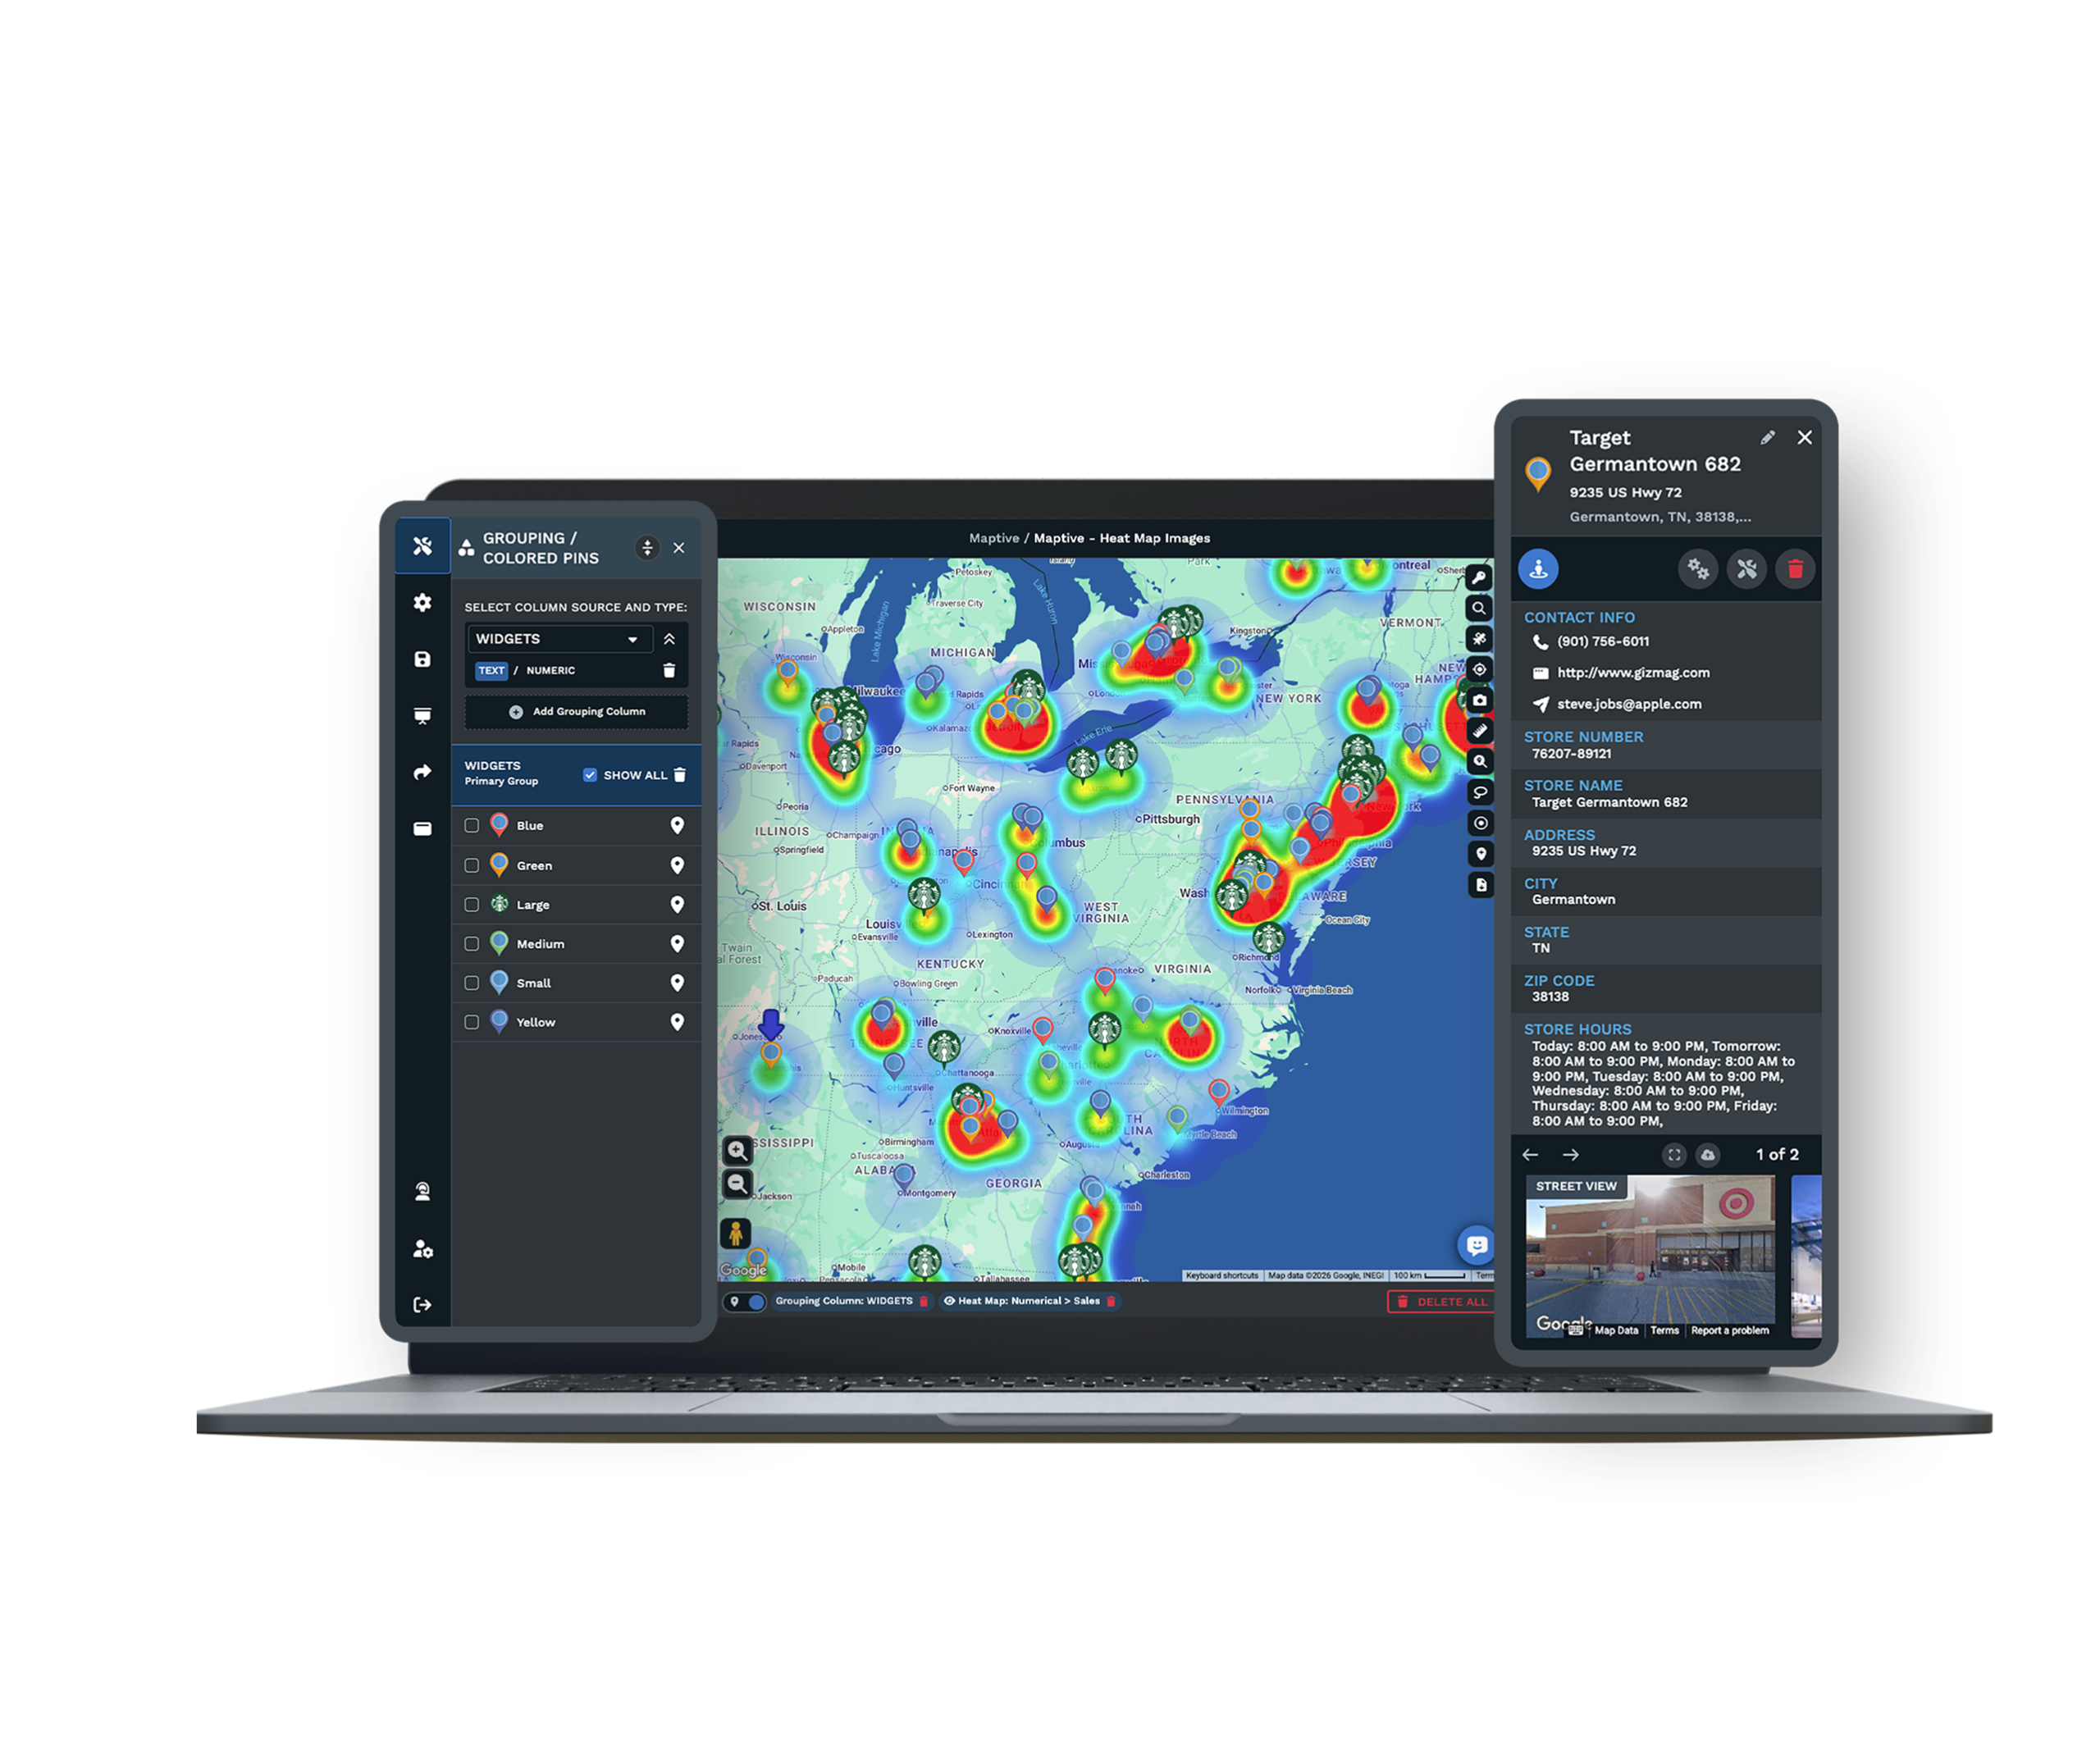
Route Optimization
Order up to 73 stops into an efficient path and export turn-by-turn directions for the field.
Explore the toolBuilt for the Teams Who Work From a Customer List
Who Uses a Customer Map
Field sales reps map their accounts to plan visits and spot gaps in coverage. Delivery and service teams use it to route a day of stops and reach more customers in less driving. Marketing teams read the demographics around their best customers to find where similar buyers live. The same map serves all three from one workspace.
Your Customer Data Stays Protected
Your customer list is sensitive, and Maptive treats it that way. Your data is protected with 256-bit encryption in transit and two-factor authentication on your account, so the people who reach it are the people you have approved. You decide who sees a map, and a shared view never exposes your underlying account list.
A Support Team That Helps You Start
Maptive's support team works from the US and Canada and helps you from the first upload. They can clean your customer file, set up your color-coding and territories, and show your team how to filter and share a view. When a question comes up later, you reach real people who know the product well.
Free trial with the full platform and no credit card
Put Your Customer List on the Map
The ten-day free trial gives you every feature in the platform, and you do not need a credit card to start. Upload your customer spreadsheet, color-code it by status or value, add demographic data around your accounts, and plan a route between them. Everything described on this page is open to you from the first day.
See It With Your Own Customer List
If you would rather see this on your own accounts than a sample, the Maptive team can walk you through it. They will show color-coding, demographic overlays, territory building, and route planning using your data, so you can picture how it fits the way your team already works.
Frequently Asked Questions
What is customer mapping software?
Customer mapping software turns the list of customers you keep in a spreadsheet into points on an interactive map. Instead of reading rows of addresses, you see where your accounts sit, color-coded by the details that matter to you. With Maptive you can also read the demographics around each customer, group accounts into territories, and plan routes between them, so the map becomes something you act on rather than just look at.
How do I map my customers from a spreadsheet?
You upload the spreadsheet you already keep, and Maptive reads the address or location column and places each customer on the map. The other columns you brought along, such as status, value, or type, come with them and are ready to color-code or filter. If an address needs fixing, you can edit it in the split-screen table and the map updates as you go. Most people have a working customer map within a few minutes.
How many customer locations can Maptive plot on one map?
Maptive can plot up to 200,000 markers on a single map. It uses WebGL rendering to draw them, which means a large customer list stays smooth as you pan and zoom rather than slowing down or freezing. Whether you keep a few hundred accounts or a book of business in the hundreds of thousands, you can hold the whole picture in one view and still move around it comfortably.
Can I color-code customers by status, value, or type?
Yes. You can group your markers by any column in your data, such as account status, customer value, or customer type, and Maptive gives each group its own color with a key beside the map. This makes patterns easy to read at a glance, like where your highest-value customers cluster or which areas hold mostly prospects. You can change the grouping column whenever you want a different view of the same map.
Can I see my map and my spreadsheet at the same time?
Yes. The split-screen view keeps your map and your spreadsheet side by side. When you edit a value, fix an address, or update a status in the table, the map reflects the change as you work, so the two stay in step. This is helpful when you are cleaning up a customer file or checking that each account landed where you expected, since you can see the data and the map together.
Can I add demographic data about my customers?
Yes. Maptive includes census data for the US and Canada, covering population, income, and age. You can read it on radius rings, drive-time areas, boundaries, and territories drawn around your accounts, so you understand the market each customer sits in. This helps you see whether an area is growing, find where similar buyers live, and decide where to focus, all from the same map that holds your customer list.
Can I build sales territories from my customer map?
Yes. You can build sales territories by zip code, county, or state, or draw your own by hand when an area needs to follow your customers rather than a standard border. The boundary and territory tools work together, so you can shape coverage around where your accounts actually are. You can then read the demographics inside each territory and share a focused map of it with the rep who owns it.
Can I plan routes between customer locations?
Yes. Route optimization orders up to 73 stops into an efficient path and gives you turn-by-turn directions you can export for the field. You can also draw drive-time areas around an account, accurate up to four hours, to see which customers fall within a reasonable trip. Filter to the segment you care about first, such as top accounts or recent customers, then build the route around only those stops for the day.
Can I filter my customer map to a segment and share it?
Yes. You can filter to a segment such as recent customers, top accounts, or prospects, save that view, and share it. You can isolate specific territories so a shared map shows only what a person needs to see, then embed it on a page or export it. Viewers do not need a Maptive account to open a shared map, and a shared view never exposes your full underlying customer list.
Is my customer data secure?
Yes. Your customer data is protected with 256-bit encryption in transit and two-factor authentication on your account, so access stays with the people you approve. You control who can see a map, and when you share a focused view, it shows only what you choose rather than your whole account list. Maptive treats your customer list as the sensitive information it is, and keeps it under your control.


