Insurance Mapping Software
Maptive maps your policyholders, your agents, and the risk around every address. See exposure concentrate, balance producer territories, and route adjusters to the field after a storm, from one upload.
No credit card required
- Map exposure concentration
- Risk by ZIP or county
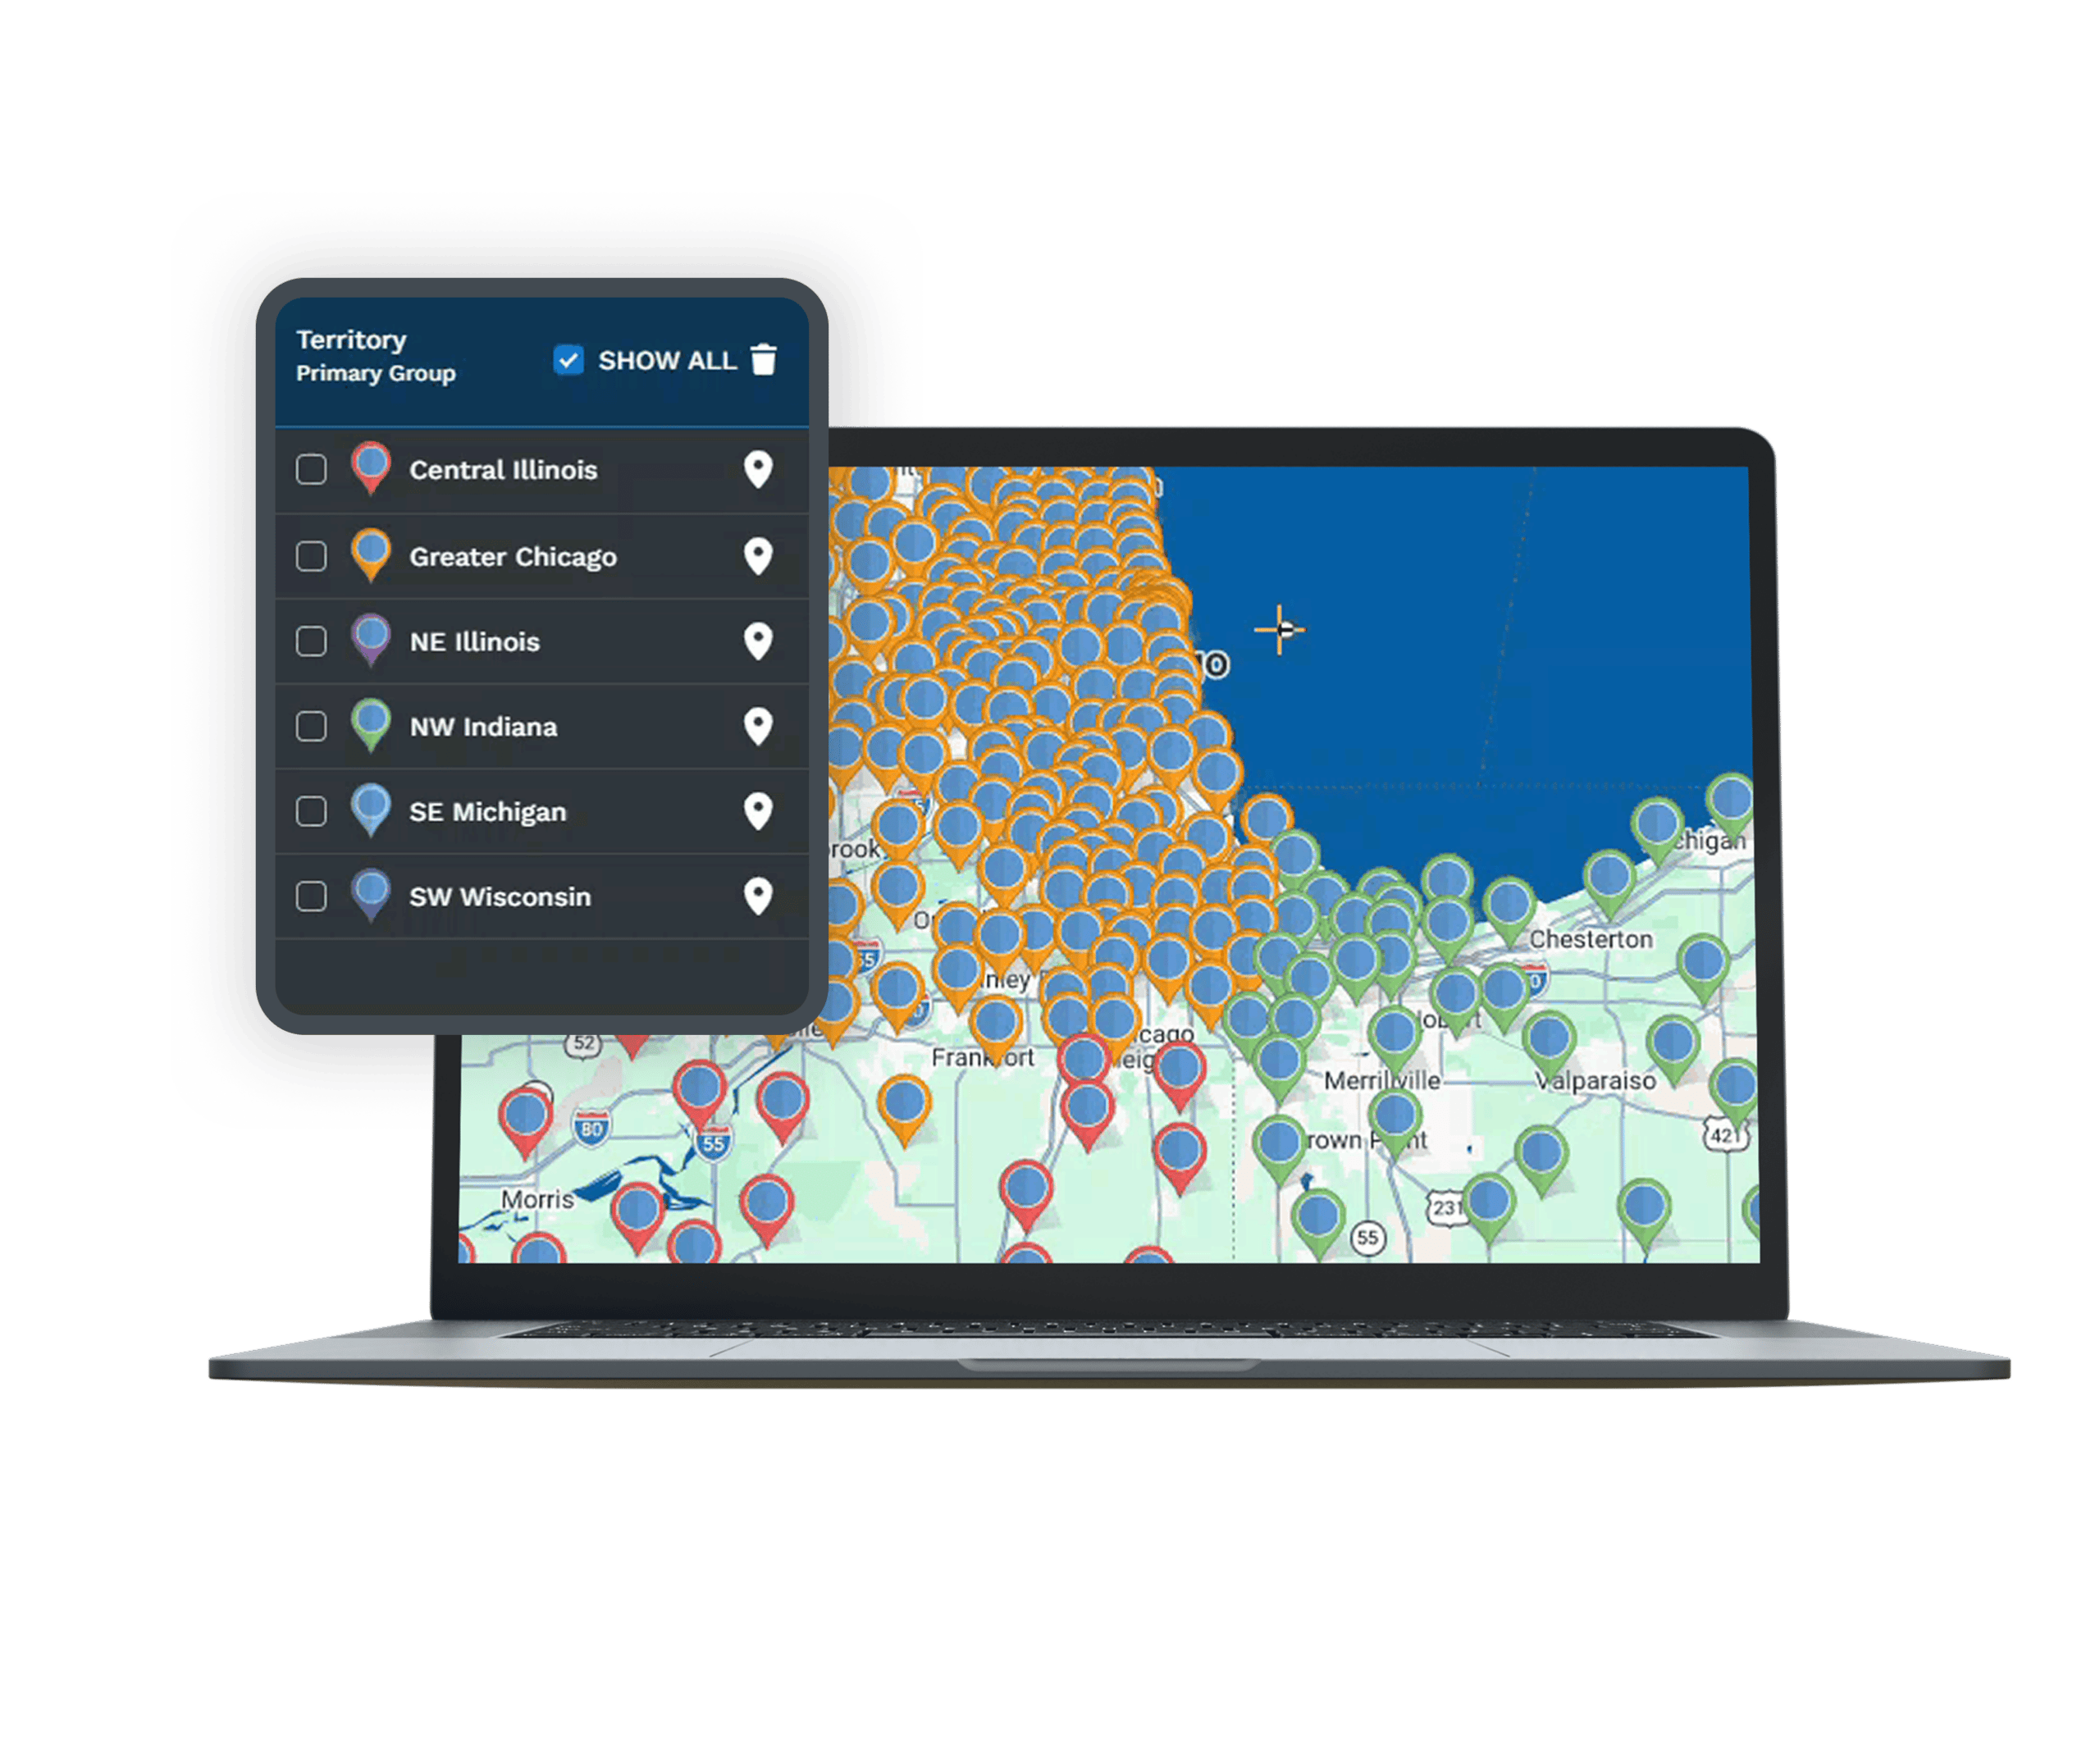
- Balance agent territories
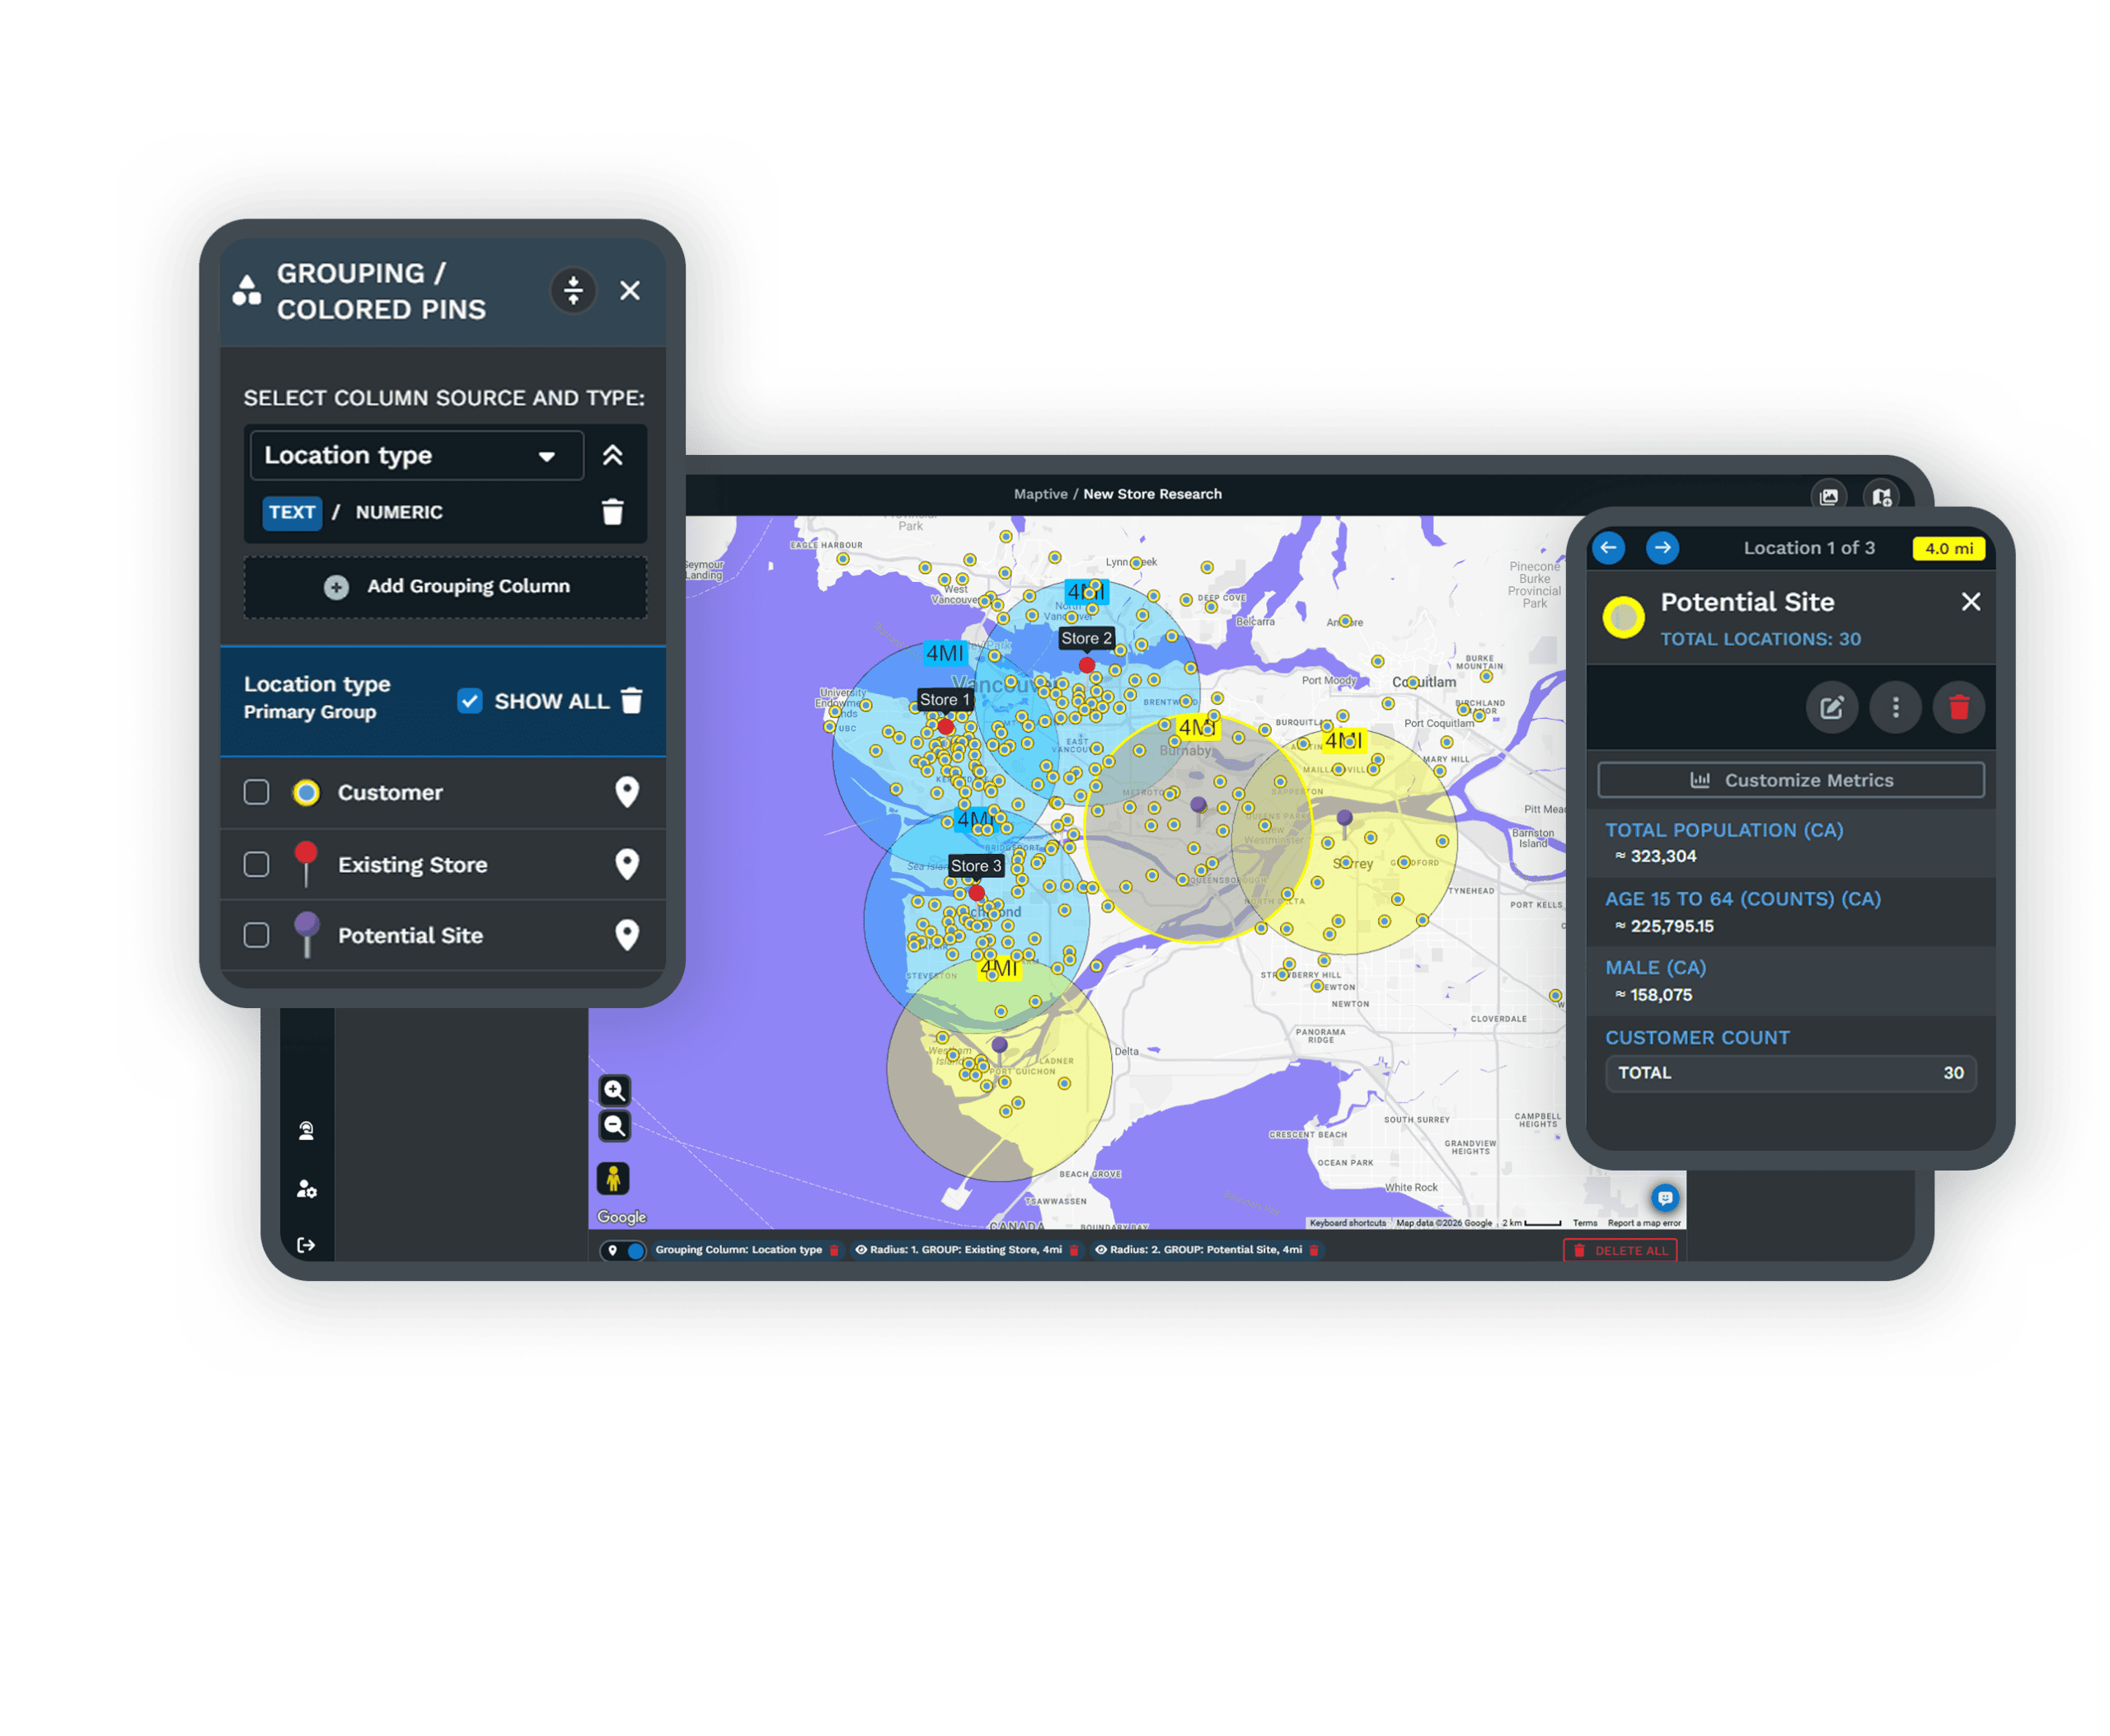
- Radius rings around a loss
- Layer demographic & hazard data
- Spot accumulation early
- Map exposure concentration
- Risk by ZIP or county
- Balance agent territories
- Radius rings around a loss
- Layer demographic & hazard data
- Spot accumulation early
Trusted by teams at


Exposure, Coverage, and Reach
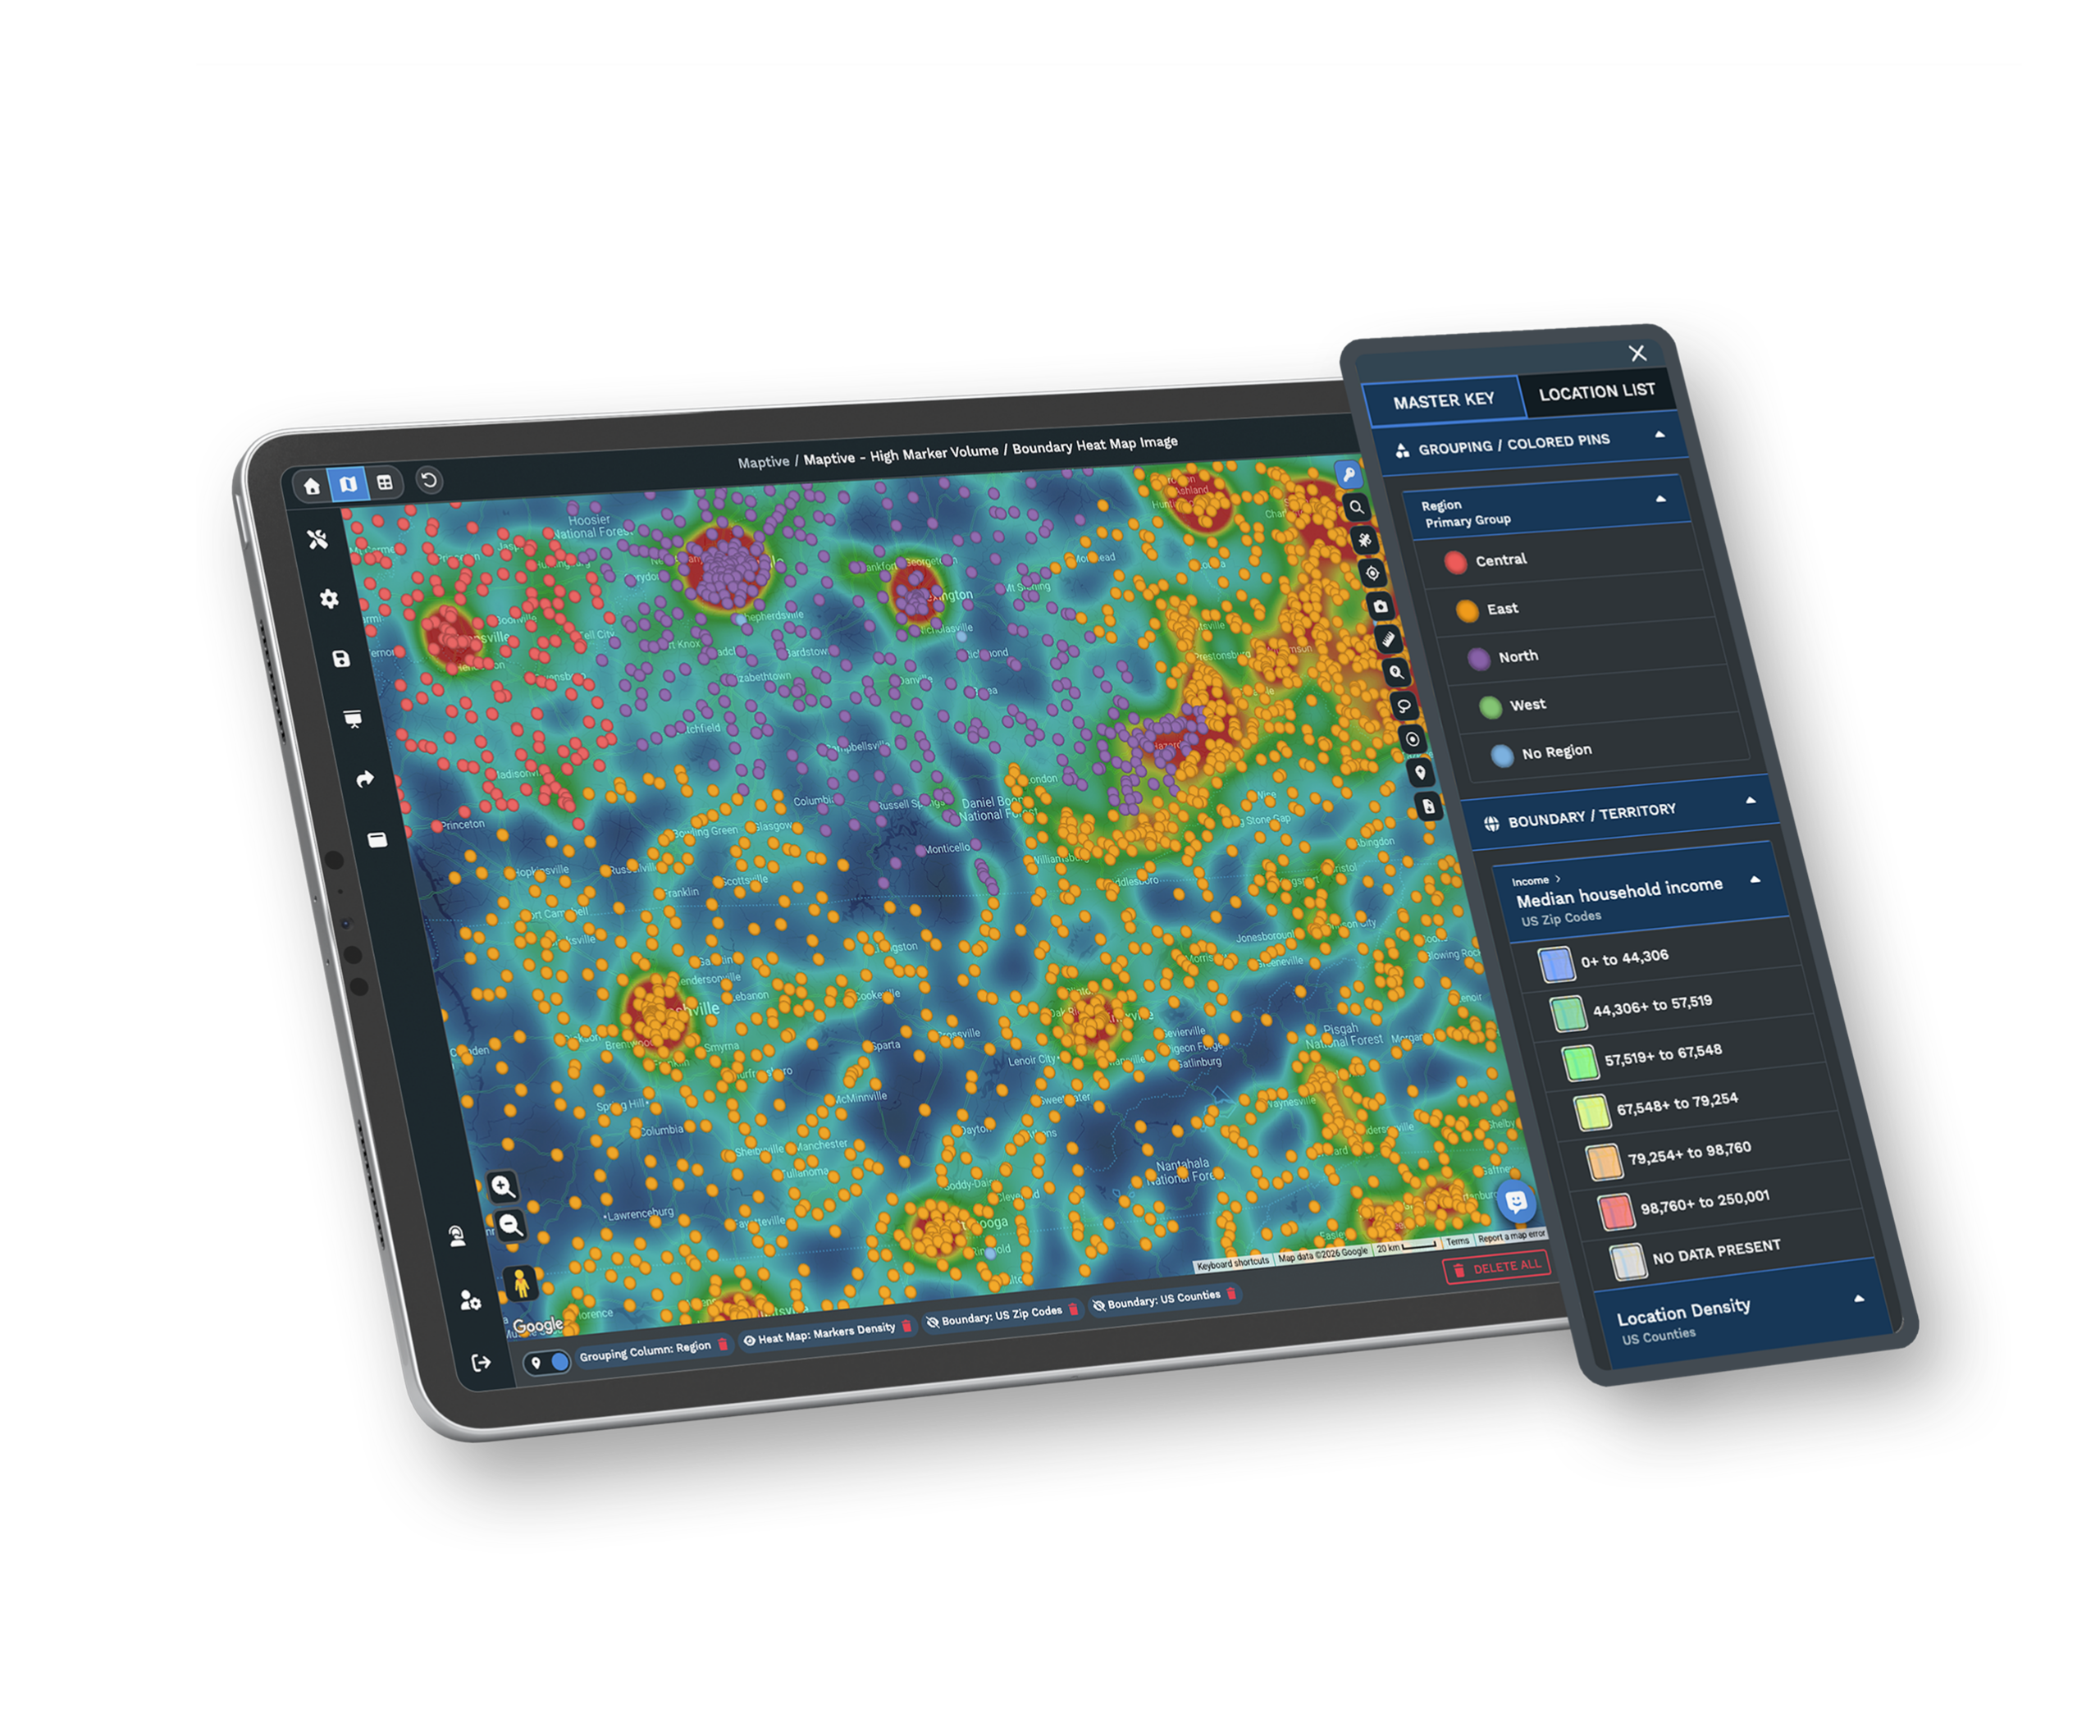
WebGL rendering plots a full book on one screen, weighted by policy count or insured value.
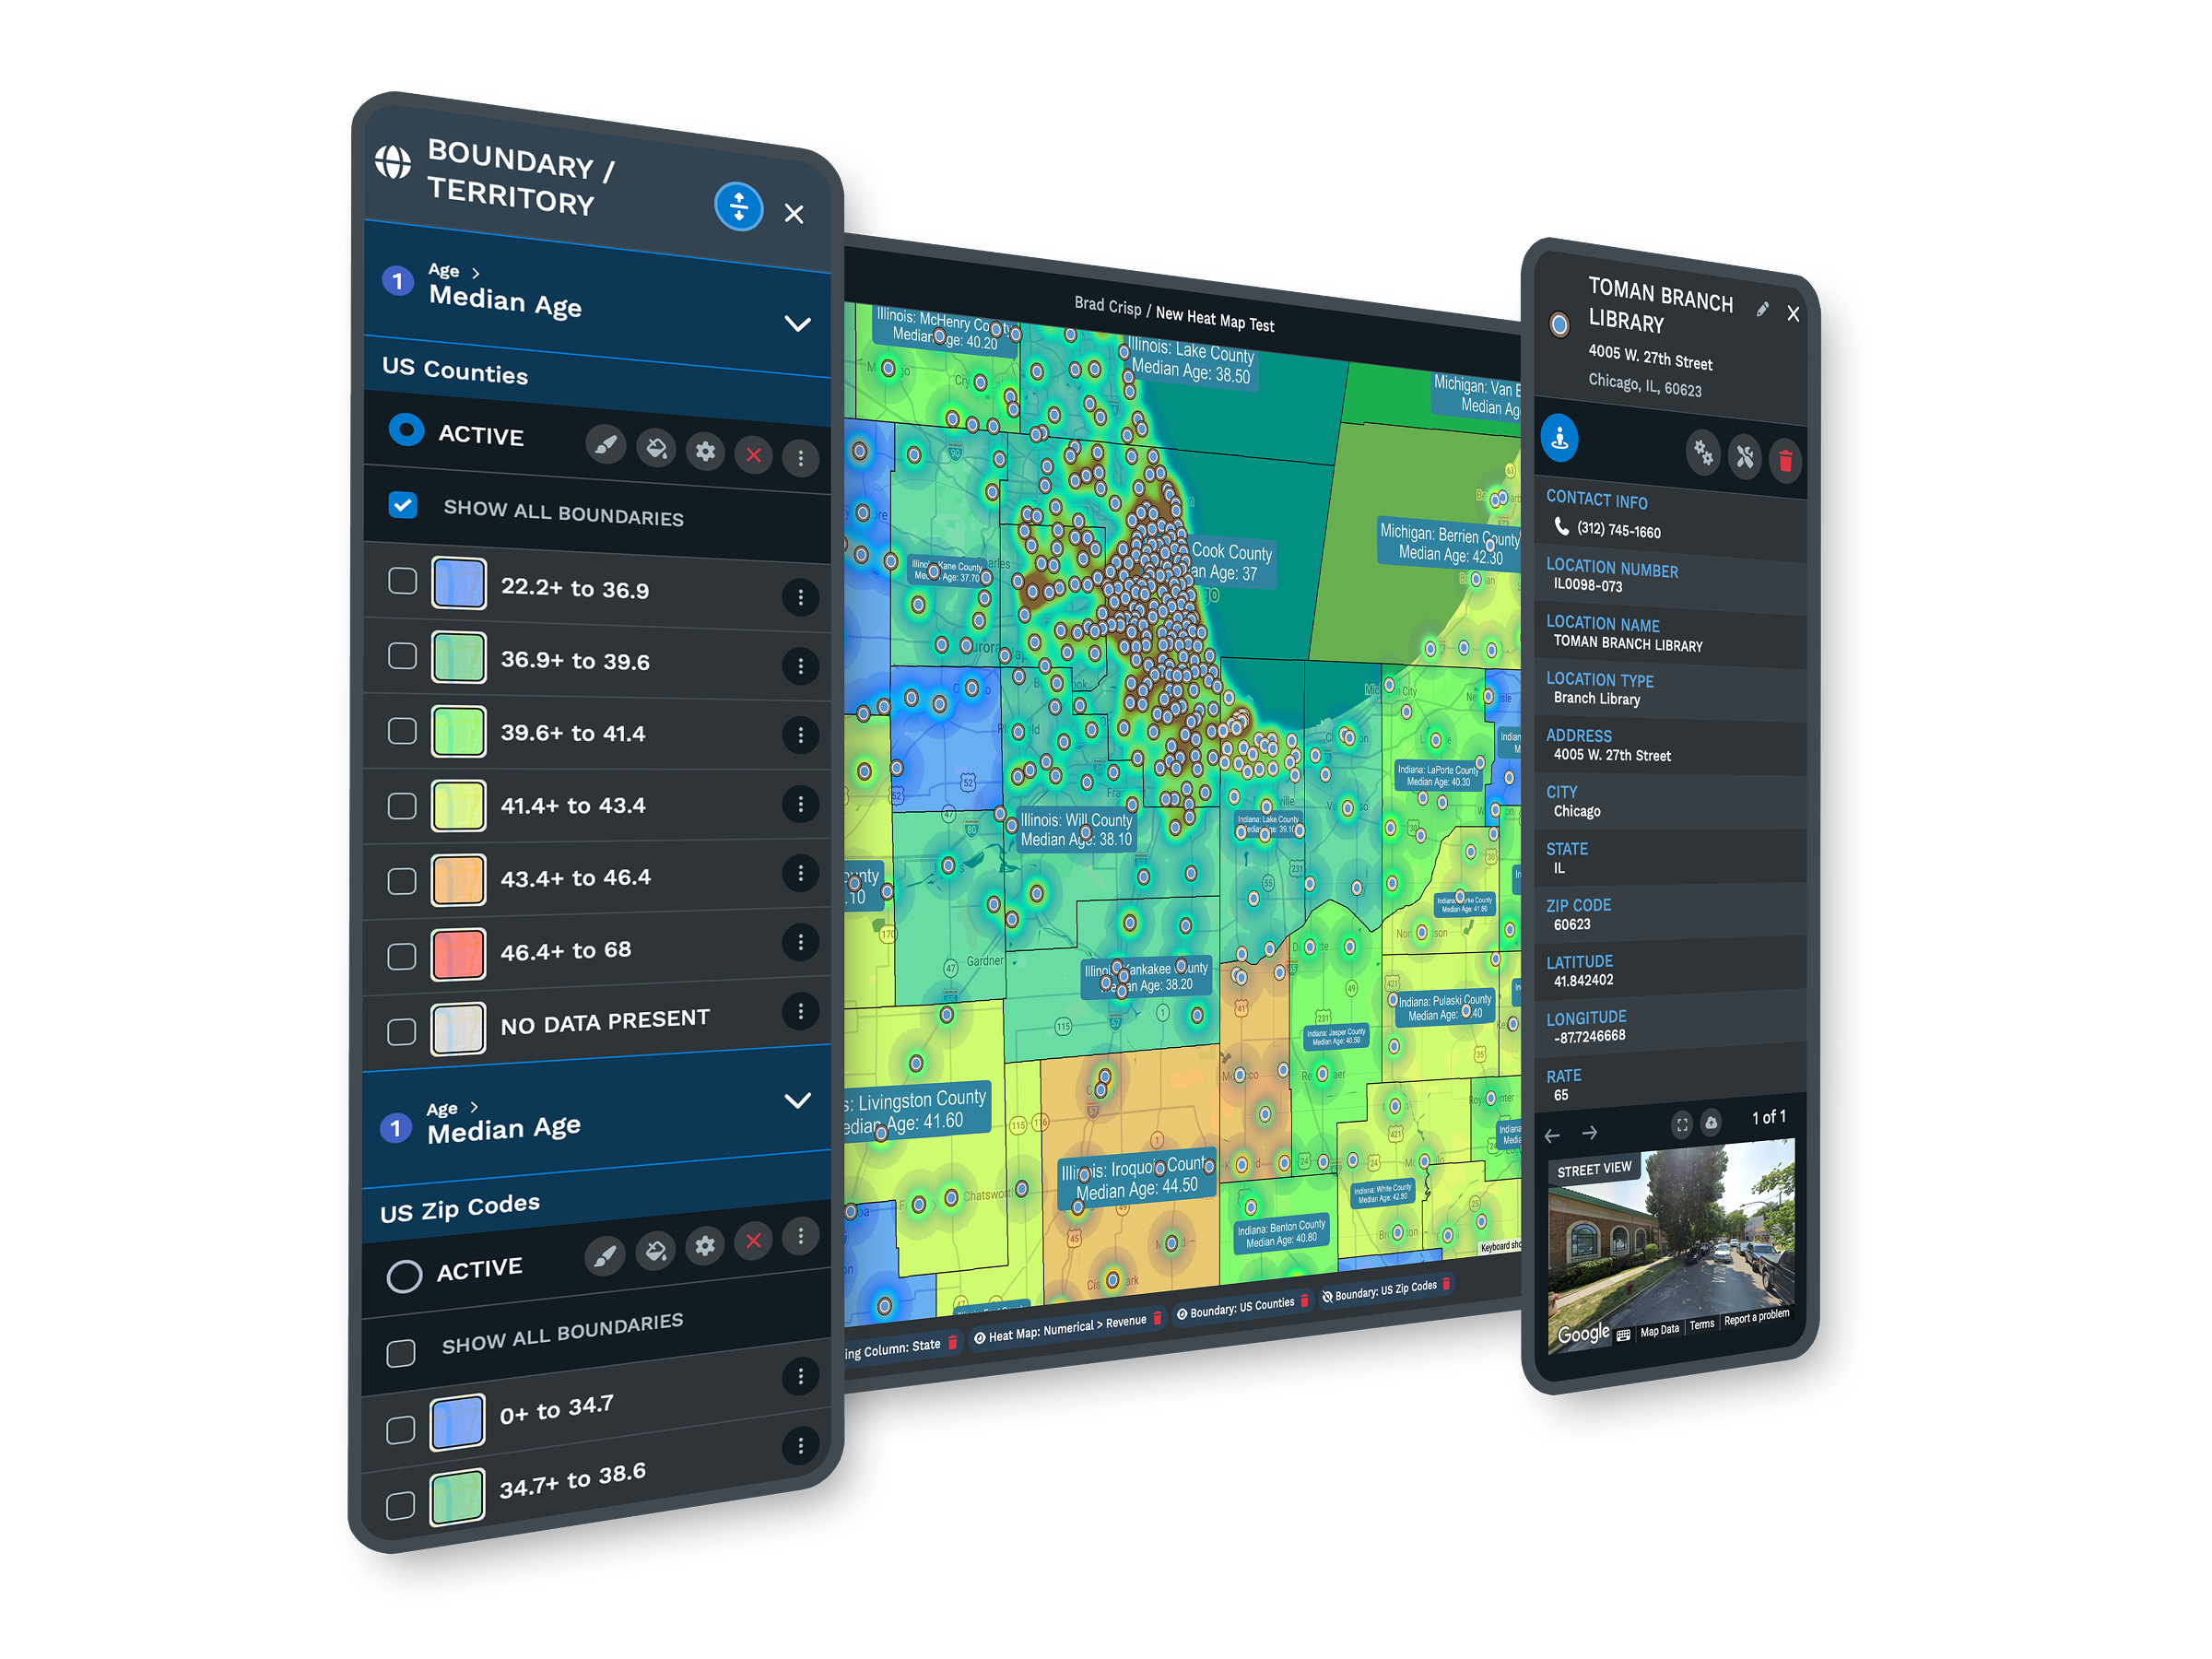
Income, density, age, and household detail at five geographic levels read each policy against its market.
Route optimization sequences a full day of claims visits on real road networks, with directions to a phone.
Mapping Risk, Coverage, and Response
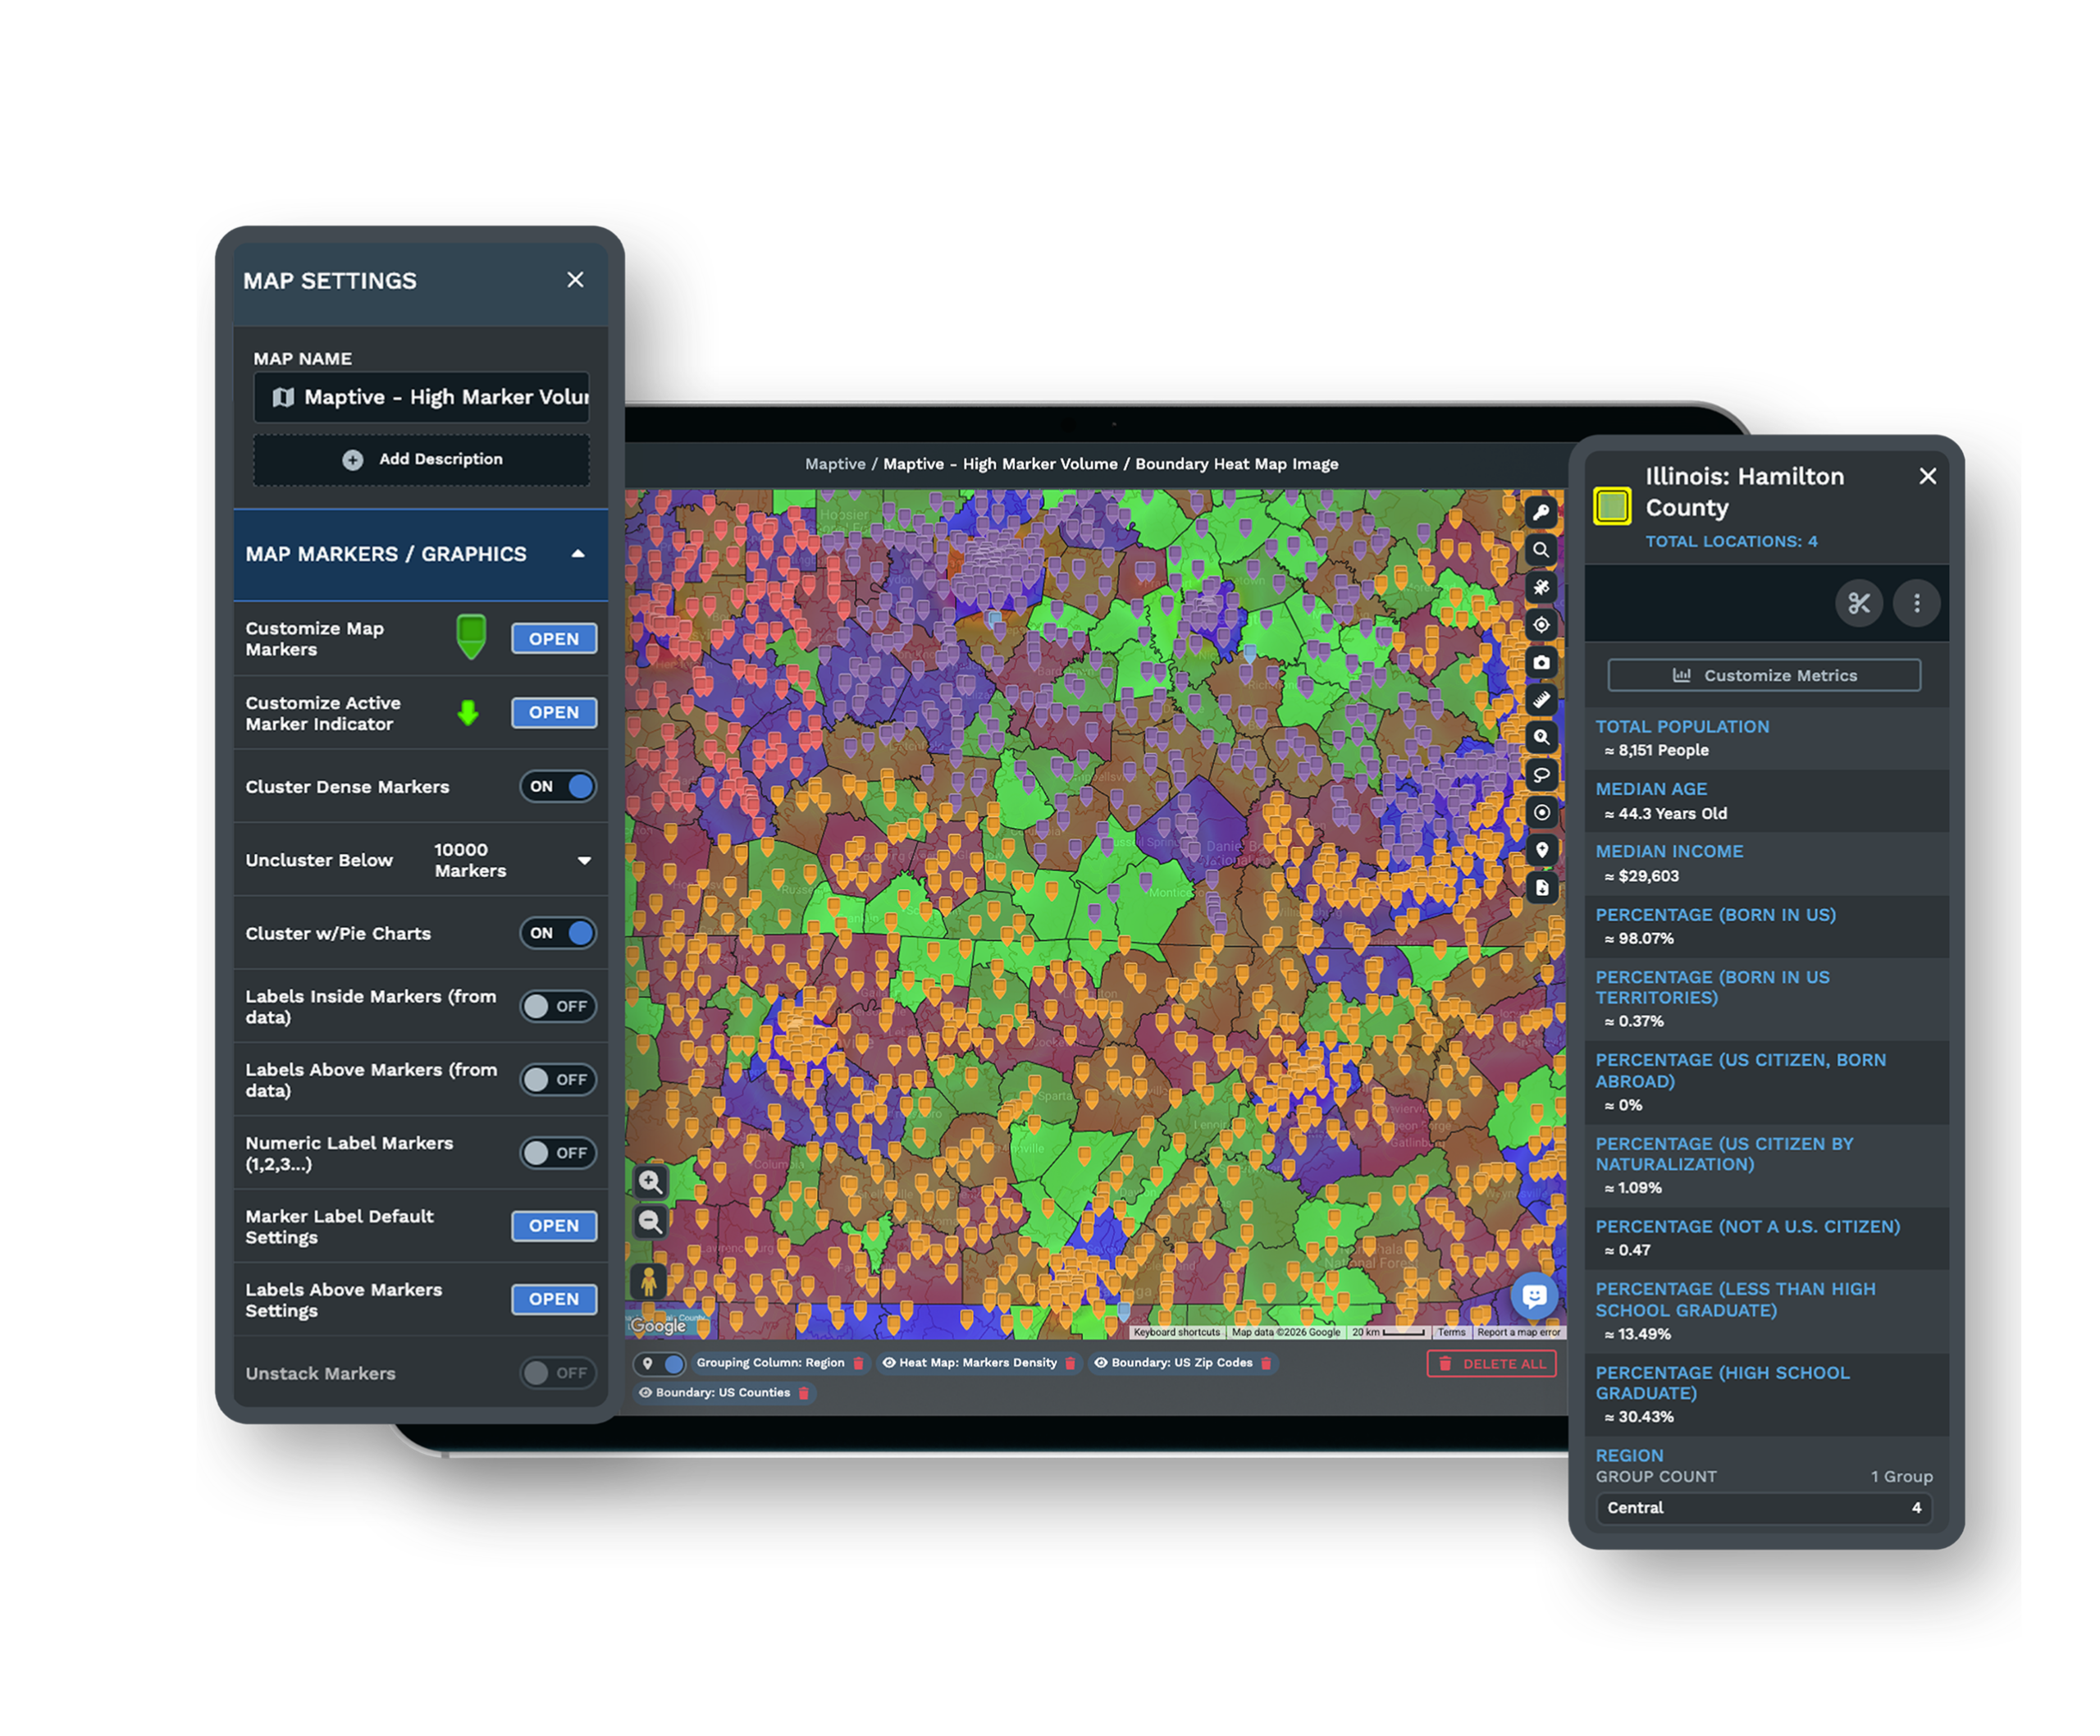
| 01 | Exposure Heat MapsWeight a heat map by policy count or insured value, and the accumulation hiding in a spreadsheet shows on the map. Tune radius and intensity until the concentration is plain. |
| 02 | Risk and Market Data LayersCensus demographics sit under every address, with a growing library of 650+ financial-services and market categories adding weather, climate, crime, and housing detail. Each policy reads against the risk around it. |
| 03 | Producer Territory BalancingThe optimizer builds even agent and producer territories from policy density, drive-time limits, and the fields you choose. A region that outgrows its agent gets rebalanced before service slips. |
| 04 | Adjuster Route OptimizationSequence up to 73 stops per route on real road networks after an event, with turn-by-turn directions exported to a phone. Field teams reach more policyholders in a day. |
| 05 | Controlled Map SharingShare a territory or exposure map through a password-protected link, showing only the tools and columns you choose. Leadership or an agency reviews it without platform access. |
Reading Risk and Coverage
Seeing Concentration Before a Claim
A book that looks balanced by premium can be heavily exposed by geography, with a large share of insured value sitting inside one flood plain, one wildfire corridor, or one stretch of coast. Plot the policies, weight the heat map by insured value, and overlay the weather and climate categories, and the accumulation appears in a form an underwriting committee can read at a glance. Grouping by ZIP, county, or tract quantifies the exposure in each zone, so the review rests on a map rather than a hunch.
Reaching Policyholders After an Event
After a major event, the constraint is rarely information but reach. Adjusters have to get to many addresses quickly, and the order of the stops decides how many policyholders are seen before the day ends. Maptive sequences those stops on real road networks, with directions exported to a phone, so the route follows the roads rather than a straight line. Because the routing runs on the same map as your book, you build adjuster routes directly from the claim clusters you see, turning where claims landed into a field plan in the same session.
Carriers and Agencies in Good Company
Financial Brands on Maptive
Capital One, UBS, and GM Financial run location work on the platform, each after its own security review. A regional agency and a national carrier use the same tools, with capacity to scale as the book grows.
How Policyholder Data Stays Protected
Maptive secures policyholder data with 256-bit SSL encryption, two-factor authentication, single sign-on, role-based access, and audit logging, with regional data-storage options and 99.9% uptime. It has passed the Salesforce AppExchange security review, and permissions can be set down to the individual user.
Support That Knows the Work
The US and Canada support team answers in under 15 minutes, with a 9.7 out of 10 rating, and helps you import your book and configure your first map. The specialists understand spatial analysis, so the help is specific rather than scripted.
Free trial, full platform, no credit card
Put Your Book on the Map
Begin a ten-day free trial with no credit card. Upload a policy or producer file, weight a heat map by insured value, and overlay the risk and demographic data that shape your exposure. Every tool is unlocked from the first login, so you can read your real book before any budget conversation begins.
Review Your Book With Our Team
For carriers and agencies that evaluate tools through a formal process, a Maptive specialist will plot a sample of your book and run the exposure, territory, and routing tools on it. This suits underwriting, distribution, and claims teams comparing platforms. Bring your questions on data handling and security, and the session works through your real scenario.
Frequently Asked Questions
What is insurance mapping software?
Insurance mapping software plots a book of business geographically and adds the data needed to read risk and coverage. Maptive maps your policies, agents, and the risk around each address, so you can see where exposure concentrates, balance producer territories, and route adjusters after an event. Underwriting, distribution, and claims teams use it to turn a policy spreadsheet into a map that shows accumulation and coverage gaps, all from an upload rather than a GIS project.
What is risk concentration, and why map it?
Risk concentration, sometimes called accumulation, is the buildup of insured value in a single area, where one event could trigger many claims at once. A premium report will not reveal it, because premium says nothing about geography. Mapping does. Maptive lets you weight a heat map by insured value and overlay hazard data, so a cluster of policies inside one flood plain or wildfire corridor becomes visible. Seeing accumulation early lets underwriting manage it before a storm tests it.
How does Maptive help manage geographic risk concentration?
You upload your policy file, and Maptive plots every address, then builds a heat map weighted by policy count or insured value. Overlay the weather, climate, crime, and housing categories, and the map shows where exposure piles up against real hazards. You can group results by ZIP, county, or tract to quantify accumulation in each zone. That view supports decisions on where to slow writing, where to seek reinsurance, and where the book has room, all from the same map.
How does mapping support property underwriting?
Underwriting a property is partly about the building and partly about where it sits. Maptive puts the location in context. Census demographics sit under the address, hazard categories like weather and crime around it, and the rest of your book nearby to show accumulation. An underwriter can see if a risk adds to an already concentrated zone or sits in open territory. That geographic context, available in seconds, sharpens a decision that a data sheet alone leaves incomplete.
Can Maptive balance agent and producer territories?
Yes. The automated optimizer builds even agent and producer territories from policy density, drive-time limits, and the data fields you choose, then rebalances when a region outgrows its agent. You weight the factors that define a fair territory, preview the split before publishing, and adjust any boundary by hand. Demographic overlays also show where your target customer profile concentrates, so territory planning lines up with where the demand sits rather than with historical assignments alone.
Can Maptive route adjusters after a catastrophe?
Yes. When claims spike in one area, route optimization sequences up to 73 stops per route on real road networks and exports turn-by-turn directions to a phone. Field teams reach more policyholders in a day and cut the miles between stops. Because the routing runs on the same map as your book, you build adjuster routes directly from the claim clusters you see, turning where claims landed into a field plan in the same session.
What risk and market data can I layer on the map?
Maptive includes more than 50 US Census variables down to the block-group level, covering income, density, age, and household composition, on every plan. A growing library of market and risk categories adds weather and climate, crime, housing, and net worth alongside the census data. You also map your own policy and claims data on top. Together, that lets you read each policy against the hazard and market profile around it rather than treating every address as the same risk.
How current and granular is the demographic data?
The census demographics come from official US and Canadian government sources and are refreshed on a regular schedule, so the figures you map show current published data. You can work at state, county, ZIP, census-tract, or block-group level, which means accumulation and market analysis can be as broad as a region or as fine as a neighborhood. Because the data lives on the platform, every analysis and every shared map pulls the current figures automatically.
How is policyholder data secured in Maptive?
Maptive secures policyholder data with 256-bit SSL encryption in transit and at rest, two-factor authentication, single sign-on, role-based access controls, and audit logging, with regional data-storage options and 99.9% uptime. It has passed the Salesforce AppExchange security review, and enterprises with strict requirements, including Capital One and UBS, run on it. Permissions can be set per user, so each person sees only the part of the book they should, and administrators retain a full audit trail.
Do I need GIS skills to use Maptive?
No. Maptive is built for insurance operations, underwriting, and distribution teams, not GIS specialists. You upload a policy or producer spreadsheet, the platform geocodes it, and the heat-map, territory, and routing tools work through a plain interface. Most users produce a usable exposure or territory map in their first session, and the support team helps with the initial setup. The point is to put risk and coverage analysis in the hands of the people who own those decisions.

