Create a Zip Code Map
Turn your spreadsheet into a zip code map in minutes. Fill each zip code by your own numbers or census data, shade them into a heat map, or group them into sales territories, then share the result with a link.
No credit card required
- Fill zip codes by your data
- Zip code heat maps
- Territories from zip codes
- Census data by zip code
- Color zips from marker data
- Share, embed & export
Trusted by teams at


What Our Customers Say About Us
See what others have to say about Maptive.
What You Can Do With a Zip Code Map in Maptive
You start with the spreadsheet you already keep, and Maptive turns each zip code into a shape you can fill, shade, and group, with no GIS background needed.
| 01 |
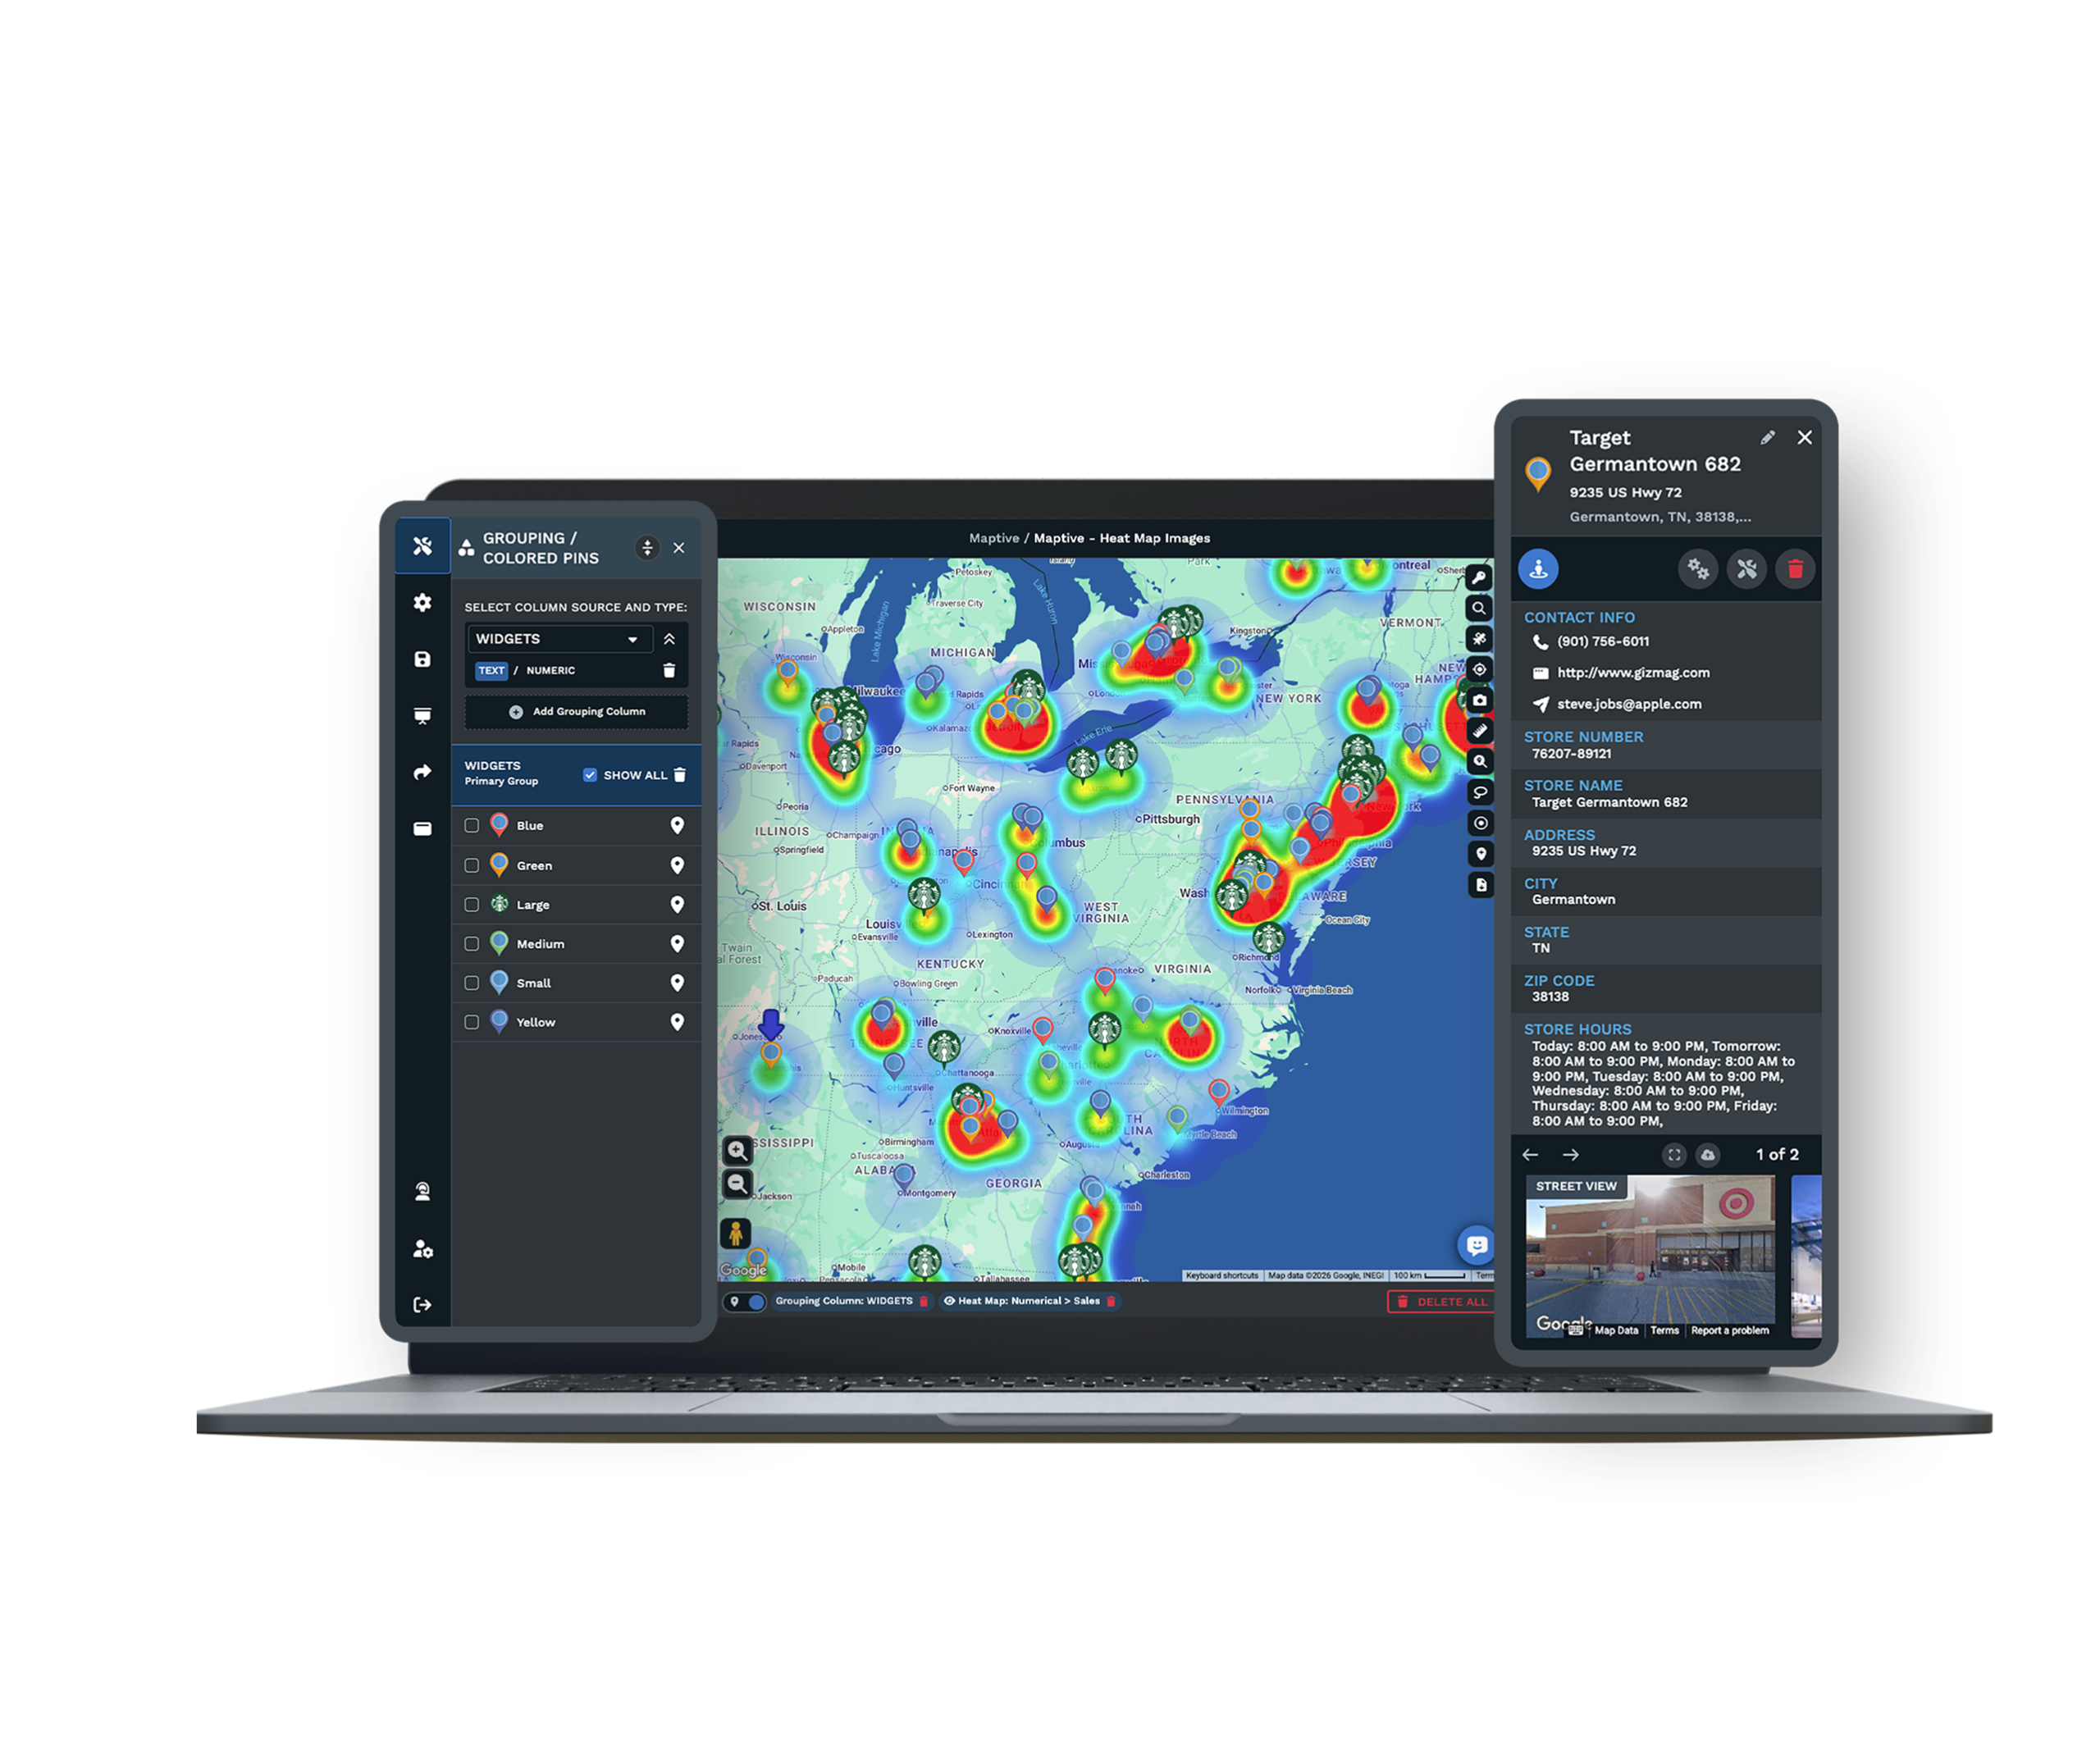
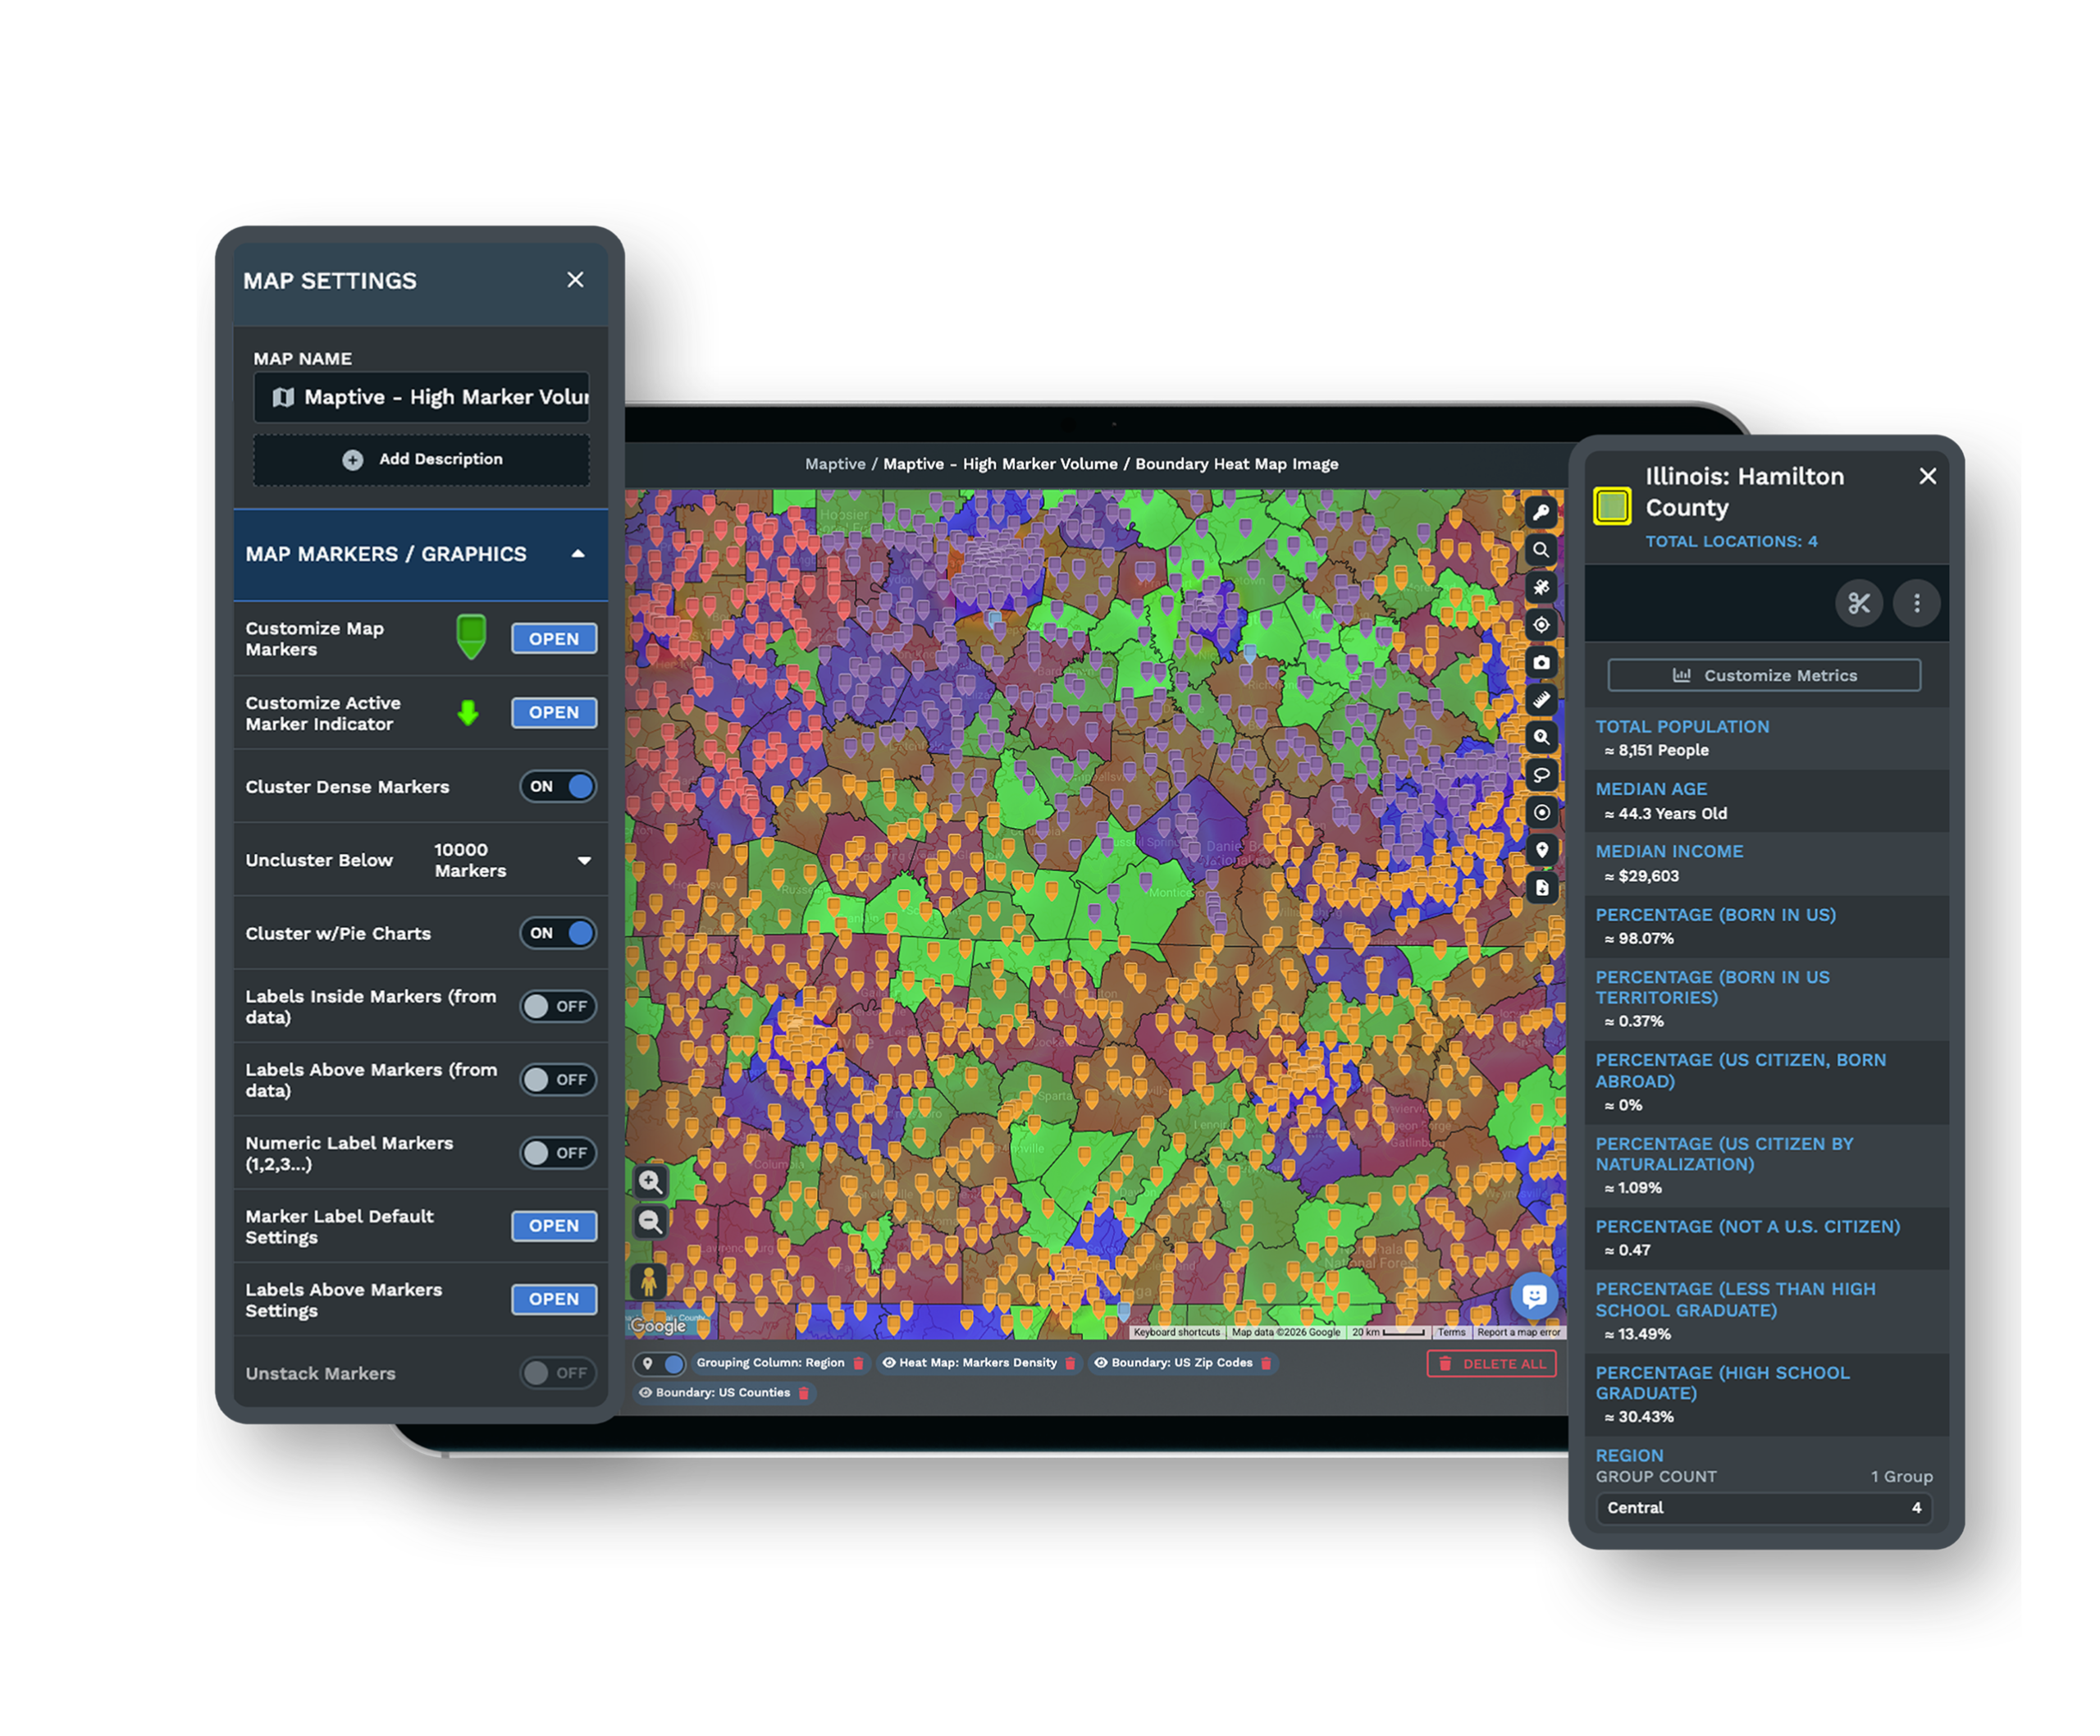
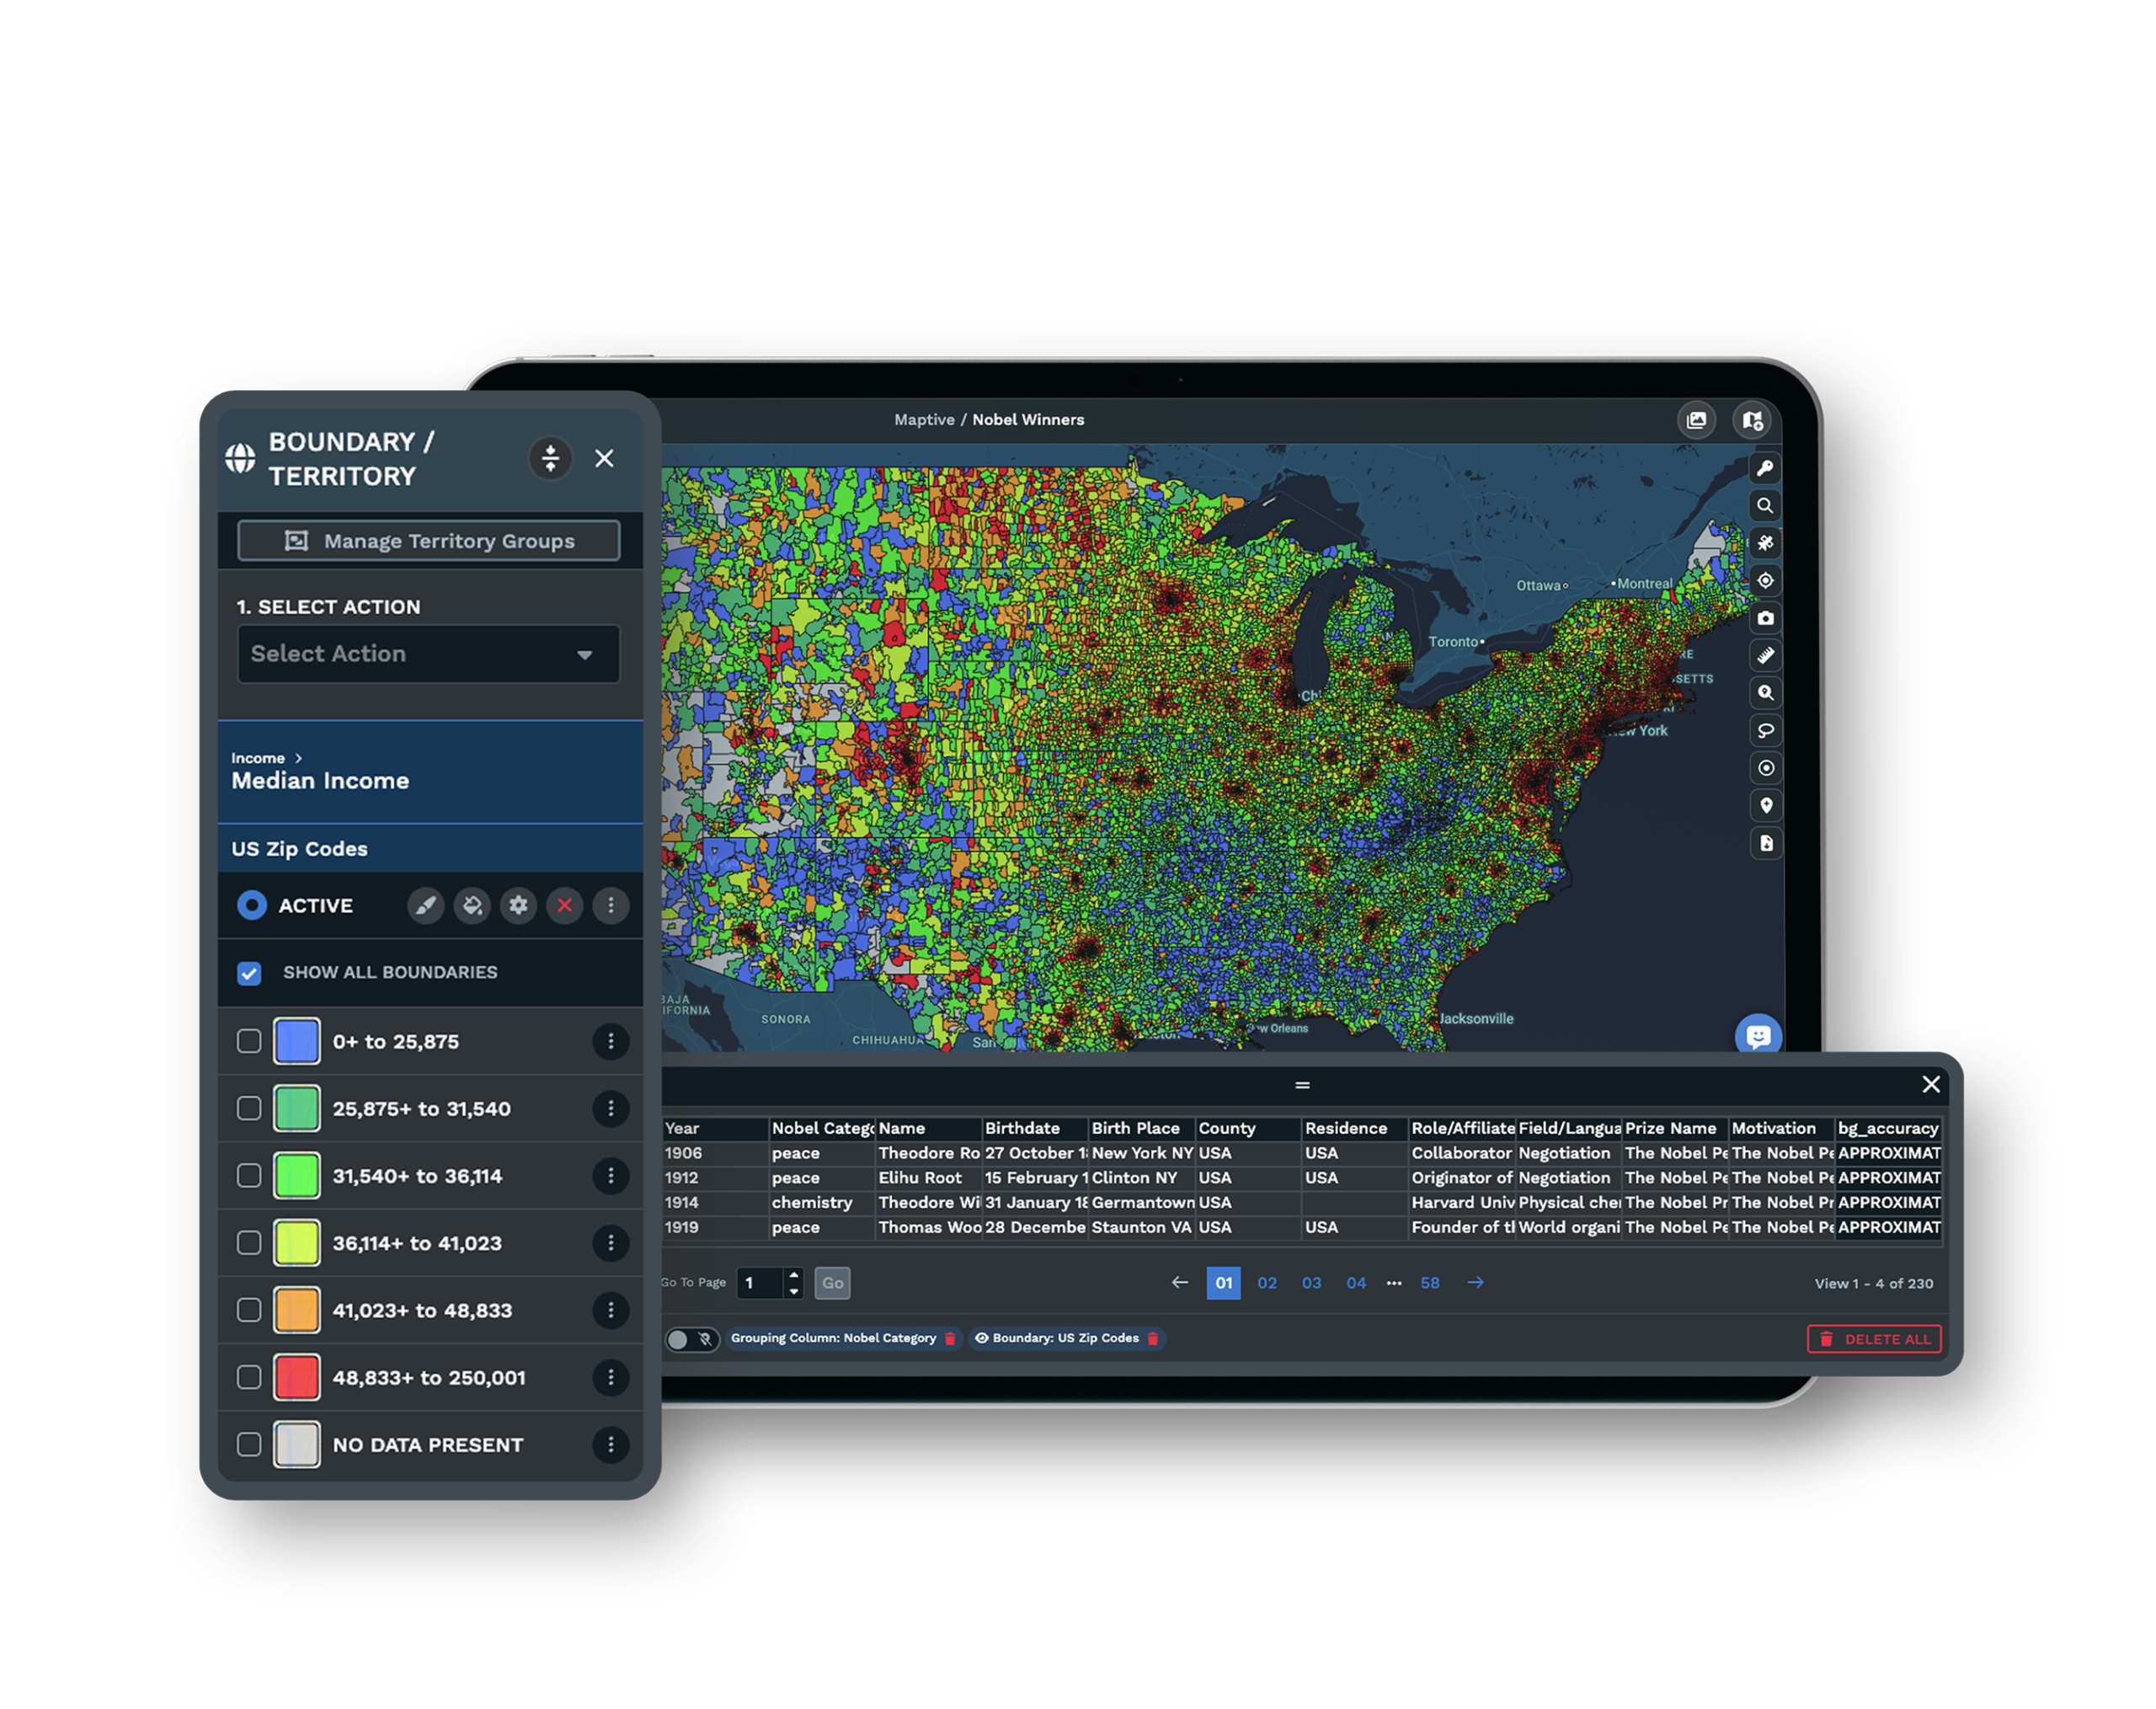
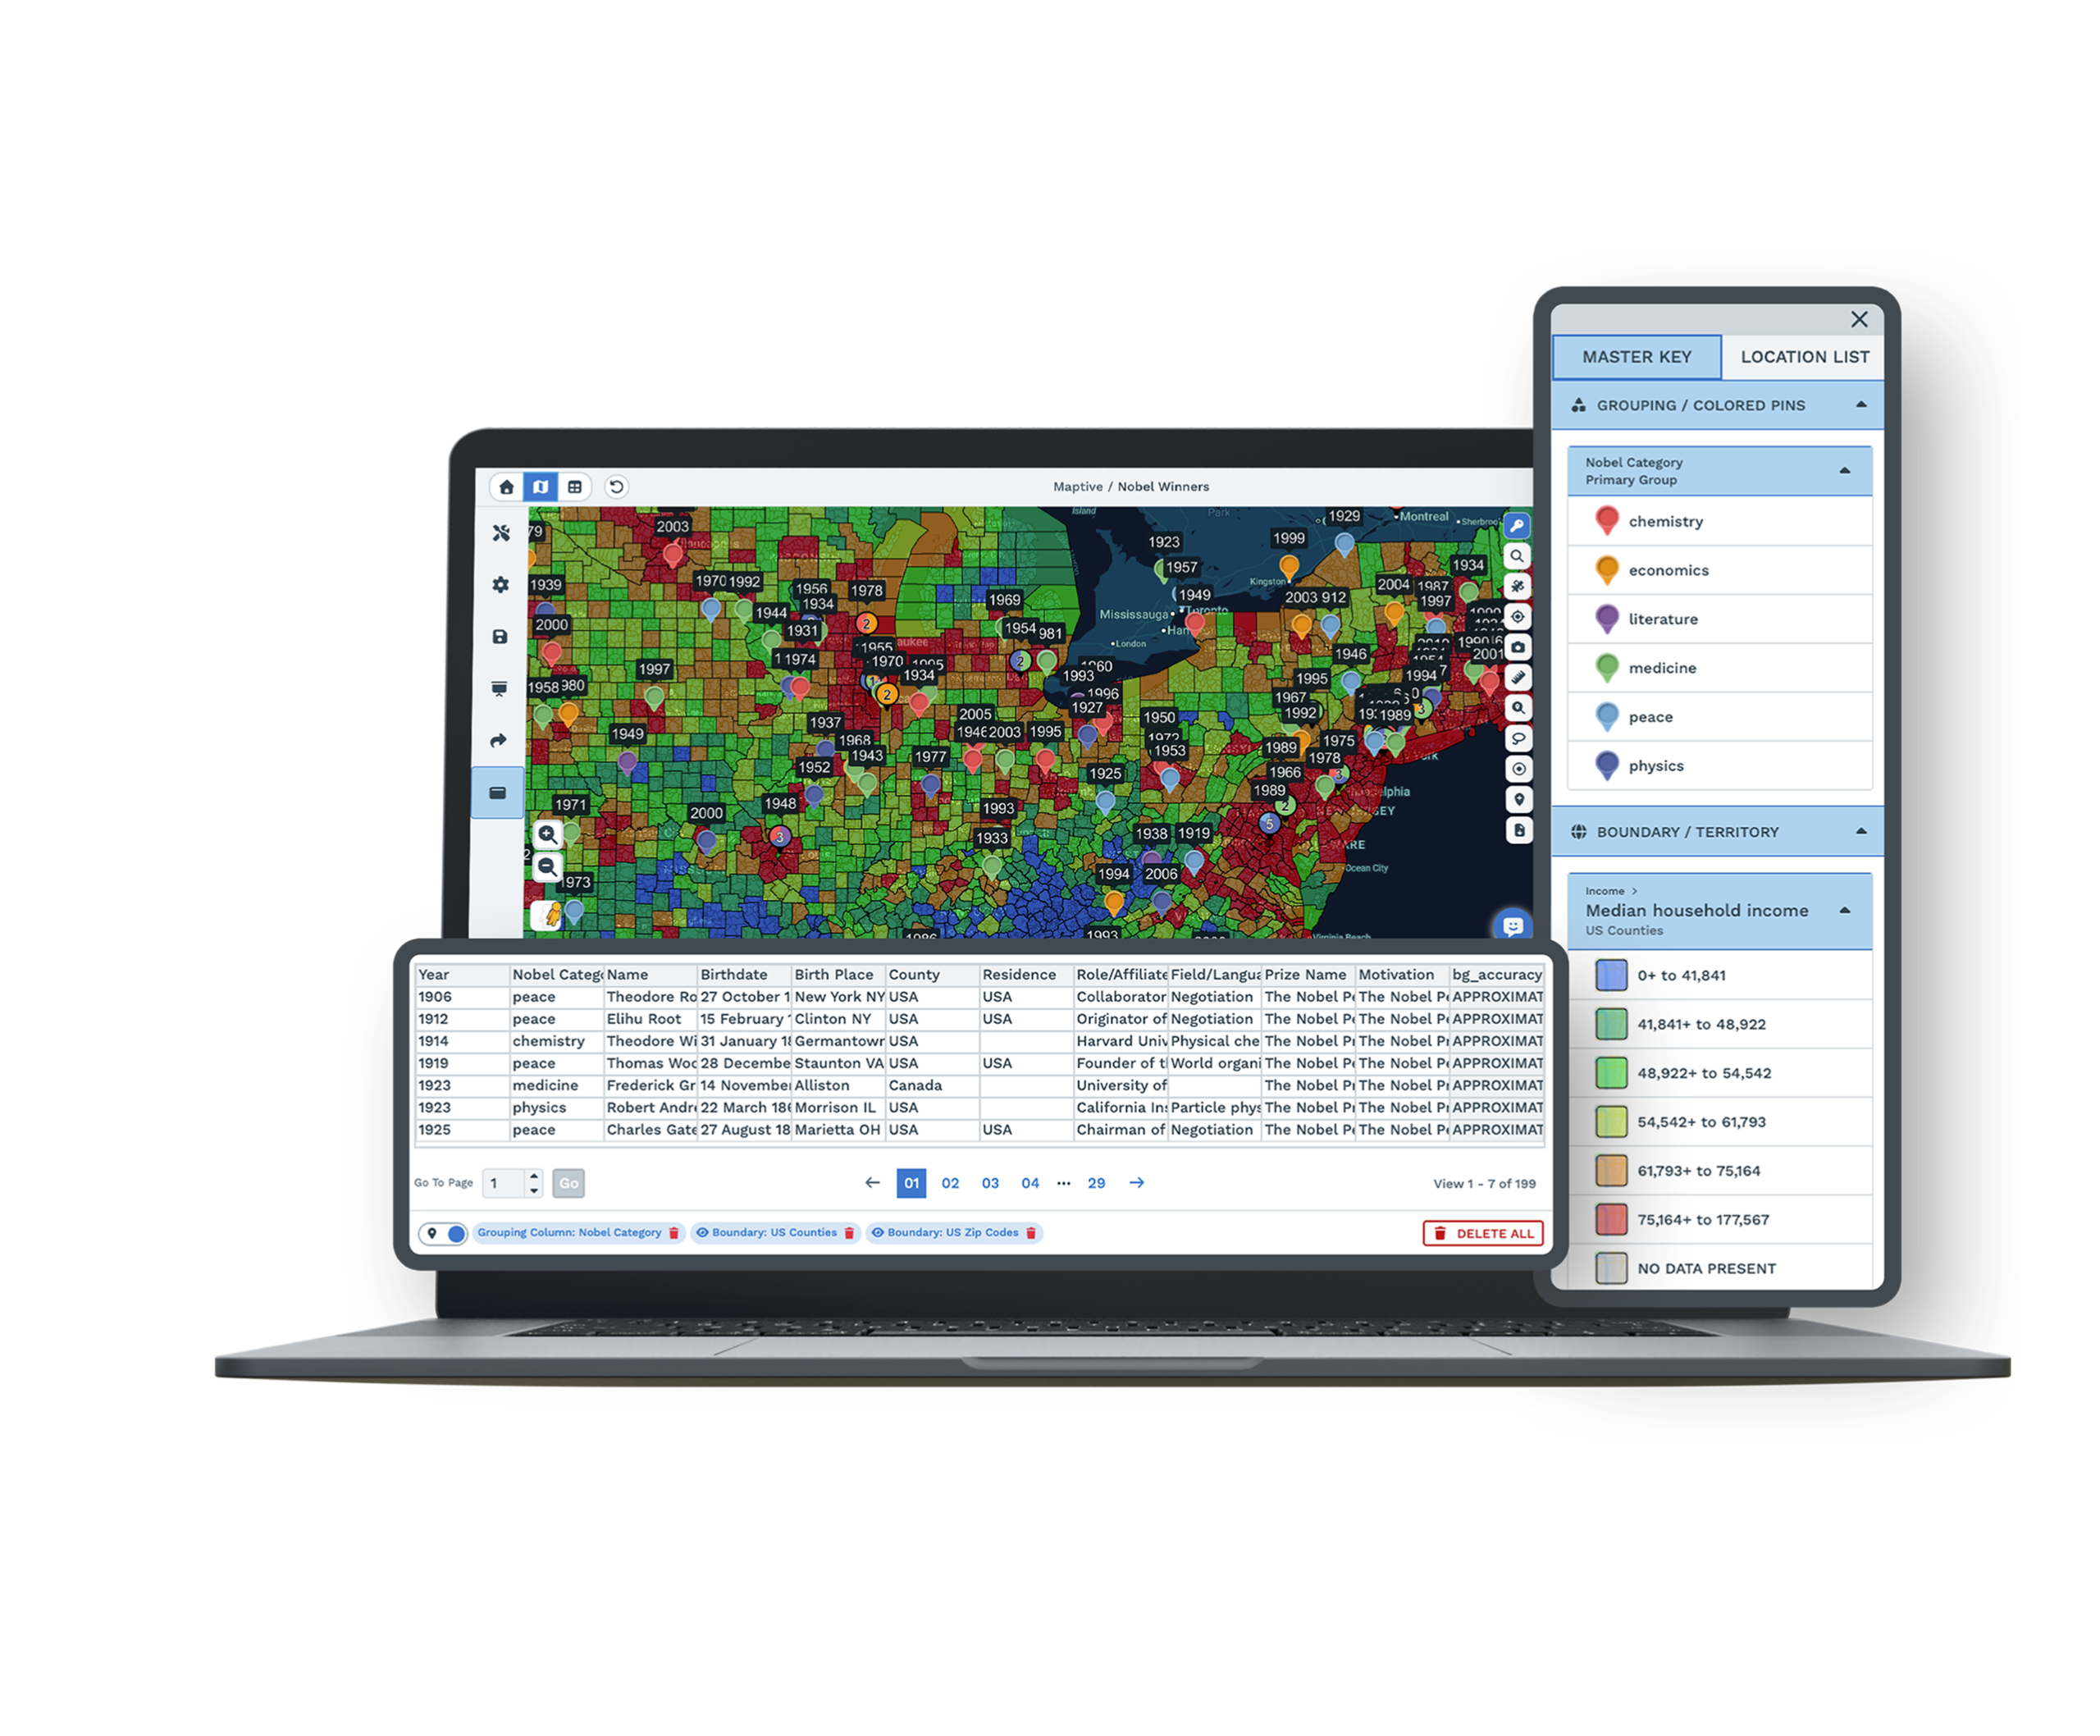
Fill Zip Codes by Your DataYou can fill US zip code boundaries by your own numbers, a marker count, your group or territory data, or census data, and Maptive builds a color key for you so the value behind each zip code is easy to read. |
| 02 |
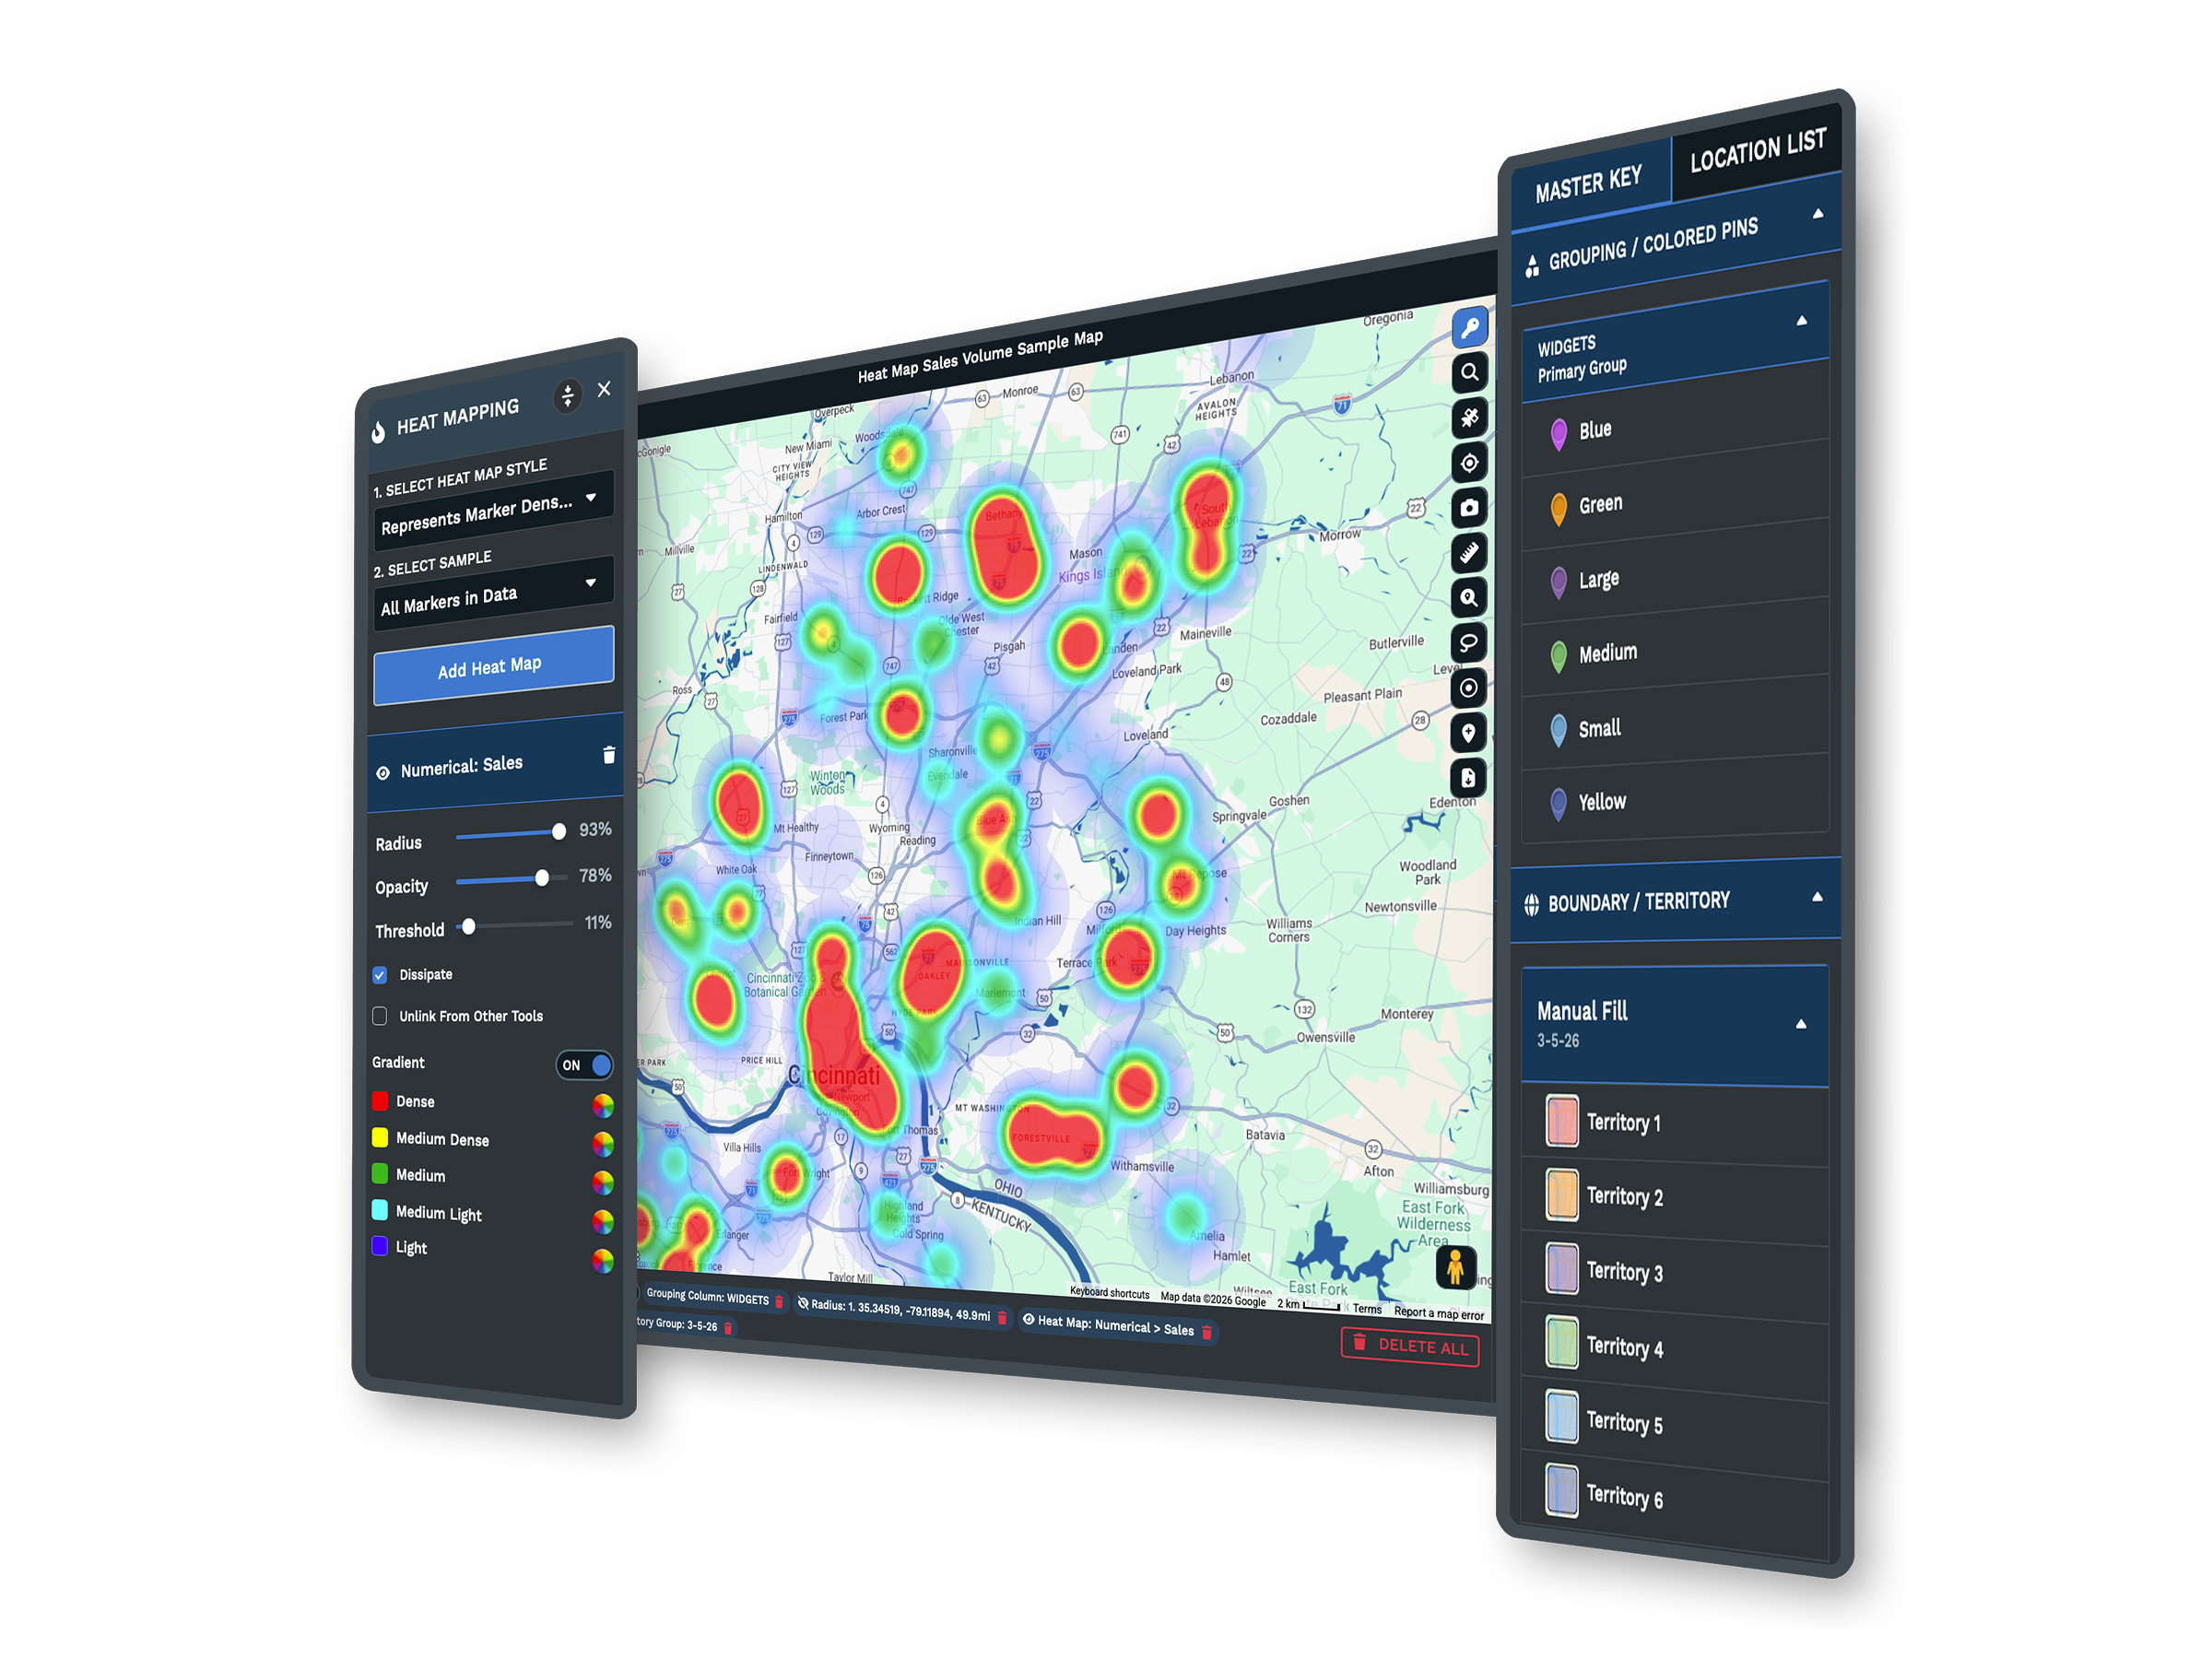
Zip Code Heat MapsYou can shade zip codes into a heat map that shows density or a numeric value across a region, so the areas with the most sales, customers, or demand stand out at a glance instead of hiding in rows of a spreadsheet. |
| 03 |
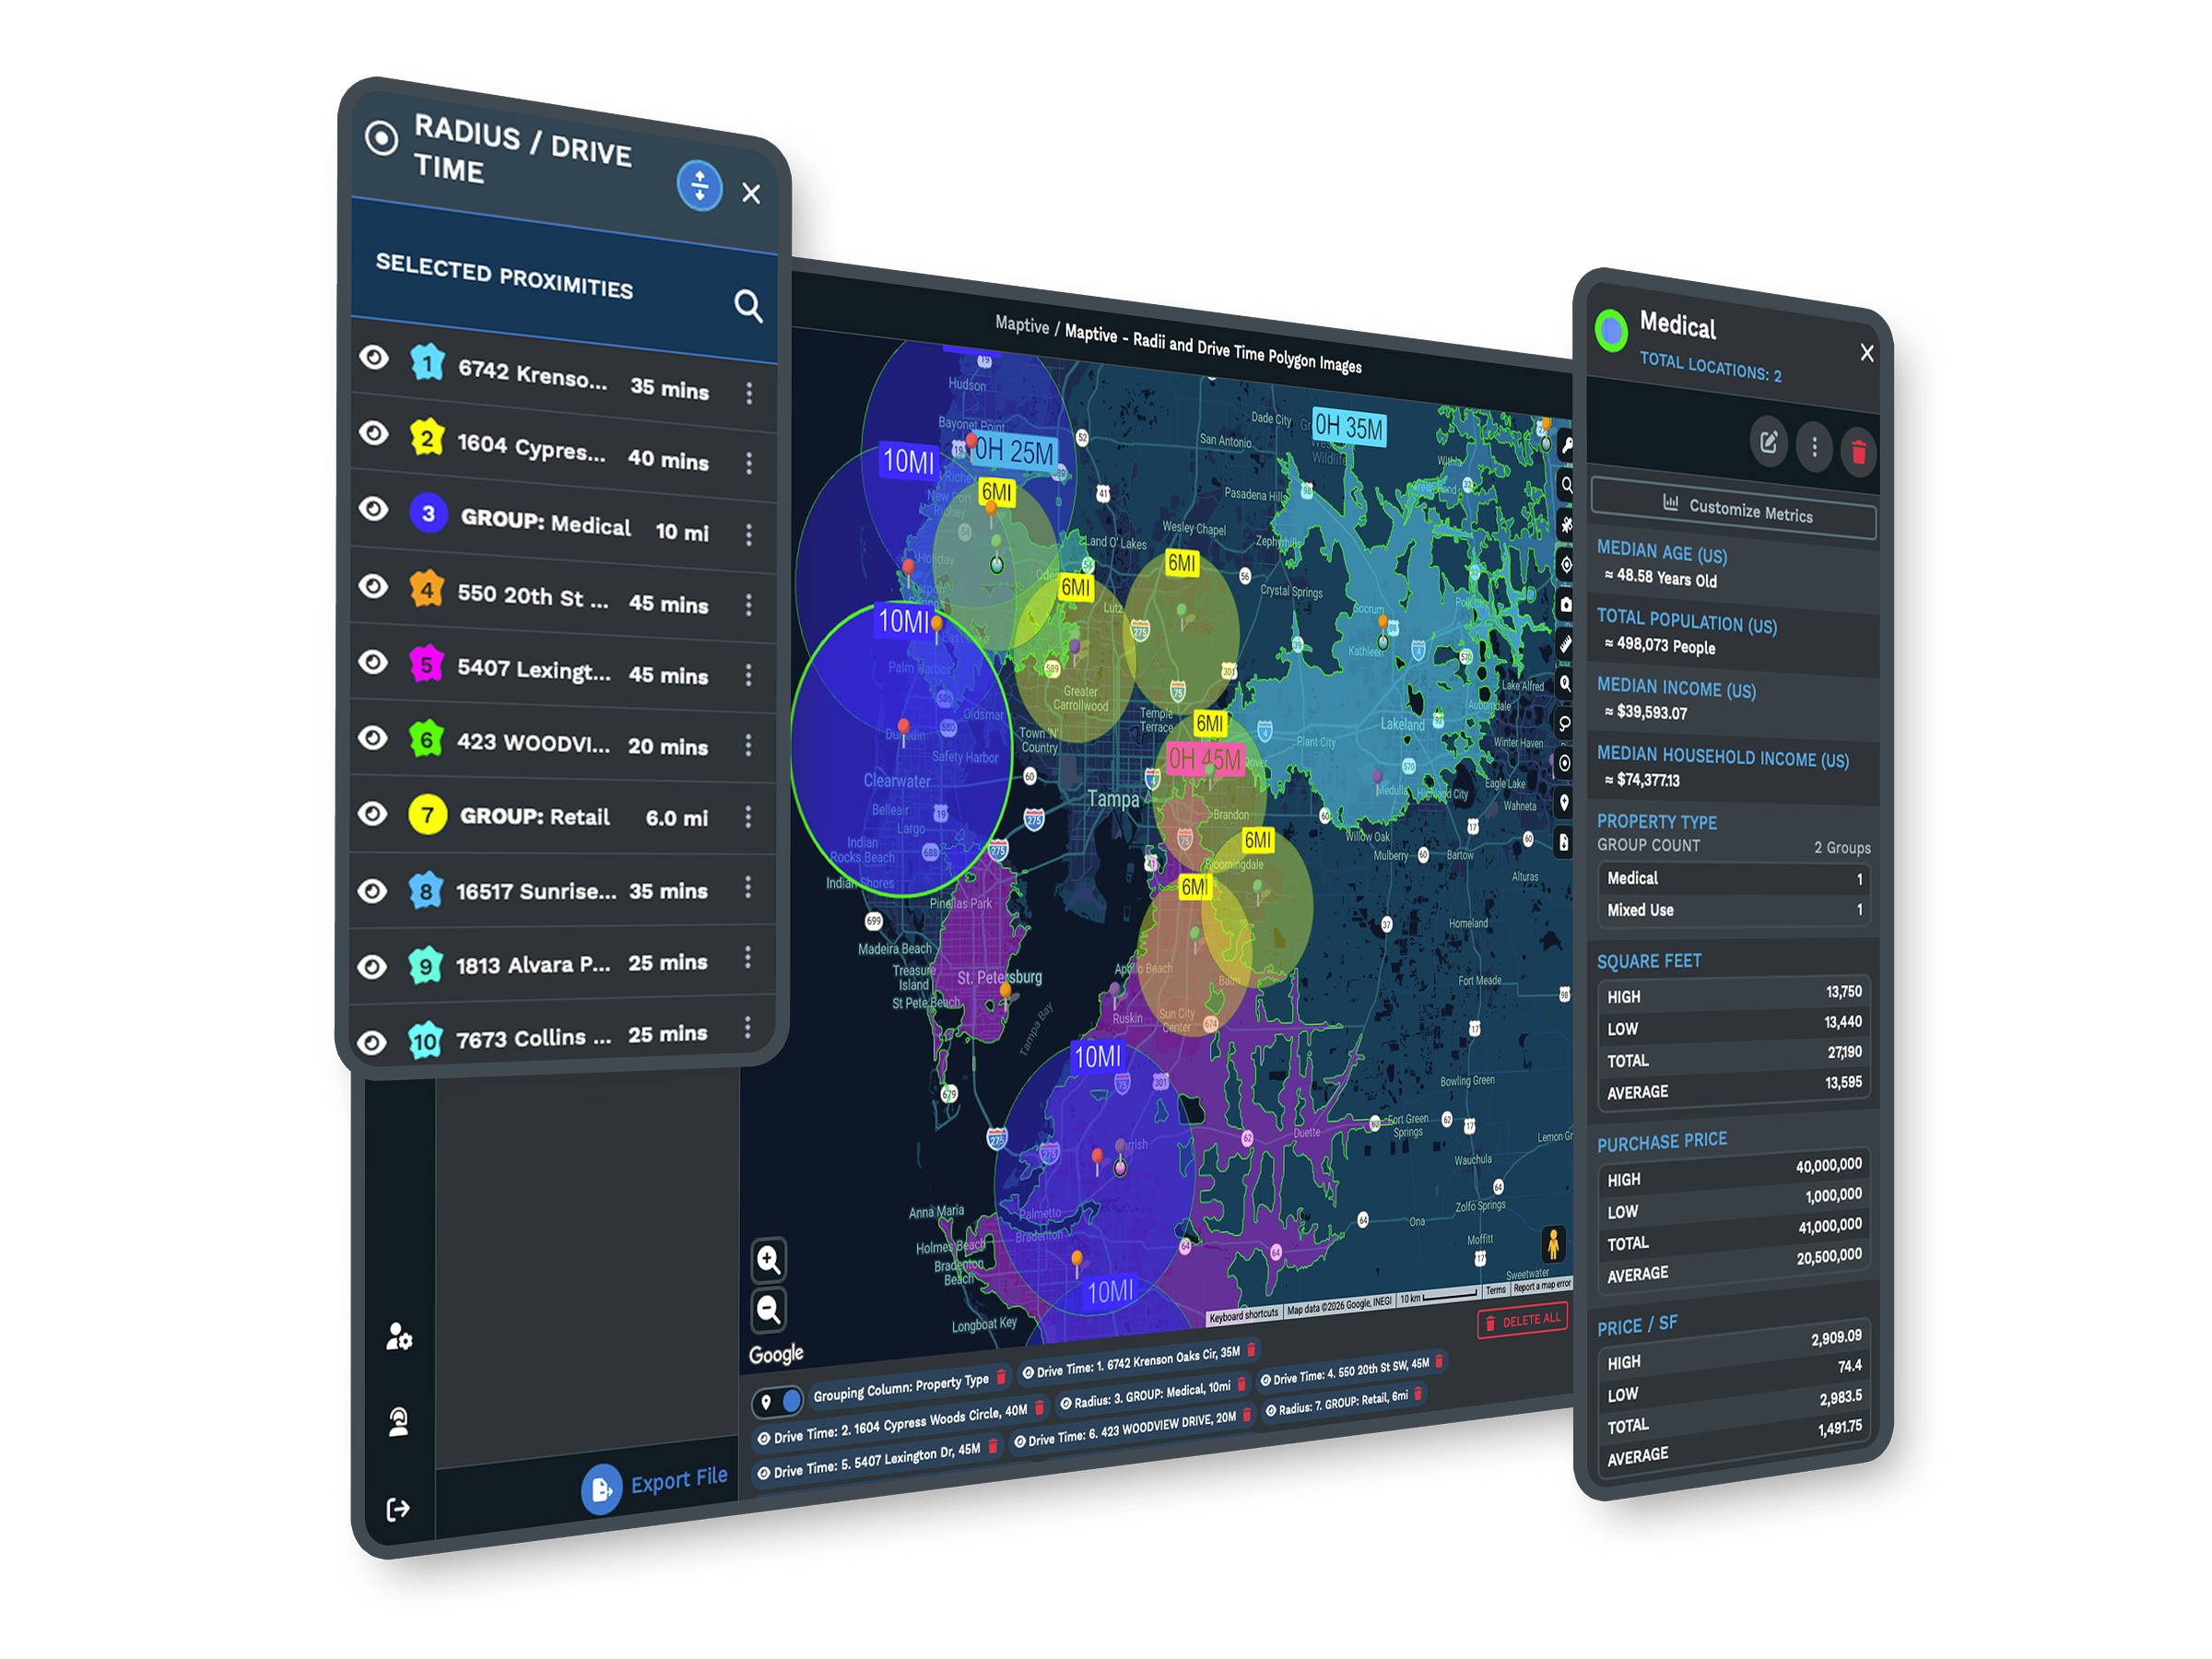
Demographics by Zip CodeCensus data for the US and Canada sits inside Maptive, so you can read population, income, and age right in a zip code popup, across a territory, or behind a boundary fill, with nothing extra to download. |
| 04 |
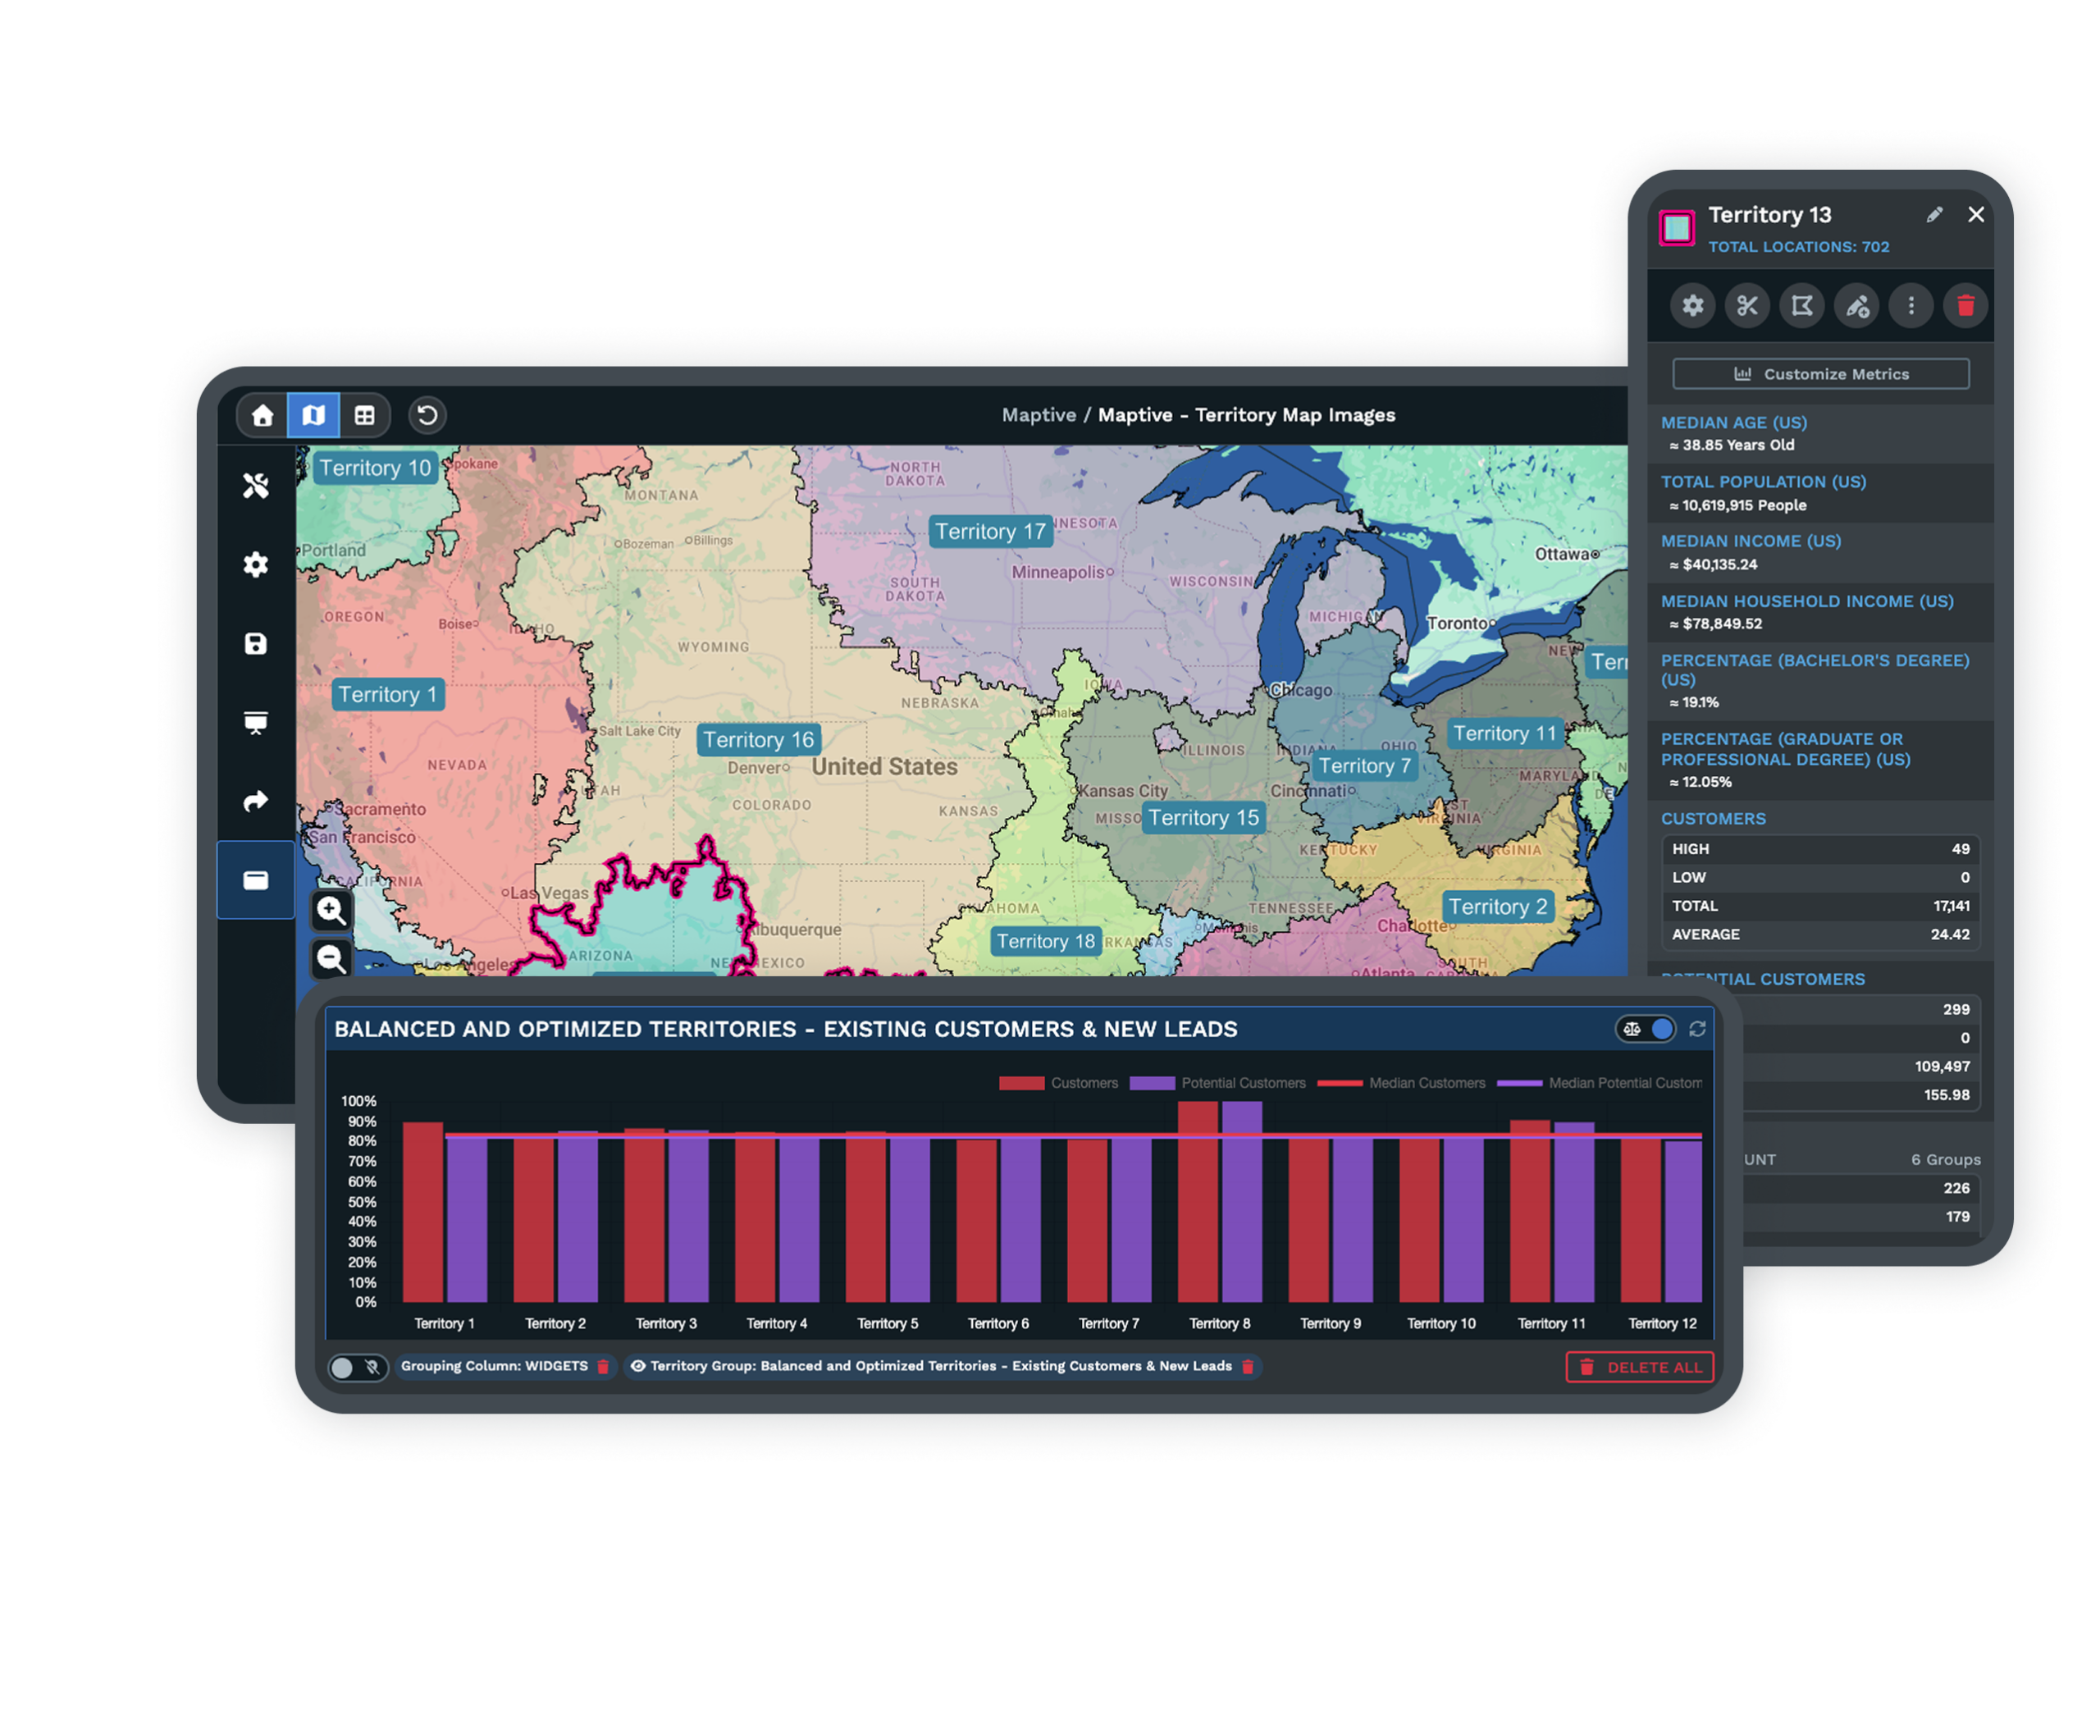
Territories From Zip CodesYou can group zip codes into sales territories and adjust them as you go. The boundary and territory tools work together, so you can build from zip codes or draw a custom area by hand when a region sits outside the usual lines. |
| 05 |
Color Zips From MarkersYou can color zip codes from your marker data, matching them by a text field in your file or by where each marker falls. You can also stack more than one fill on the same zip codes and switch the active one as you work. |
From a Spreadsheet to a Zip Code Map
Your zip codes are probably sitting in a spreadsheet already, next to the numbers you care about. You can bring that file straight into Maptive, point it at the column that holds your zip codes, and choose the value you want each one filled by.
Maptive matches your zip codes to US boundaries and shades each one by your data, with a color key built for you. If you would rather work from the markers on your map, you can color zip codes from that data instead, matching by a text field or by where each marker falls.
Read the Market Inside Every Zip
A filled zip code map tells you where your own numbers land. Adding the people behind those zip codes tells you why. Maptive carries census data for the US and Canada, so you can place population, income, and age over your zip codes and see the market each one holds.
This is the part site selection, marketing, and logistics teams lean on. You can find the zip codes that match the customers you want, judge whether an area can support a new site, and shape your map around the people who actually live there.
Shade Zips Into a Heat Map
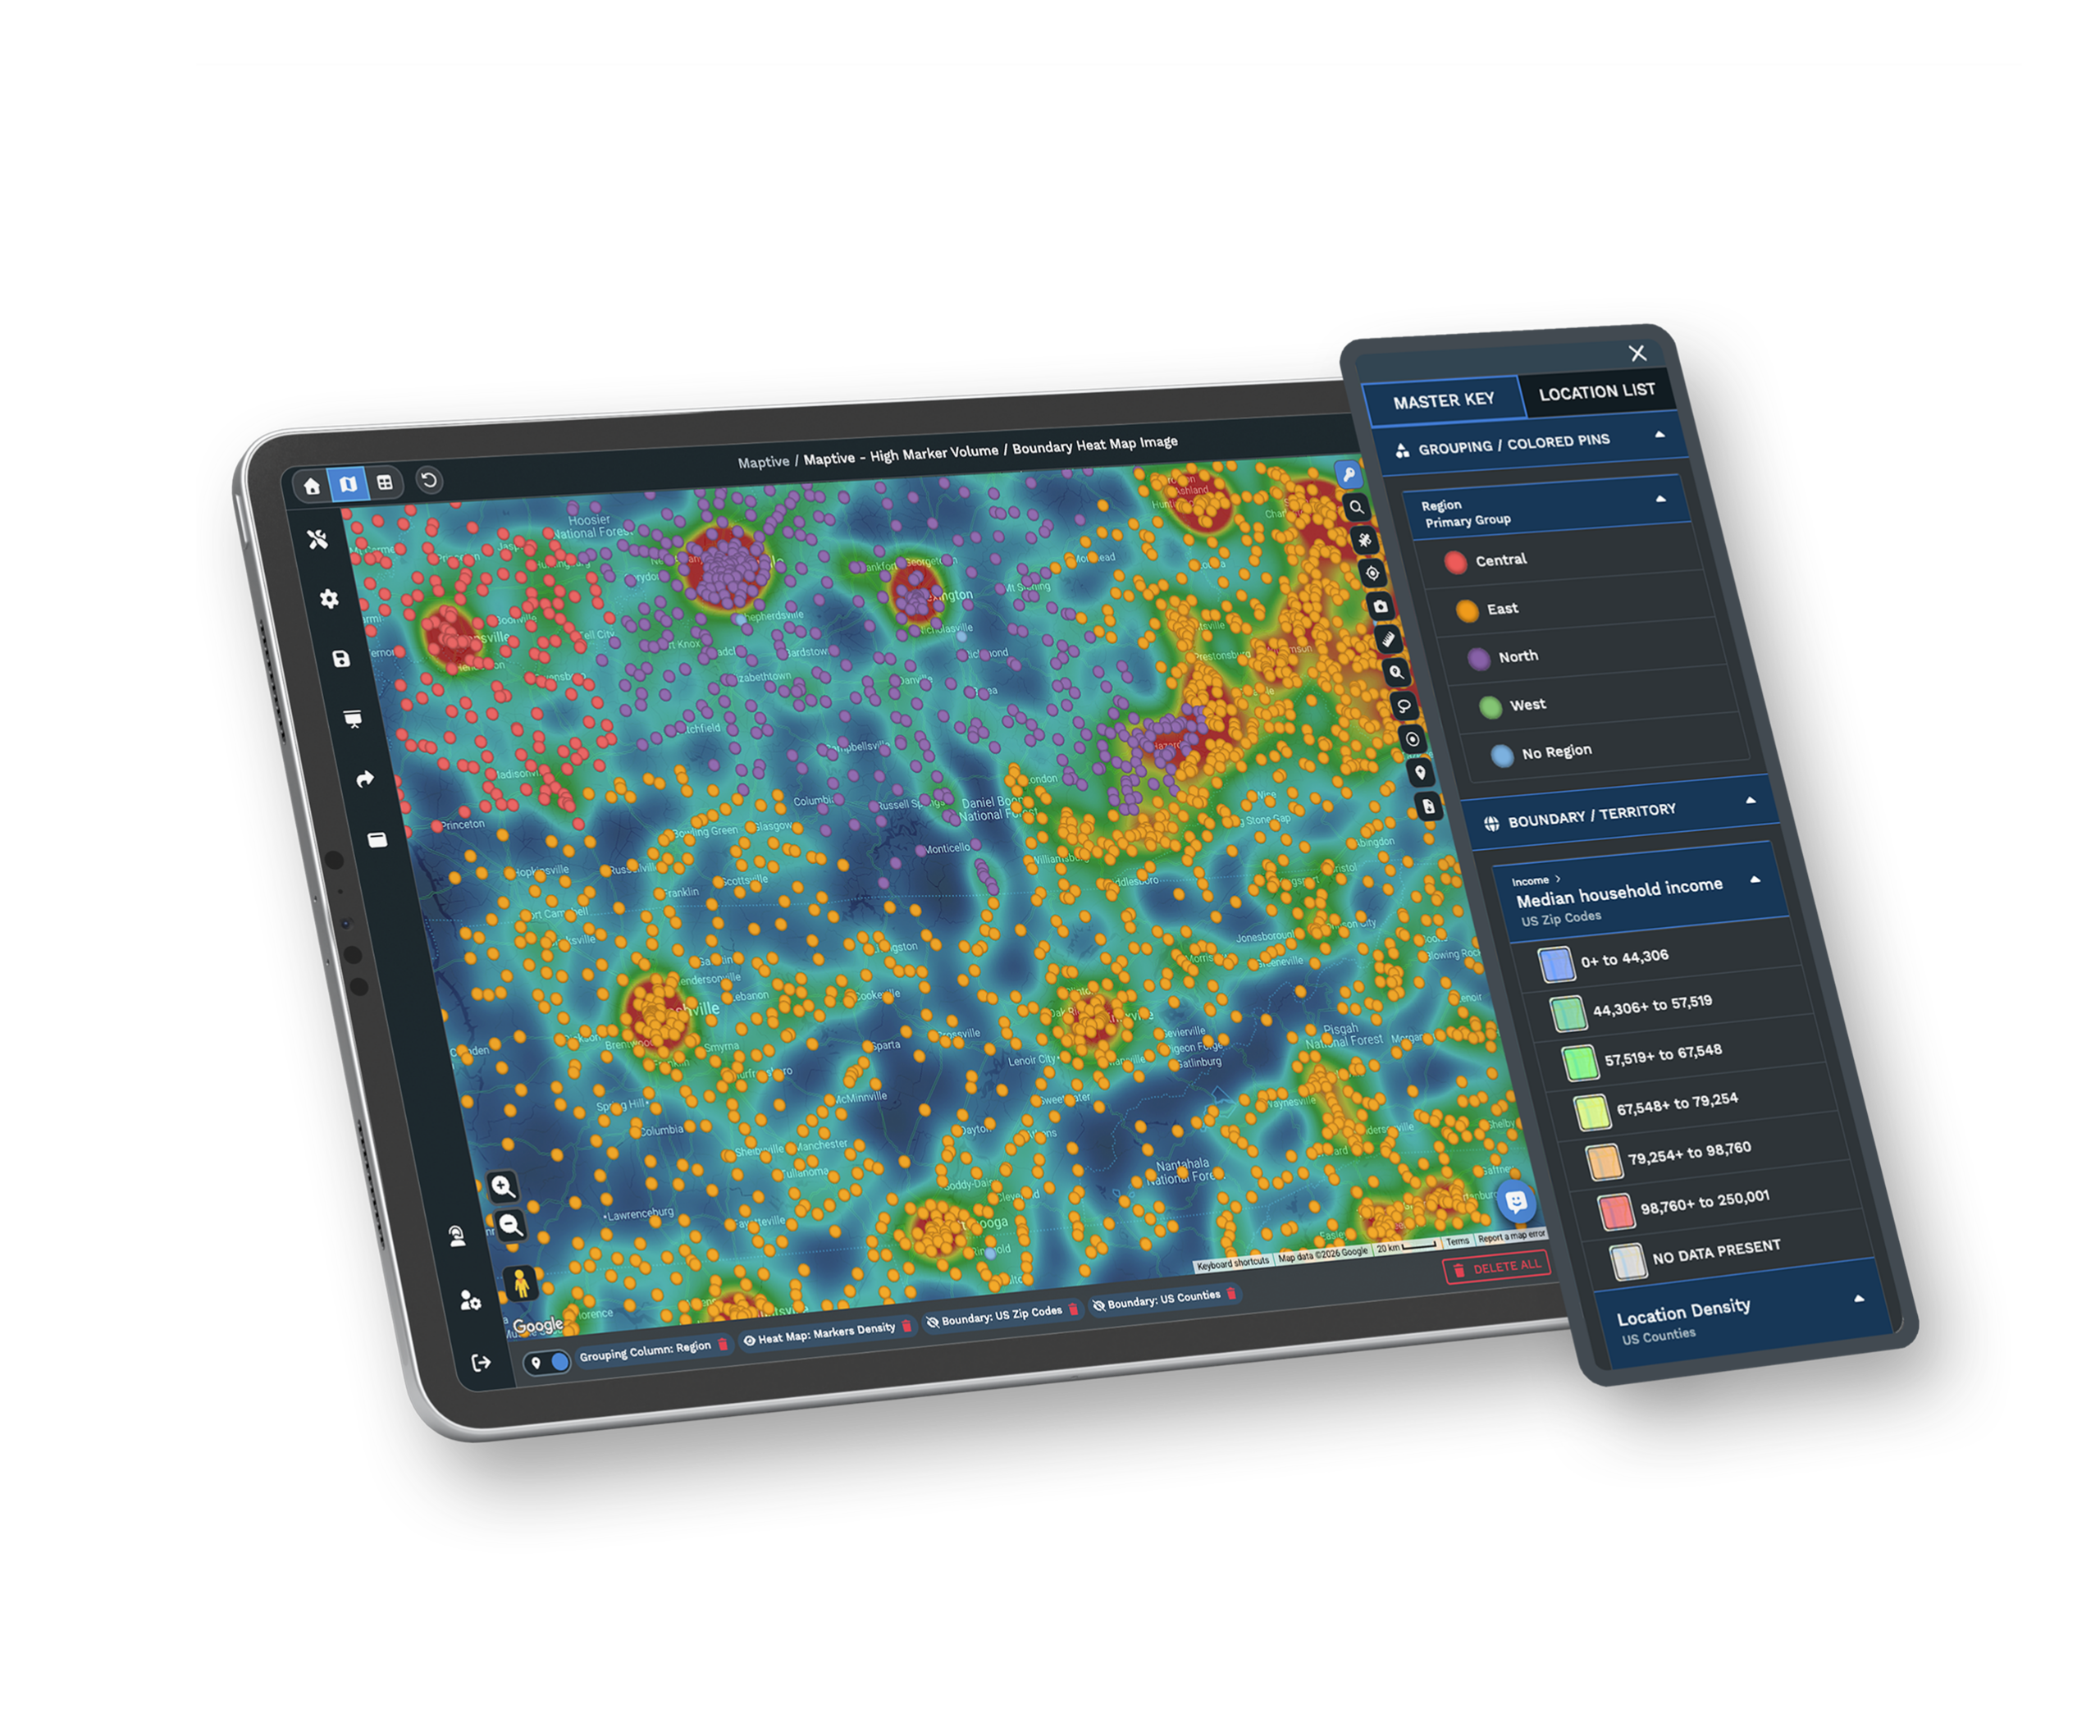
When you want the pattern rather than the precise figure, a heat map across your zip codes shows it. Maptive shades each zip code by density or a numeric value, so the regions carrying the most weight read clearly while the quieter ones step back.
You can stack more than one fill on the same set of zip codes and switch which one is active, so a single map holds your sales view, your demand view, and your demographic view together. When you are ready to act on a region, you can turn those same zip codes into a territory map in a few clicks.
The Tools Behind Your Zip Code Map
Each one is a complete tool that you use inside the same platform.
Boundary Tool
Fill zip codes by your numbers, marker count, group data, or census data, and map city, county, state, and country boundaries too.
Heat Mapping Tool
Shade zip codes by density or a numeric value, so the regions carrying the most demand are easy to pick out.
Demographic Overlays
Add US and Canada census data by zip code, with population, income, and age inside popups, territories, and boundaries.
Who Builds Zip Code Maps in Maptive
Teams That Work by Zip Code
Sales teams build territories from zip codes and balance them as they grow. Marketers fill zip codes by campaign performance and target the areas that respond. Retail and site selection teams read demographics by zip to judge a market, and logistics teams use the same maps to plan coverage and routes.
Accurate, Current Geography
Your zip codes sit on Google Maps geography, so the boundaries and base map match what your team already trusts. Census data covers the US and Canada, giving you population, income, and age behind every zip code, with the same numbers available in popups, territories, and boundary fills.
Support When You Need It
Maptive's support team works from the US and Canada and usually replies in minutes. When you start, they help you clean your zip code data, match it to boundaries, and set up your first fills and territories, so your first zip code map is ready without a long learning curve.
Free trial with the full platform and no credit card
Map Your Zip Codes Today
The ten-day free trial gives you every feature in Maptive, and you do not need a credit card to start. You can bring in your spreadsheet, fill zip codes by your data, shade them into a heat map, add census demographics, and group them into territories. Everything described on this page is open to you from the first day.
See It Built With Your Own Zip Codes
If you would rather see this applied to your own data than a sample, the Maptive team can walk you through filling zip codes by your numbers, adding census demographics, and grouping zip codes into territories using a file you already have.
Frequently Asked Questions
What is a zip code map?
A zip code map shows postal zip codes as shapes on a map rather than as rows in a spreadsheet. In Maptive, each US zip code becomes a boundary you can fill by your own data or census data, so the value behind each one is easy to read. You can shade those zip codes into a heat map, group them into sales territories, and read demographics for each area without leaving the same map.
How do I create a zip code map from my data?
You bring in the spreadsheet you already keep and point Maptive at the column that holds your zip codes. Maptive matches them to US boundaries, then you choose the value you want each zip code filled by, such as sales, customer count, or a group label. Maptive builds a color key for you. You can also color zip codes from your marker data, matching by a text field or by where each marker falls.
Can I make a zip code heat map?
Yes. You can shade zip codes into a heat map that shows density or a numeric value across a region, so the areas carrying the most weight stand out while the quieter ones step back. You can stack more than one fill on the same set of zip codes and switch which one is active, which lets a single map hold your sales view, your demand view, and your demographic view together without rebuilding it each time.
Can I color zip codes by my own numbers?
Yes. You can fill US zip code boundaries by your own numerical data, a marker count, your group or territory data, or census data. Maptive builds a color key so each band of values reads clearly, and you can adjust the ranges to fit how you want the data grouped. This is the core of a zip code map, and it works the same whether you are mapping a handful of zip codes or thousands at once.
Can I add census demographics by zip code?
Yes. Maptive carries census data for the US and Canada, so you can read population, income, and age by zip code right inside a popup, across a territory, or behind a boundary fill. There is nothing extra to download. This is what site selection and marketing teams use to judge whether a zip code holds the customers they want and whether an area can support a new location.
Can I build sales territories from zip codes?
Yes. You can group zip codes into sales territories and adjust them as you go, using the grouping tool. The boundary and territory tools work together, so you can build a territory from zip codes or draw a custom area by hand when a region sits outside the usual lines. Each territory can carry its own demographic summary, which helps you balance them by population or income rather than by area alone.
Can I color zip codes based on my marker data?
Yes. If your data lives as markers on the map, you can color zip codes from that data instead of a separate column. Maptive matches markers to zip codes by a text field in your file or by where each marker falls, then fills each zip code accordingly. You can also stack this fill alongside others on the same zip codes and switch which one is active, so one map can show several ways of reading the same area.
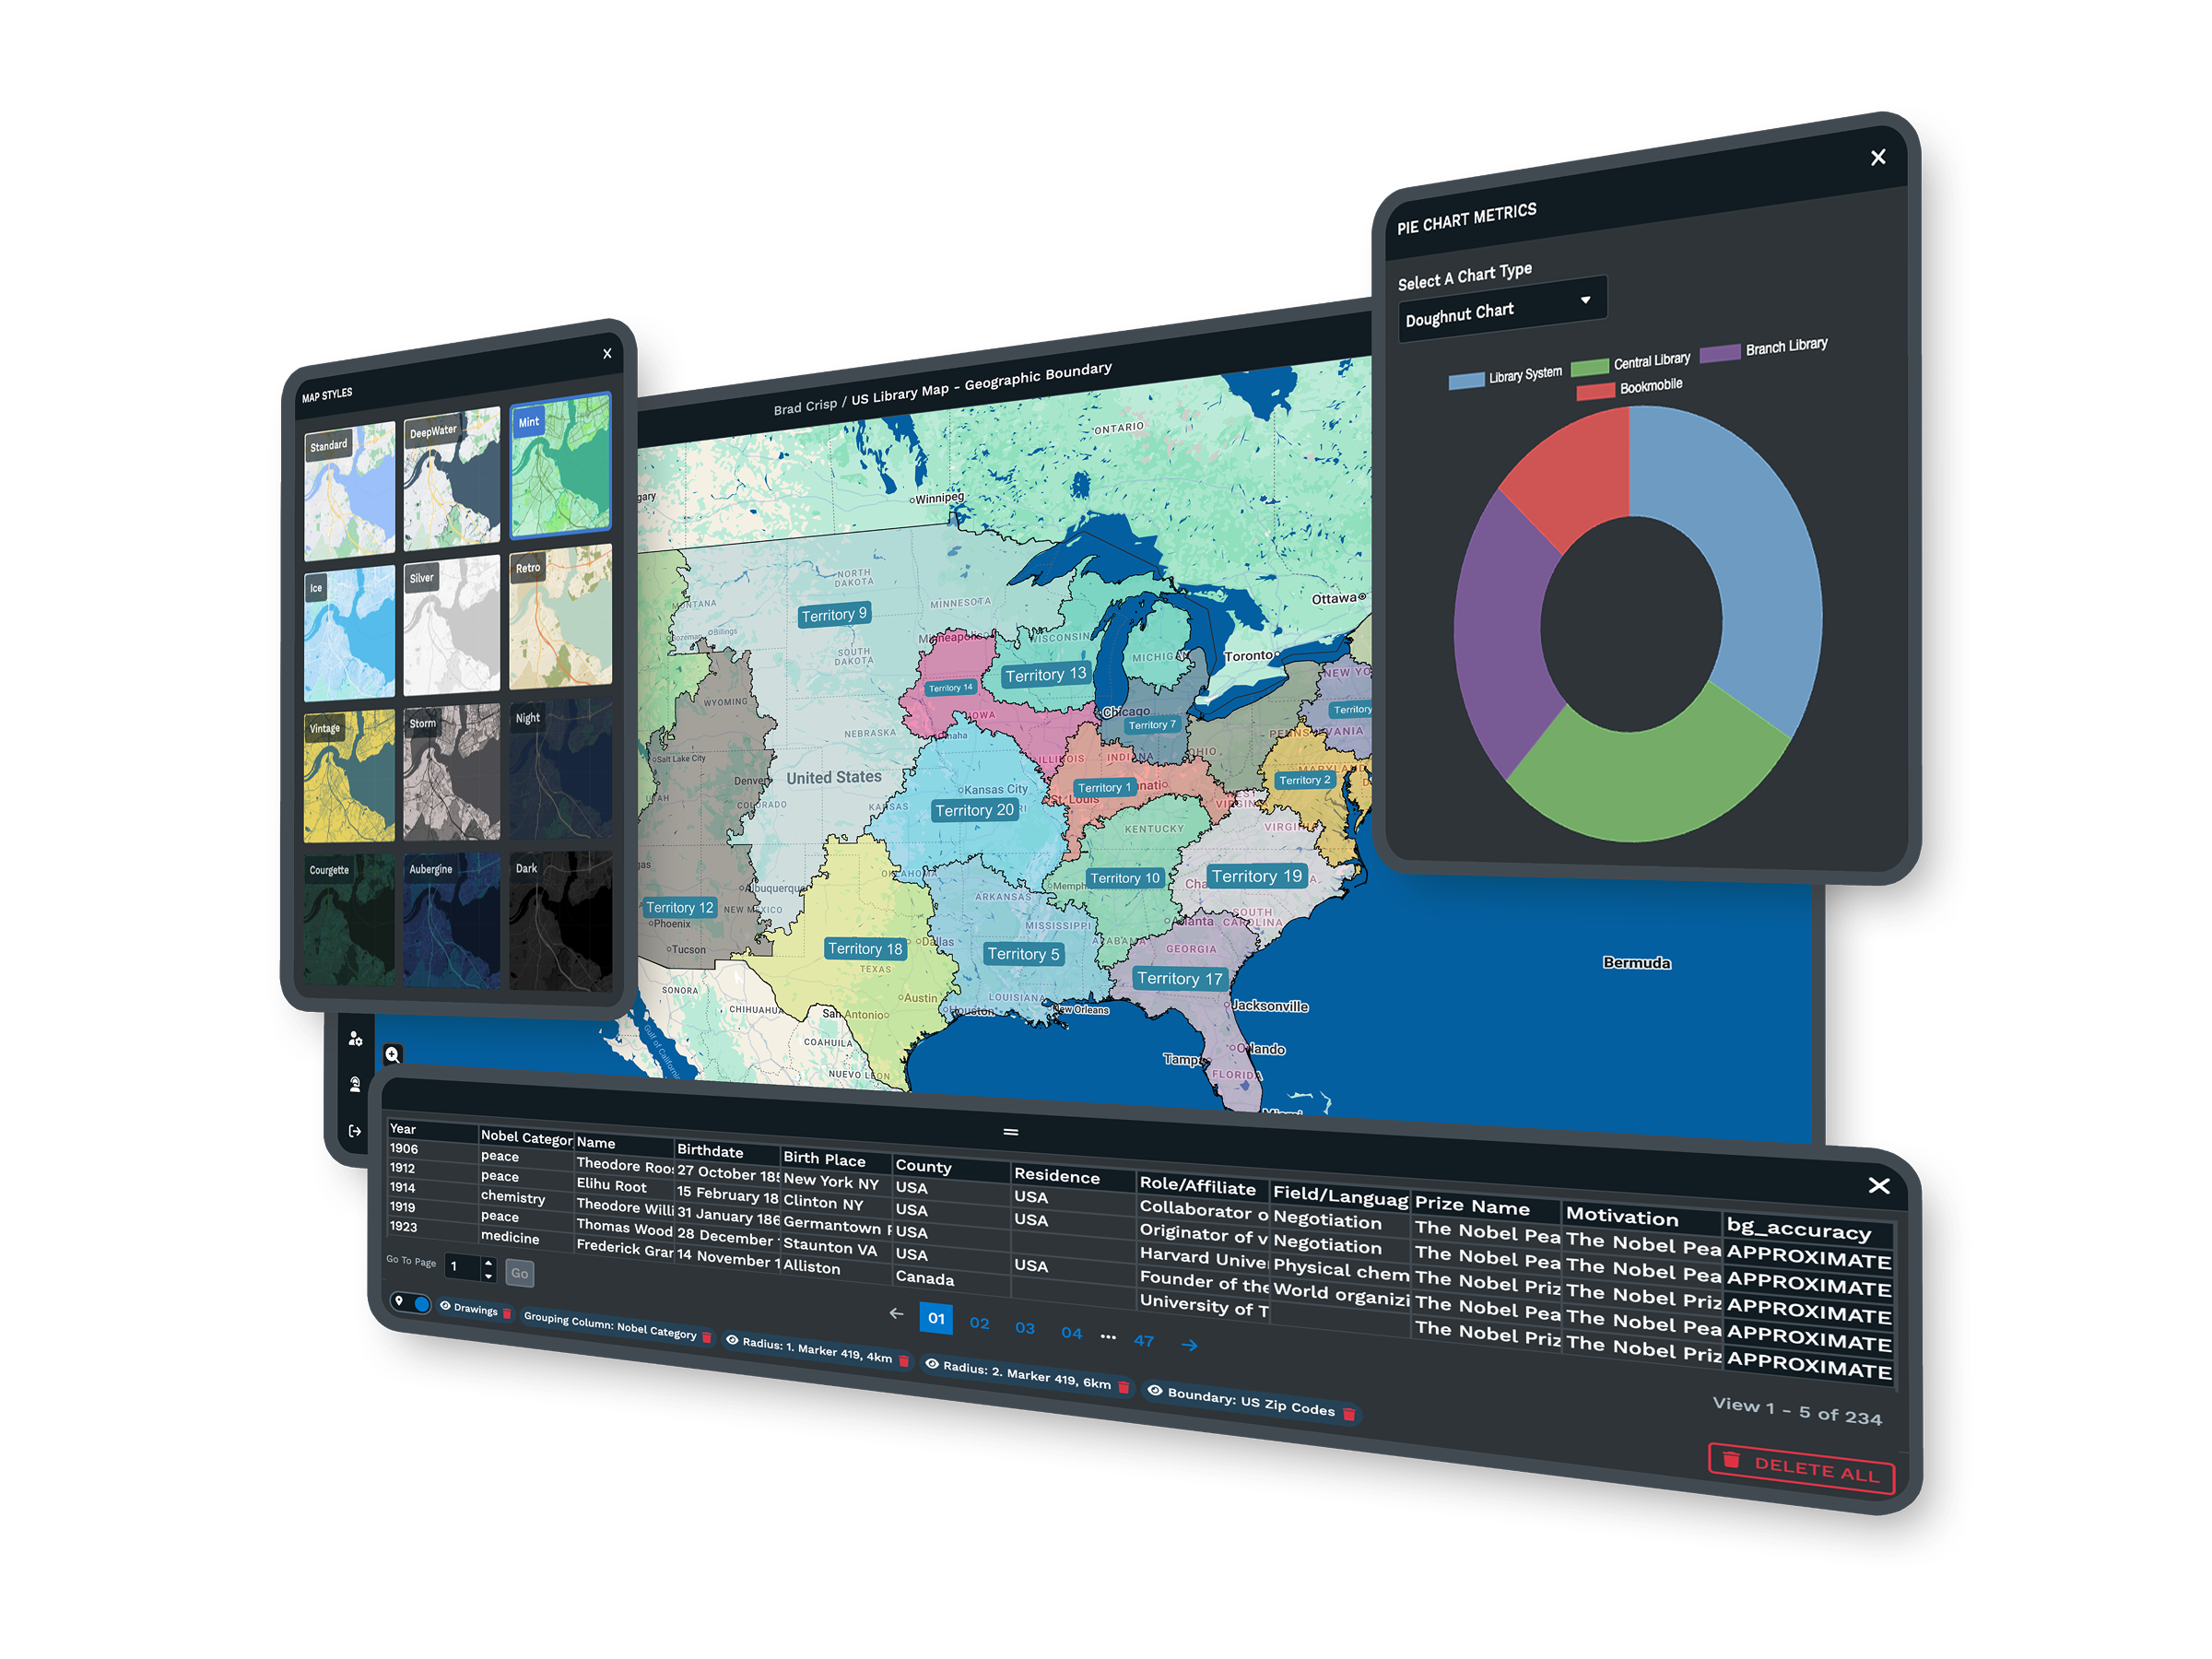
What other boundaries can I map besides zip codes?
Along with zip codes, you can map city, county, state, and country boundaries, and fill any of them by your own data or census data the same way. This means you can move between a national view by state, a regional view by county, and a local view by zip code on the same map. It helps when one audience needs the wide picture and another needs the detail behind a single area.
How large a dataset can Maptive handle?
You can plot up to 200,000 markers on one map. Maptive draws them with WebGL, so a large dataset stays smooth as you pan, zoom, and filter rather than slowing to a crawl. That headroom matters when you are coloring zip codes from marker data or working across a national footprint, since you can keep every record on a single map instead of splitting your data into several files.
Can I share or export my zip code map?
Yes. You can share a focused map by isolating the specific zip codes you want someone to see, then send a link, embed the map on a page, or export it. Viewers do not need a Maptive account to open a shared link, which makes it easy to hand a zip code map to a colleague, a client, or a franchisee. The same map can be shared a few different ways without rebuilding it.


