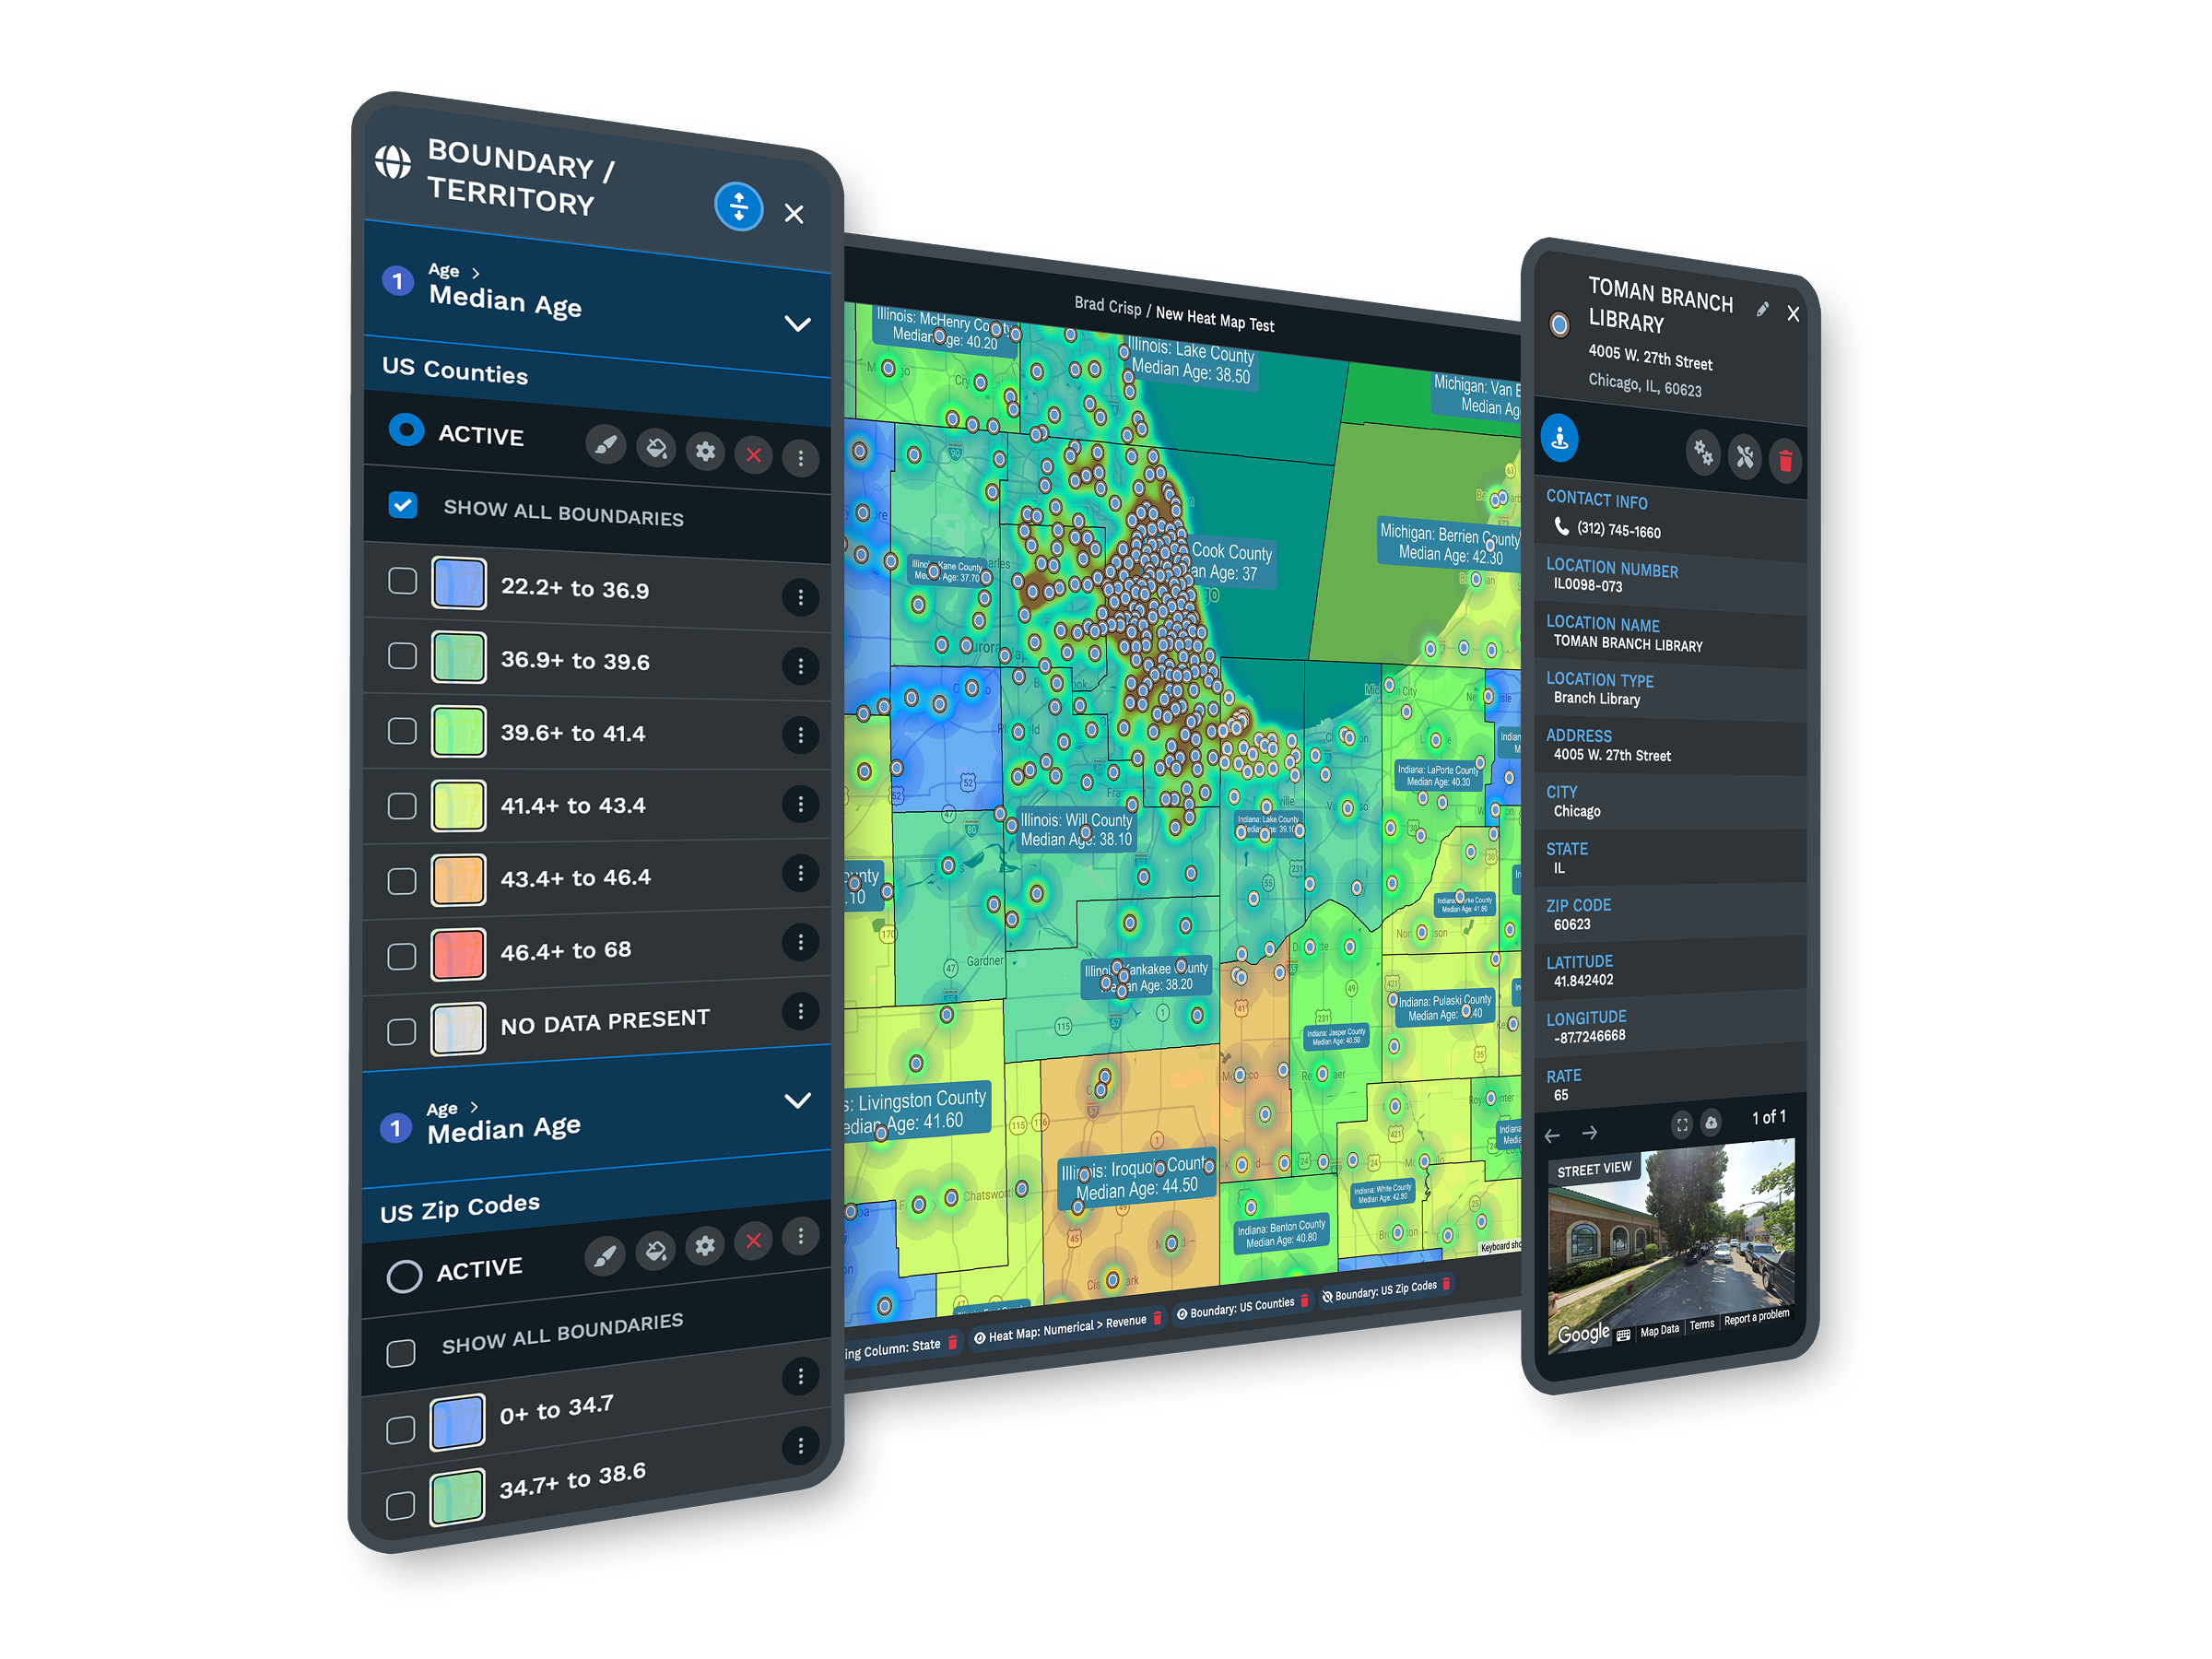
Franchise & Multi-Location Mapping Software
Maptive puts your whole network, nearby competing locations, and the sites you are weighing onto one map. Define territories, check for overlap, and review a market before you commit capital.
No credit card required
- Every location on one map
- Protect territories by ZIP
- Score sites before you sign
- Drive-time trade areas per unit
- Spot market overlap between units
- Share maps with every franchisee
- Every location on one map
- Protect territories by ZIP
- Score sites before you sign
- Drive-time trade areas per unit
- Spot market overlap between units
- Share maps with every franchisee
Trusted by teams at


What Franchise Teams Gain
Checking drive-time overlap before you approve a unit cuts the shared ground between neighboring owners by about 31%.
Reading demand and competitors on one map speeds each go or no-go decision on a new franchise site by around 40%.
Qualifying territory demand against brand standards before signing cuts openings that miss target by about 24%.
From Site Search to Network Rollout
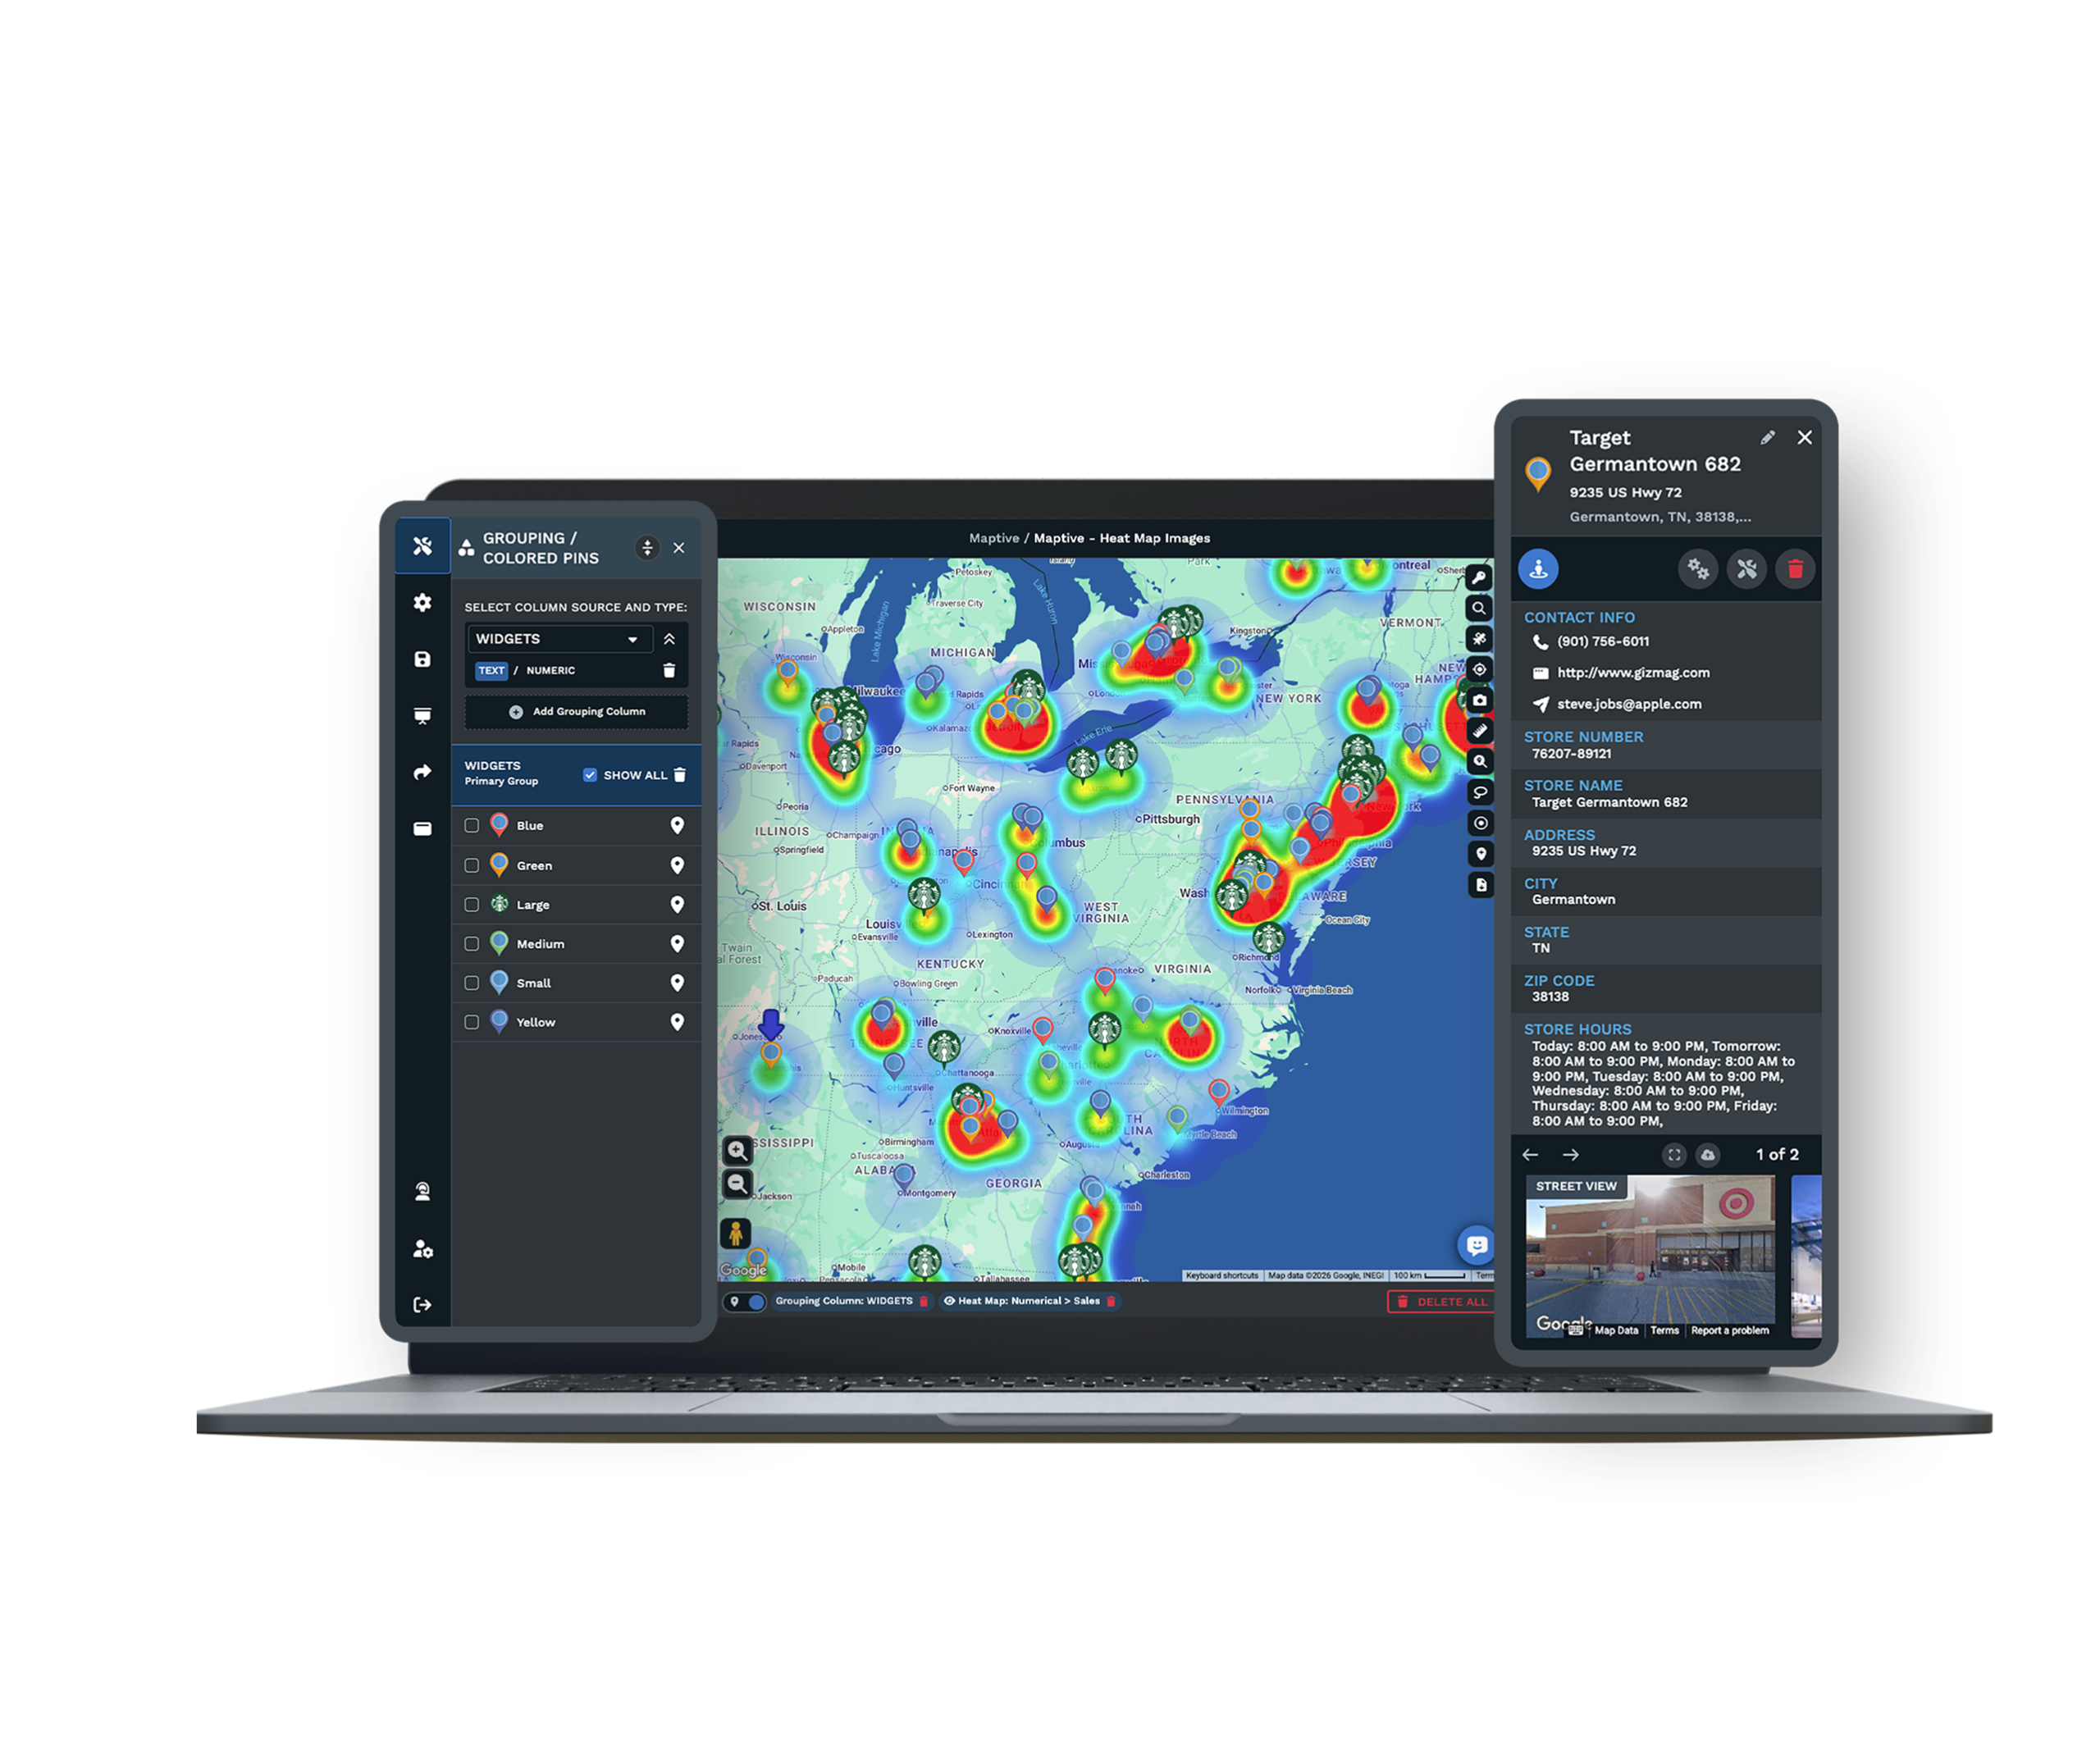
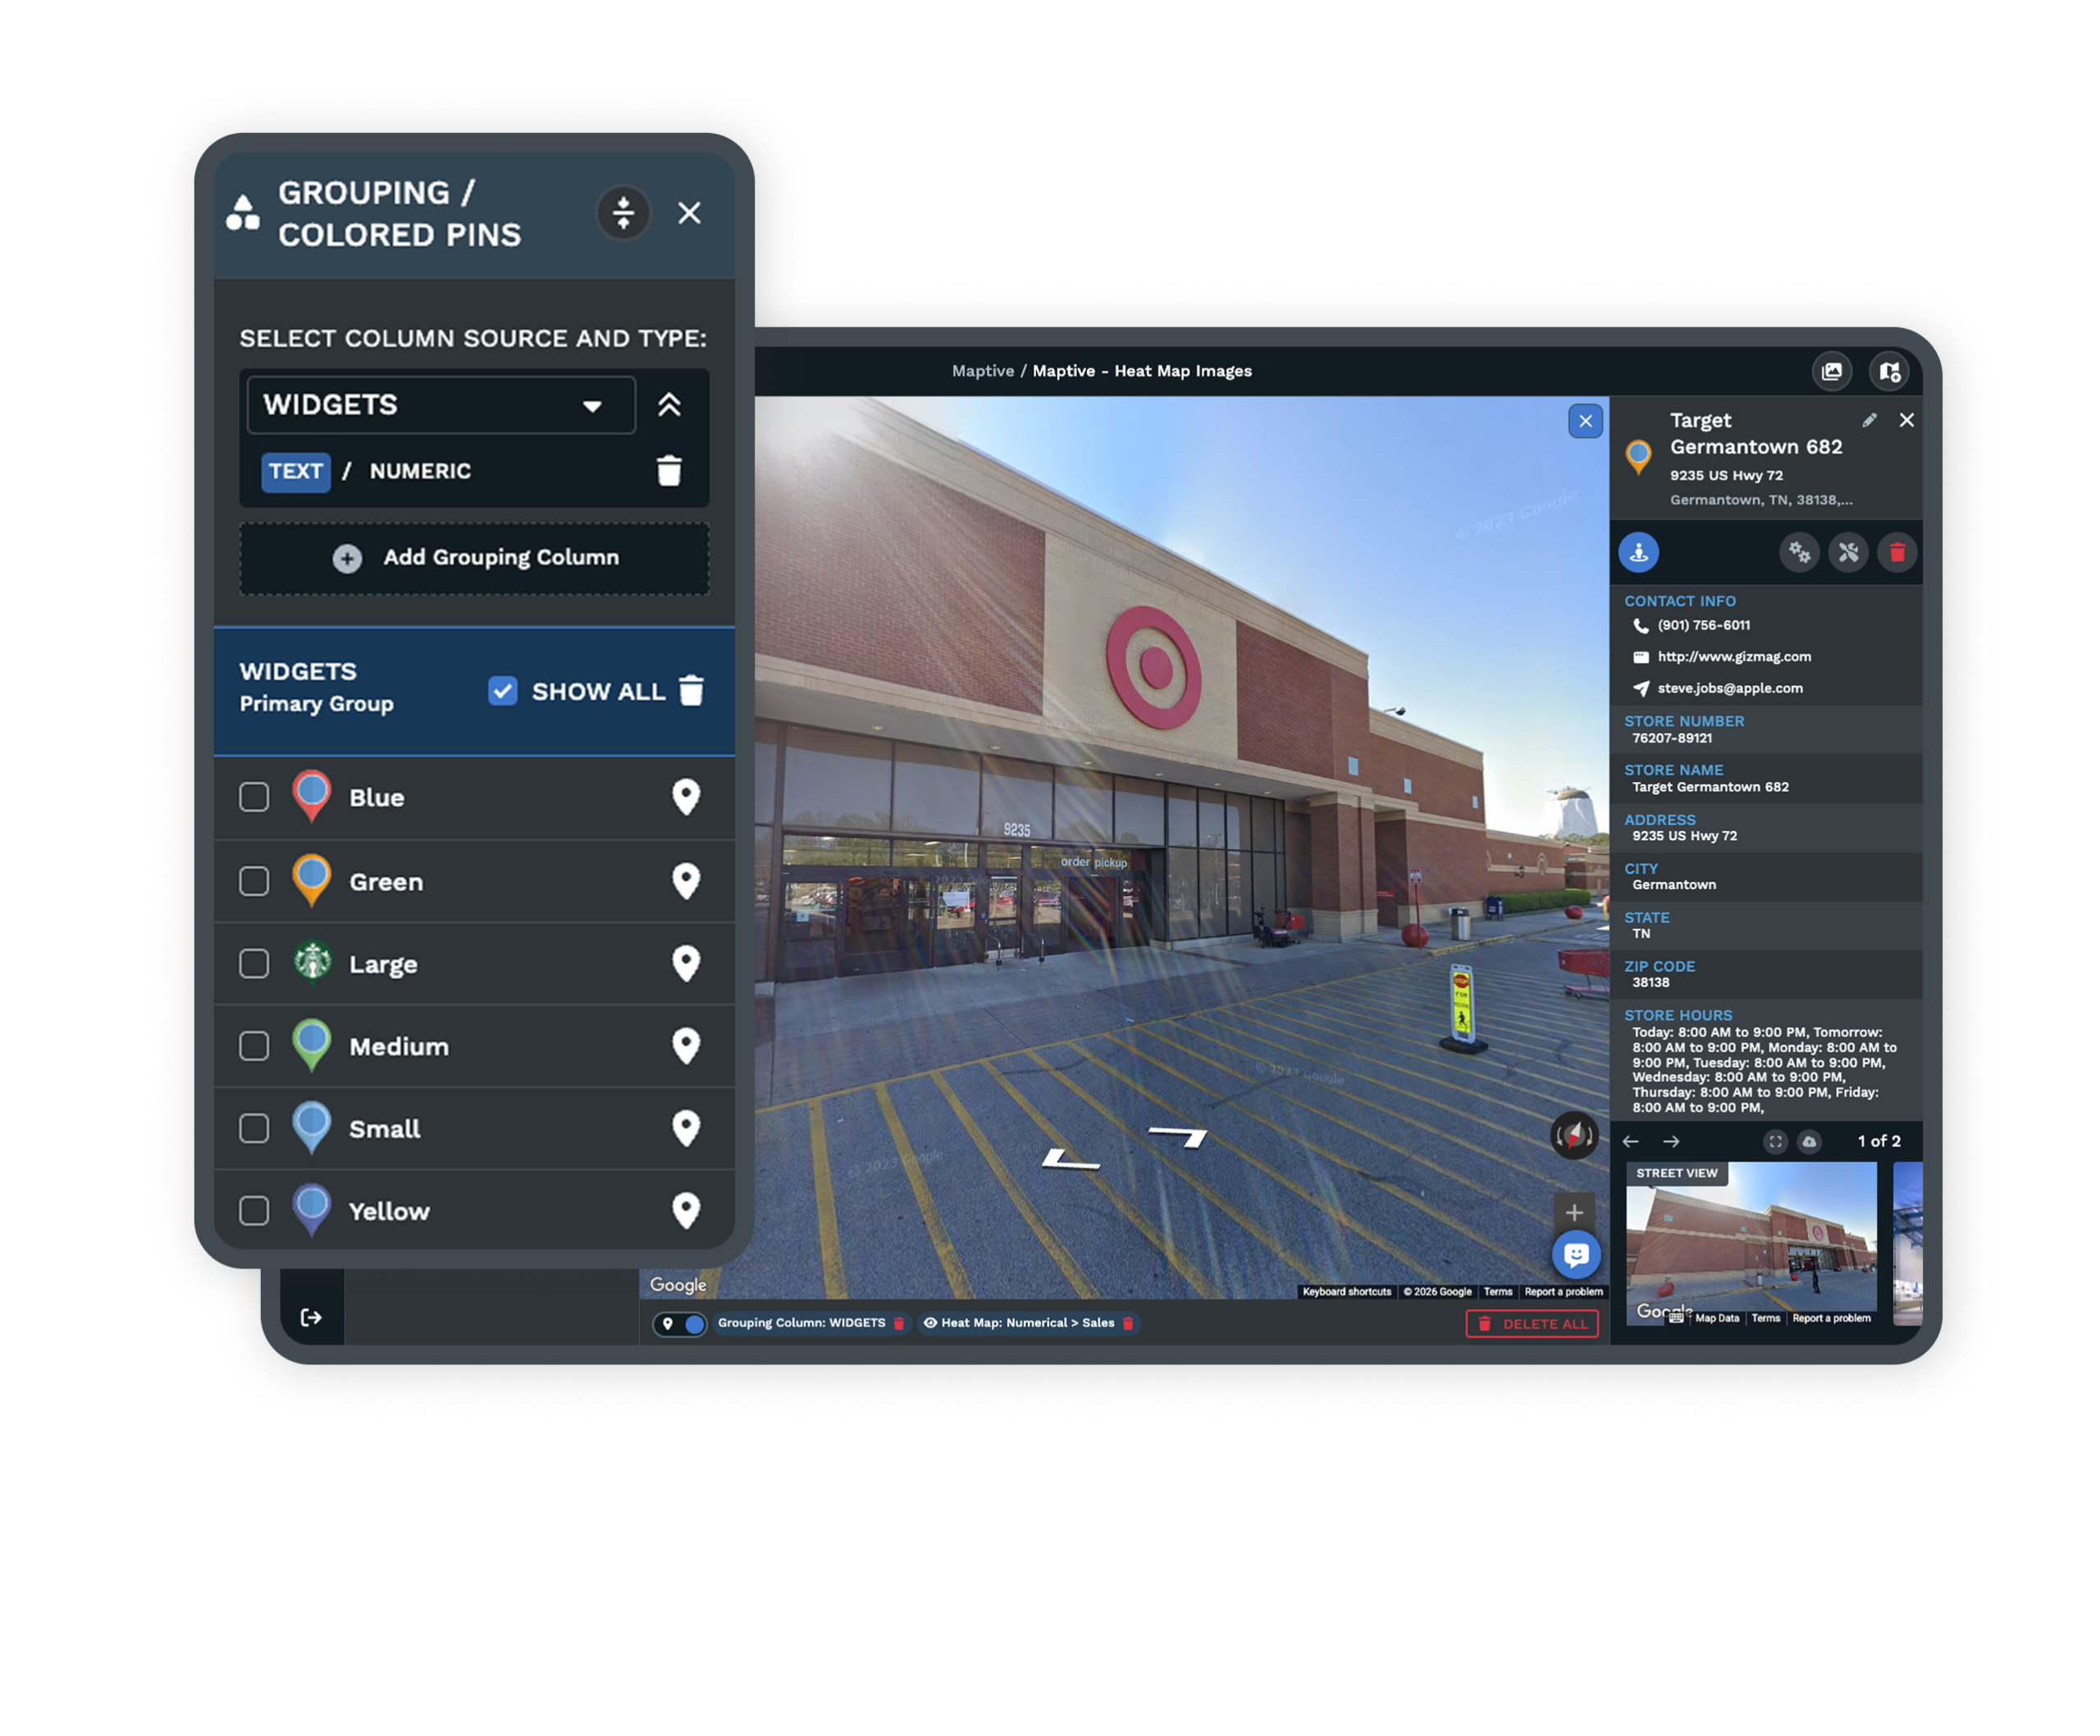
| 01 | Your Whole Footprint on One MapPlot every unit, competing location, and proposed opening together. Color-code by performance, region, or ownership, and the whole system reads at a glance. |
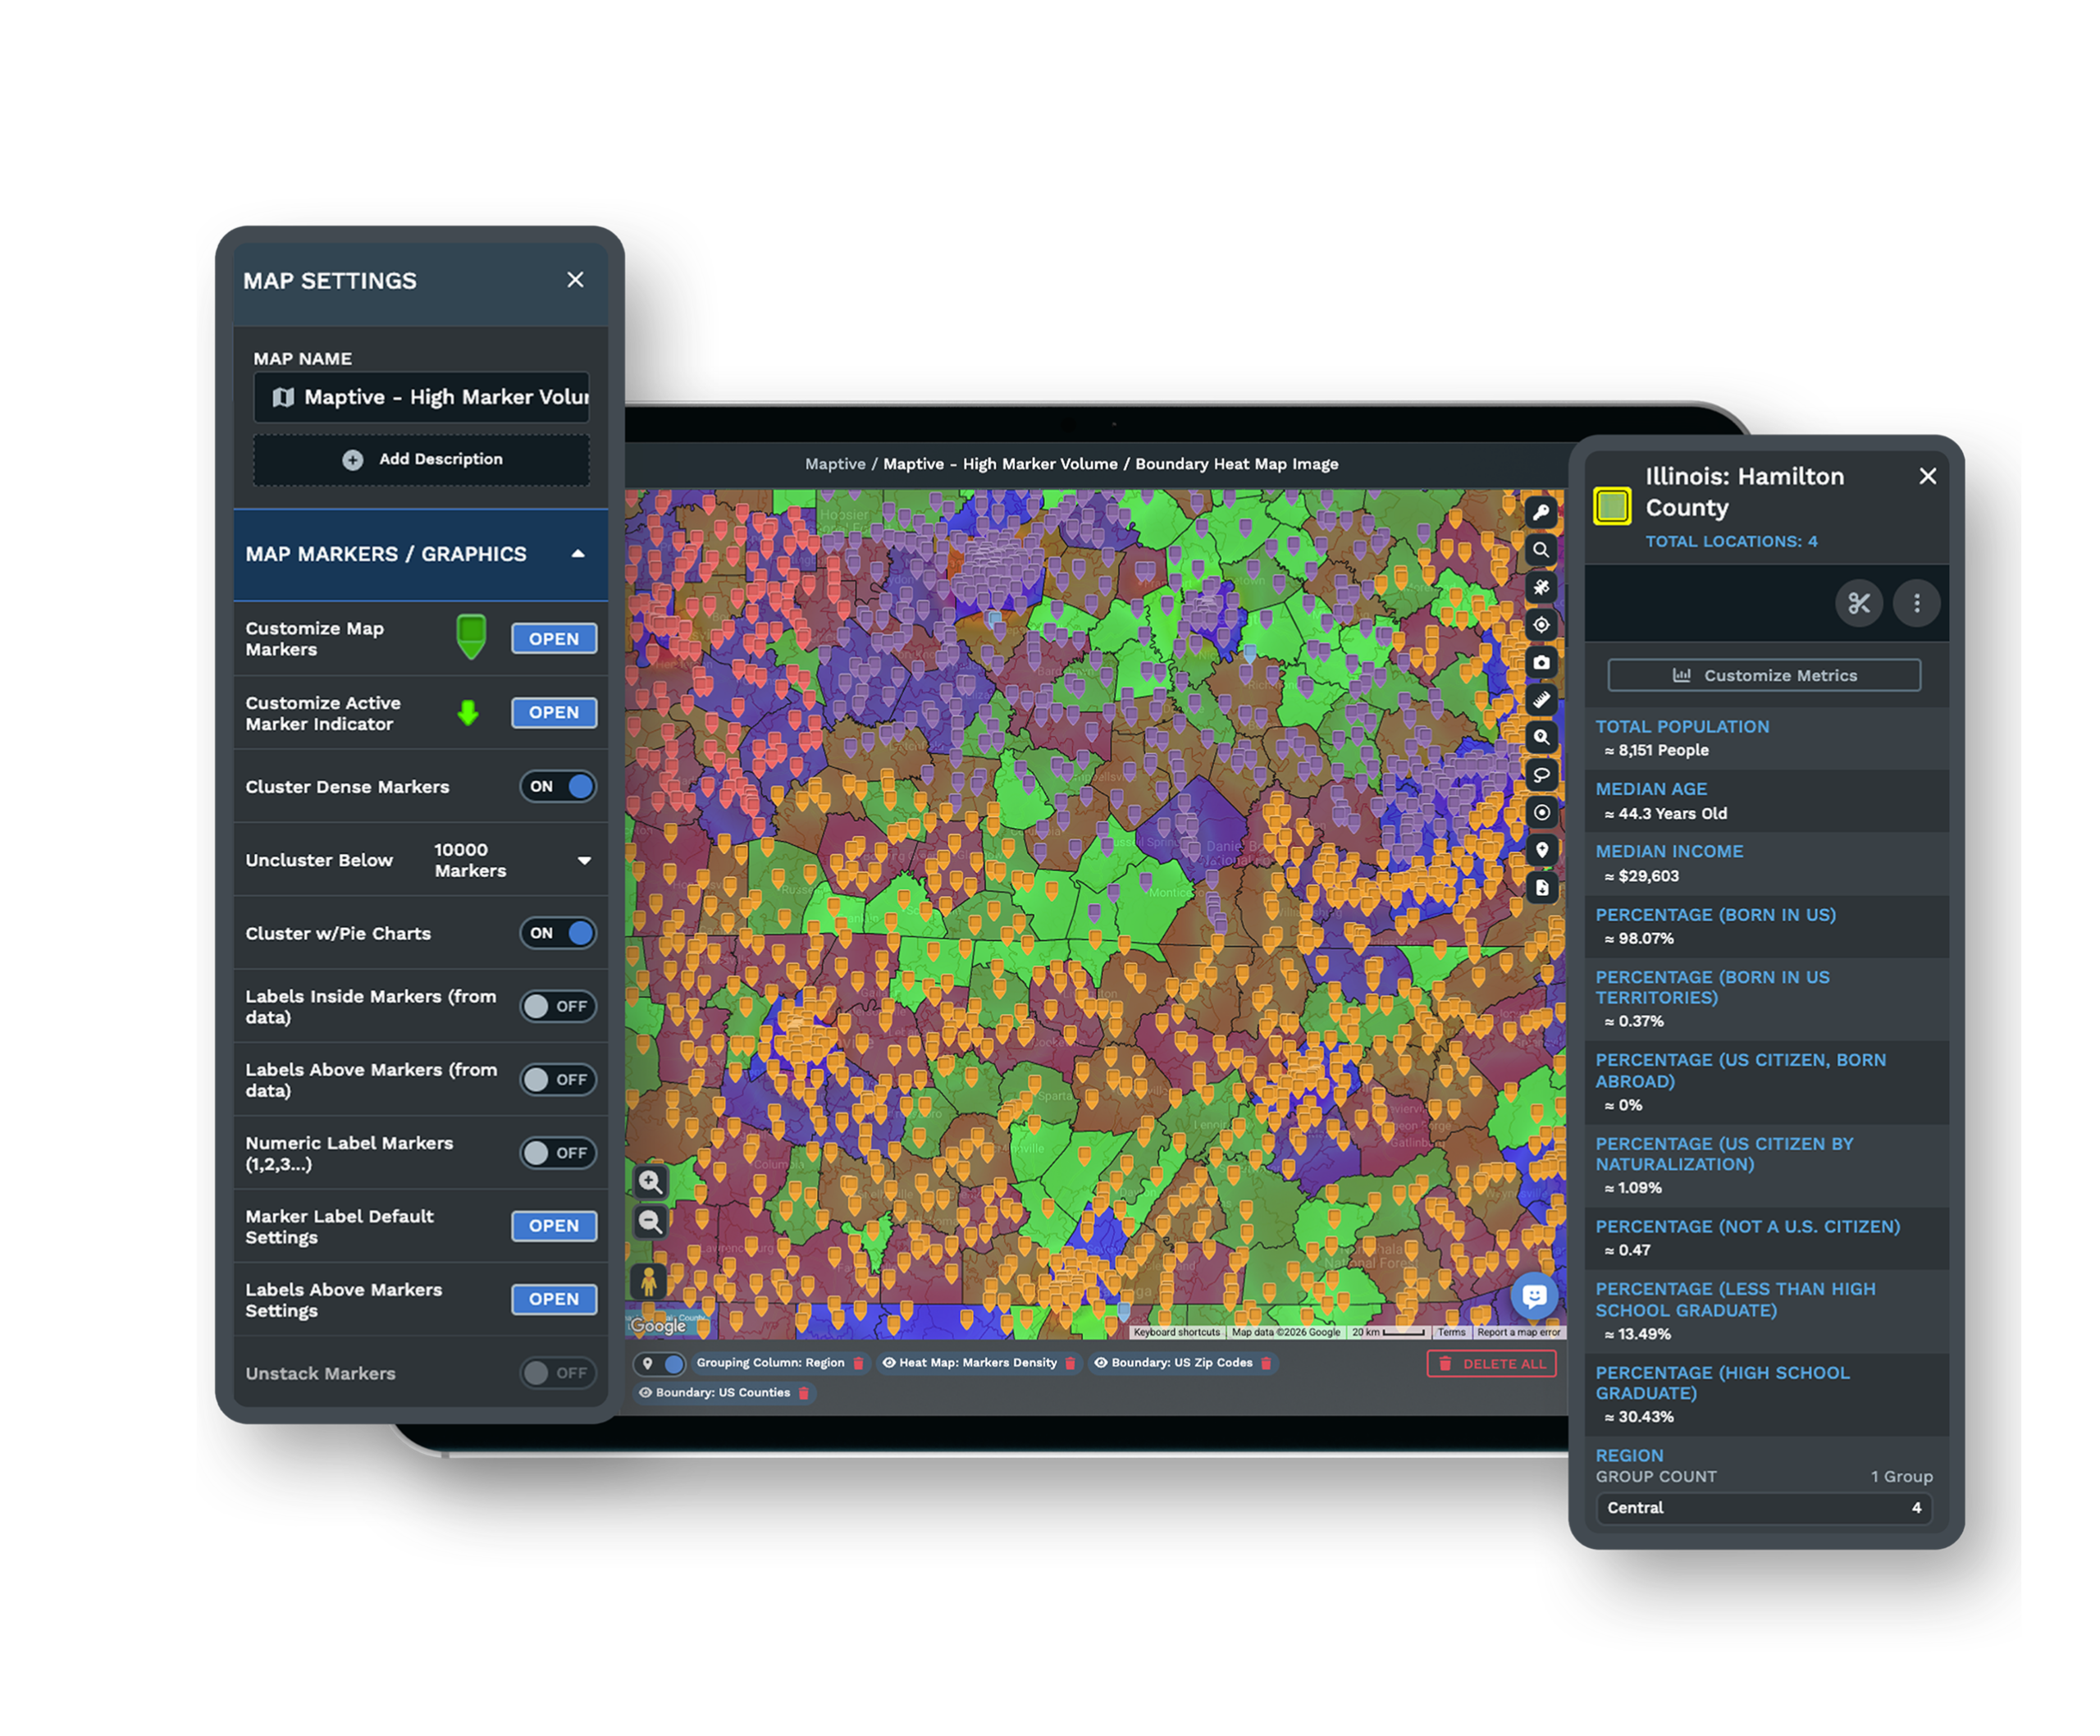
| 02 | Territories That Meet FDD RequirementsGroup ZIP codes, counties, or census tracts into protected territories, or draw freehand boundaries for areas outside standard lines. Boundary definitions export with demographic summaries for your agreements. |
| 03 | Drive-Time Overlap AnalysisDraw polygons around existing and proposed sites to see where two customer pools would share the same ground. The overlap is the clearest early signal of cannibalization risk. |
| 04 | Permissions That Match Your HierarchyCorporate sees the full network, a regional director sees their region, and a franchisee sees only their unit. Password-protected links share a single territory map without granting platform access. |
| 05 | Exports for Agreements and InvestorsTerritory data exports to XLS, CSV, or TSV with boundary definitions and demographic summaries. Map images drop straight into franchise agreements and investor presentations. |
Reading a Market Before You Commit
The Difference Between a Good Site and the Right Territory
A high-traffic corner with a motivated landlord is easy to fall for. The storefront looks right, the snapshot checks out, the timeline cooperates. A site is one data point, while the territory around it is the whole picture. One real estate team found a proposed location within 0.8 miles of four direct rivals. The space was attractive, but the trade area was already full. Two miles away was an alternate site with comparable demographics and no direct competition, and the map made the better choice obvious before a lease was signed.
What Internal Numbers Miss About Each Unit
Internal reporting shows which units met their targets last quarter. It does not show which ones are leaving money in the market. A unit generating $800K a year looks healthy on a profit-and-loss statement. Layer demographic data onto its territory and the reading can change. If the income, density, and household profile support $1.4M in potential, that unit is capturing 57% of available demand, while a unit doing $500K in a territory that tops out near $550K is capturing 91%. With 50+ census variables on every plan, performance data becomes a benchmarking tool the moment both sit on the same map.
Brands Running Hundreds of Locations
Multi-Location Networks on Maptive
Coca-Cola, Hilton, Frito-Lay, CBRE, Bridgestone, and Chobani manage location operations on the platform across consumer goods, hospitality, logistics, and real estate. A 30-unit system and a 200-location chain run on the same tools, with room to scale as the network grows.
Security for a Franchise Hierarchy
Maptive protects your network with 256-bit SSL encryption, two-factor authentication, single sign-on, role-based access, and audit logging, and has passed the Salesforce AppExchange security review. With 99.9% uptime and 200,000-marker rendering, full network visibility never requires splitting data into regional batches.
Support That Knows Multi-Location Operations
The US and Canada support team answers in under 15 minutes, with a 9.7 out of 10 rating. White-glove onboarding covers data cleaning, map setup, and team training, so a development team rolling Maptive out to regional managers or franchisees has hands-on help from the first session.
Explore Every Franchise Mapping Workflow
Discover the many ways franchise teams use Maptive for territory management and network growth.
Protect Your Territories
Draw a protected radius or drive-time area around every franchisee and export it into the agreement.
Learn more →Embed Your Store Locator
Add a live locator so customers search by city and reach the nearest unit right from your own website.
Learn more →Map ZIP Code Territories
Group US ZIP codes or Canadian FSAs into balanced owner areas and export the list for the agreement.
Learn more →Color-Code Your Unit Map
Color every pin by status, brand, or type from a data column so the whole network reads at a glance.
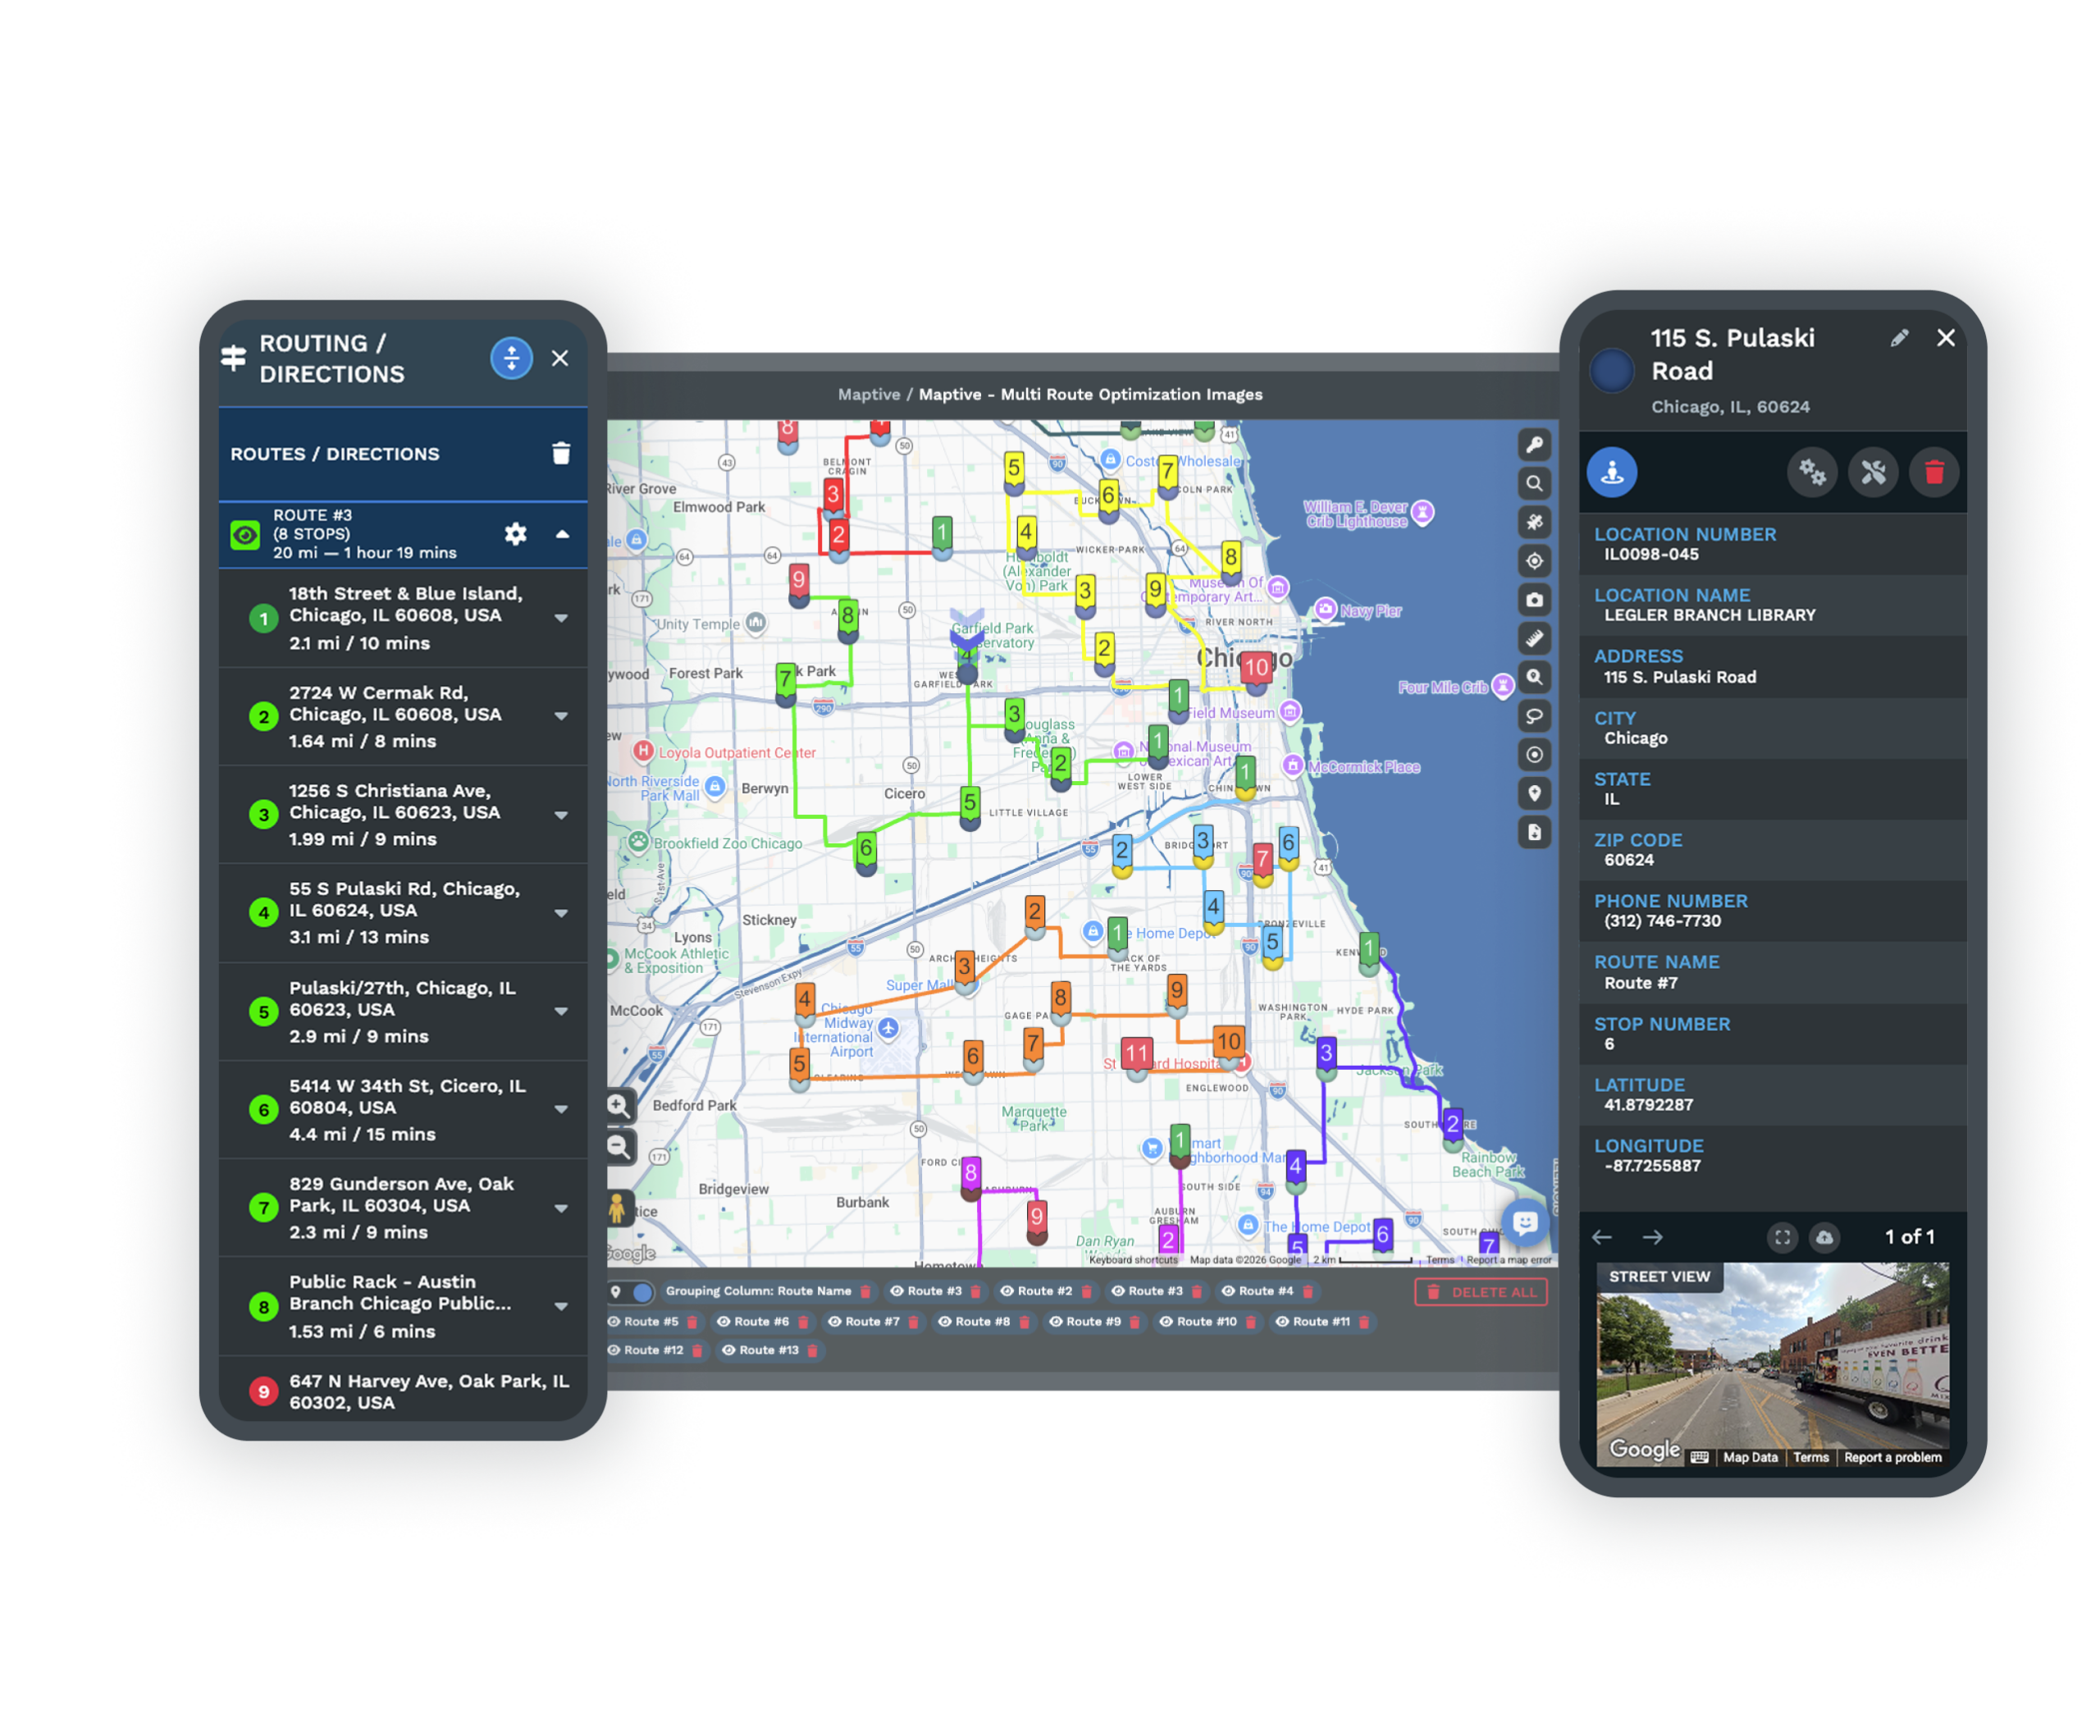
Learn more →Route Leads by Territory
Give each dealer an exclusive area and route every inbound lead to the dealer that covers the address.
Learn more →Map Your Whole Franchise
Put every unit on one live map with its status, brand, and franchisee contact shown inside the pop-up.
Learn more →Qualify Territory Demand
Read census income, age, and density inside any boundary to qualify it against your brand standards.
Learn more →Sync CRM and Territories
Map your Salesforce or HubSpot accounts, balance them into territories, and sync each assignment back.
Learn more →Map Your Multiple Brands
Keep a map for every brand plus a combined rollup view, all under one login inside a single account.
Learn more →Share Per-Territory Maps
Give each franchisee only their own area and set view or edit access while HQ holds the master copy.
Learn more →Align Accounts by Region
Sort every account to the sales center whose boundary covers its address and rebalance the workload.
Learn more →Map Your Region Buildout
Track a region's buildout on one map and follow each planned unit from prospective through to launch.
Learn more →Show Open & Sold Markets
Shade every market by status so sales sees where the brand can still sell and where an area is taken.
Learn more →Find White-Space Markets
Overlay competitors on your territories to find saturated markets and where the open ground remains.
Learn more →Gauge Sales Overlap Risk
Map where customers live before adding a unit to gauge how much it would take from the ones you own.
Learn more →Go Beyond Consumer Tools
Draw zones by ZIP, radius, or drive time and hold the whole network on one purpose-built map instead.
Learn more →Match Leads to a Partner
Match each lead to a partner who covers the address and can do the job, with the area tagged by skill.
Learn more →Reduce Territory Overlap
Confirm a new unit will not sit on an existing owner's area before you approve the opening on the map.
Learn more →Price Territories Fairly
Rank every metro you plan to sell, attach an opportunity score, and set one fair price per territory.
Learn more →Vet Sites Before Signing
Vet a candidate address before the lease by reading demand and nearby competitors in the trade area.
Learn more →Free trial, full platform, no credit card
Put Your Network on One Map
The ten-day free trial unlocks every feature with no credit card. Upload your location list, competing addresses, and proposed sites, layer on demographic data, build territories by ZIP code, and draw drive-time polygons to check for overlap. Every franchise workflow on this page is available from the first login.
See Your Network in a Live Session
For development teams or multi-location operators who want to see cannibalization analysis, territory validation, and competitor mapping on their own footprint, a Maptive specialist runs the demonstration using your real data. This is the path for committee-driven decisions and buyers comparing tools. Bring your expansion questions, and the session works through your network rather than a sample map.
Frequently Asked Questions
What is franchise mapping software?
Franchise mapping software plots a multi-location network on one map and adds the territory and market tools a development team needs to grow it. Maptive shows your units, competing locations, and proposed sites together, defines protected territories by ZIP, county, or tract, and checks for trade-area overlap before a lease is signed. Corporate, regional, and franchisee users each see the right slice of the network, so the same platform supports headquarters planning and individual unit operations.
How do I define a franchise territory in Maptive?
You group ZIP codes, counties, or census tracts into a territory, or draw freehand boundaries for areas that do not follow standard lines. Maptive converts those selections into editable polygons you can adjust by dragging a boundary, and the territory data exports with boundary definitions and demographic summaries. That export is built to support franchise disclosure documentation and drops directly into an agreement, so the territory you draw on the map is the territory you can put in writing.
Can Maptive show cannibalization risk before we open a new unit?
Yes, and it is one of the most common reasons franchise teams use it. Draw drive-time polygons around an existing location and a proposed site, and where they overlap, the two units would draw from the same customers. Layer demographic data on the shared zone to judge if it holds enough demand for both. One network used this to avoid two openings that would have taken existing sales and chose a third site that added new revenue instead.
What is a drive-time analysis for franchise site selection?
A drive-time analysis, sometimes called an isochrone, maps how far customers will realistically travel to a location along real roads, rather than a simple radius. Maptive draws these polygons around current and proposed sites so you can see true trade areas and where they overlap. For franchise planning, that turns a vague sense of proximity into a measurable picture of which markets a new unit reaches and which existing units it might affect.
Can franchisees see only their own territory?
Yes. Role-based access controls let you set permissions by user. Corporate and development teams see the full network, regional managers see their region, and an individual franchisee sees only their assigned territory, including its demographic data and boundary definitions. During recruitment, a password-protected link shares a single territory map with a prospect without granting platform access. That separation keeps sensitive network data contained while still giving each operator the view they need to run their unit.
Does Maptive support FDD territory documentation?
Yes. You define each protected territory by ZIP code, county, or census tract, or by a freehand boundary, then export the boundary definitions and demographic summaries to XLS, CSV, or TSV. That documentation is built to support the territory descriptions a franchise disclosure document requires, so the map and the agreement describe the same area. Keeping definition and documentation in one platform reduces the gap between what you planned and what you put in front of a franchisee.
Can we embed a store locator on our website?
Yes. Maptive's Location Finder generates an embeddable store locator built from the same data you use for network planning. A customer enters an address and sees the nearest units with distances and directions. You deploy it with an HTML embed code, so no development work is required, and because it draws on your live location data, the locator stays current as the network grows. One dataset serves both internal planning and the public-facing finder on your site.
What market data is included for evaluating franchise territories?
Maptive includes more than 50 US Census variables at state, county, ZIP, tract, and block-group levels, covering household income, density, age, education, homeownership, and commuter patterns, on every plan with no add-ons. A growing library of market data categories adds spending and household detail alongside the census data. Together they let you score a territory on the demand it holds, so expansion decisions rest on the market rather than on a broker's summary or a gut read.
Can Maptive map our competitors' locations?
Yes. You upload competing locations the same way you upload your own units, and they appear on the map as a distinct layer. Plotting your network against nearby competition is central to trade-area analysis. It shows where a market is saturated, where it is open, and where a proposed site would sit relative to existing players. Combined with drive-time polygons and demographic overlays, that competitive view turns a site decision into a measured one rather than a hopeful one.
Do I need GIS expertise to use Maptive?
No. Maptive is built for franchise development and operations teams, not GIS specialists. You upload a spreadsheet of locations, the platform geocodes it, and the territory, demographic, and drive-time tools work through a plain interface. White-glove onboarding from the US and Canada support team covers data cleaning, map setup, and training, so a development team rolling the tool out to regional managers or franchisees has hands-on help from the first session rather than a manual to decode.

