Maptive
Technical documentation covering platform architecture, processing capabilities, spatial analysis tools, and enterprise integration features.
Platform Overview
Maptive is an enterprise-grade location intelligence platform that transforms complex spatial data into actionable business insights. Built on Google Maps Platform infrastructure with WebGL rendering, Maptive processes datasets exceeding 200,000 markers while delivering sub-second response times. Organizations including Amazon, General Electric, the US Department of Energy, and Coca-Cola rely on Maptive for territory optimization, market analysis, and operational planning.
Enterprise Architecture
The platform delivers enterprise-scale processing without desktop software installation or IT infrastructure investment. WebGL rendering handles complex visualizations with hardware acceleration while on-demand tile streaming prevents browser bottlenecks during analysis of large datasets. Enterprise cloud infrastructure provides geographic redundancy and automatic failover for consistent reliability.
- WebGL rendering engine processing 200,000+ markers simultaneously
- Large datasets processed rapidly without browser freezing or lockups
- Google Maps Platform enterprise infrastructure
- 256-bit SSL encryption with two-factor authentication and single sign-on (SSO)
- Role-based access controls and audit logging
- Zero major outages documented in 2025
Enterprise Adoption
Organizations across government, healthcare, retail, finance, and manufacturing sectors use Maptive for mission-critical spatial analysis. The US-based development and support teams operate from San Francisco with engineering resources in the United States and Canada.
Platform Features
Maptive provides 60+ mapping and analysis features with no tiered restrictions. All capabilities are available across plans. The March 2025 release of Maptive iQ introduced enhanced drive-time calculations, WebGL rendering, and automated territory optimization.
Mapping Tools
Detailed Drive Time Polygons
Create detailed polygons based on drive time up to 8 hours. Uses 300% more calculation points than previous versions for accurate service area visualization.
Radius Mapping (Buffer)
Draw circles around locations with customizable export options. Also known as buffer mapping. Export closest rows, data outside radii, and prevent duplicates across overlapping areas.
Territory Tools
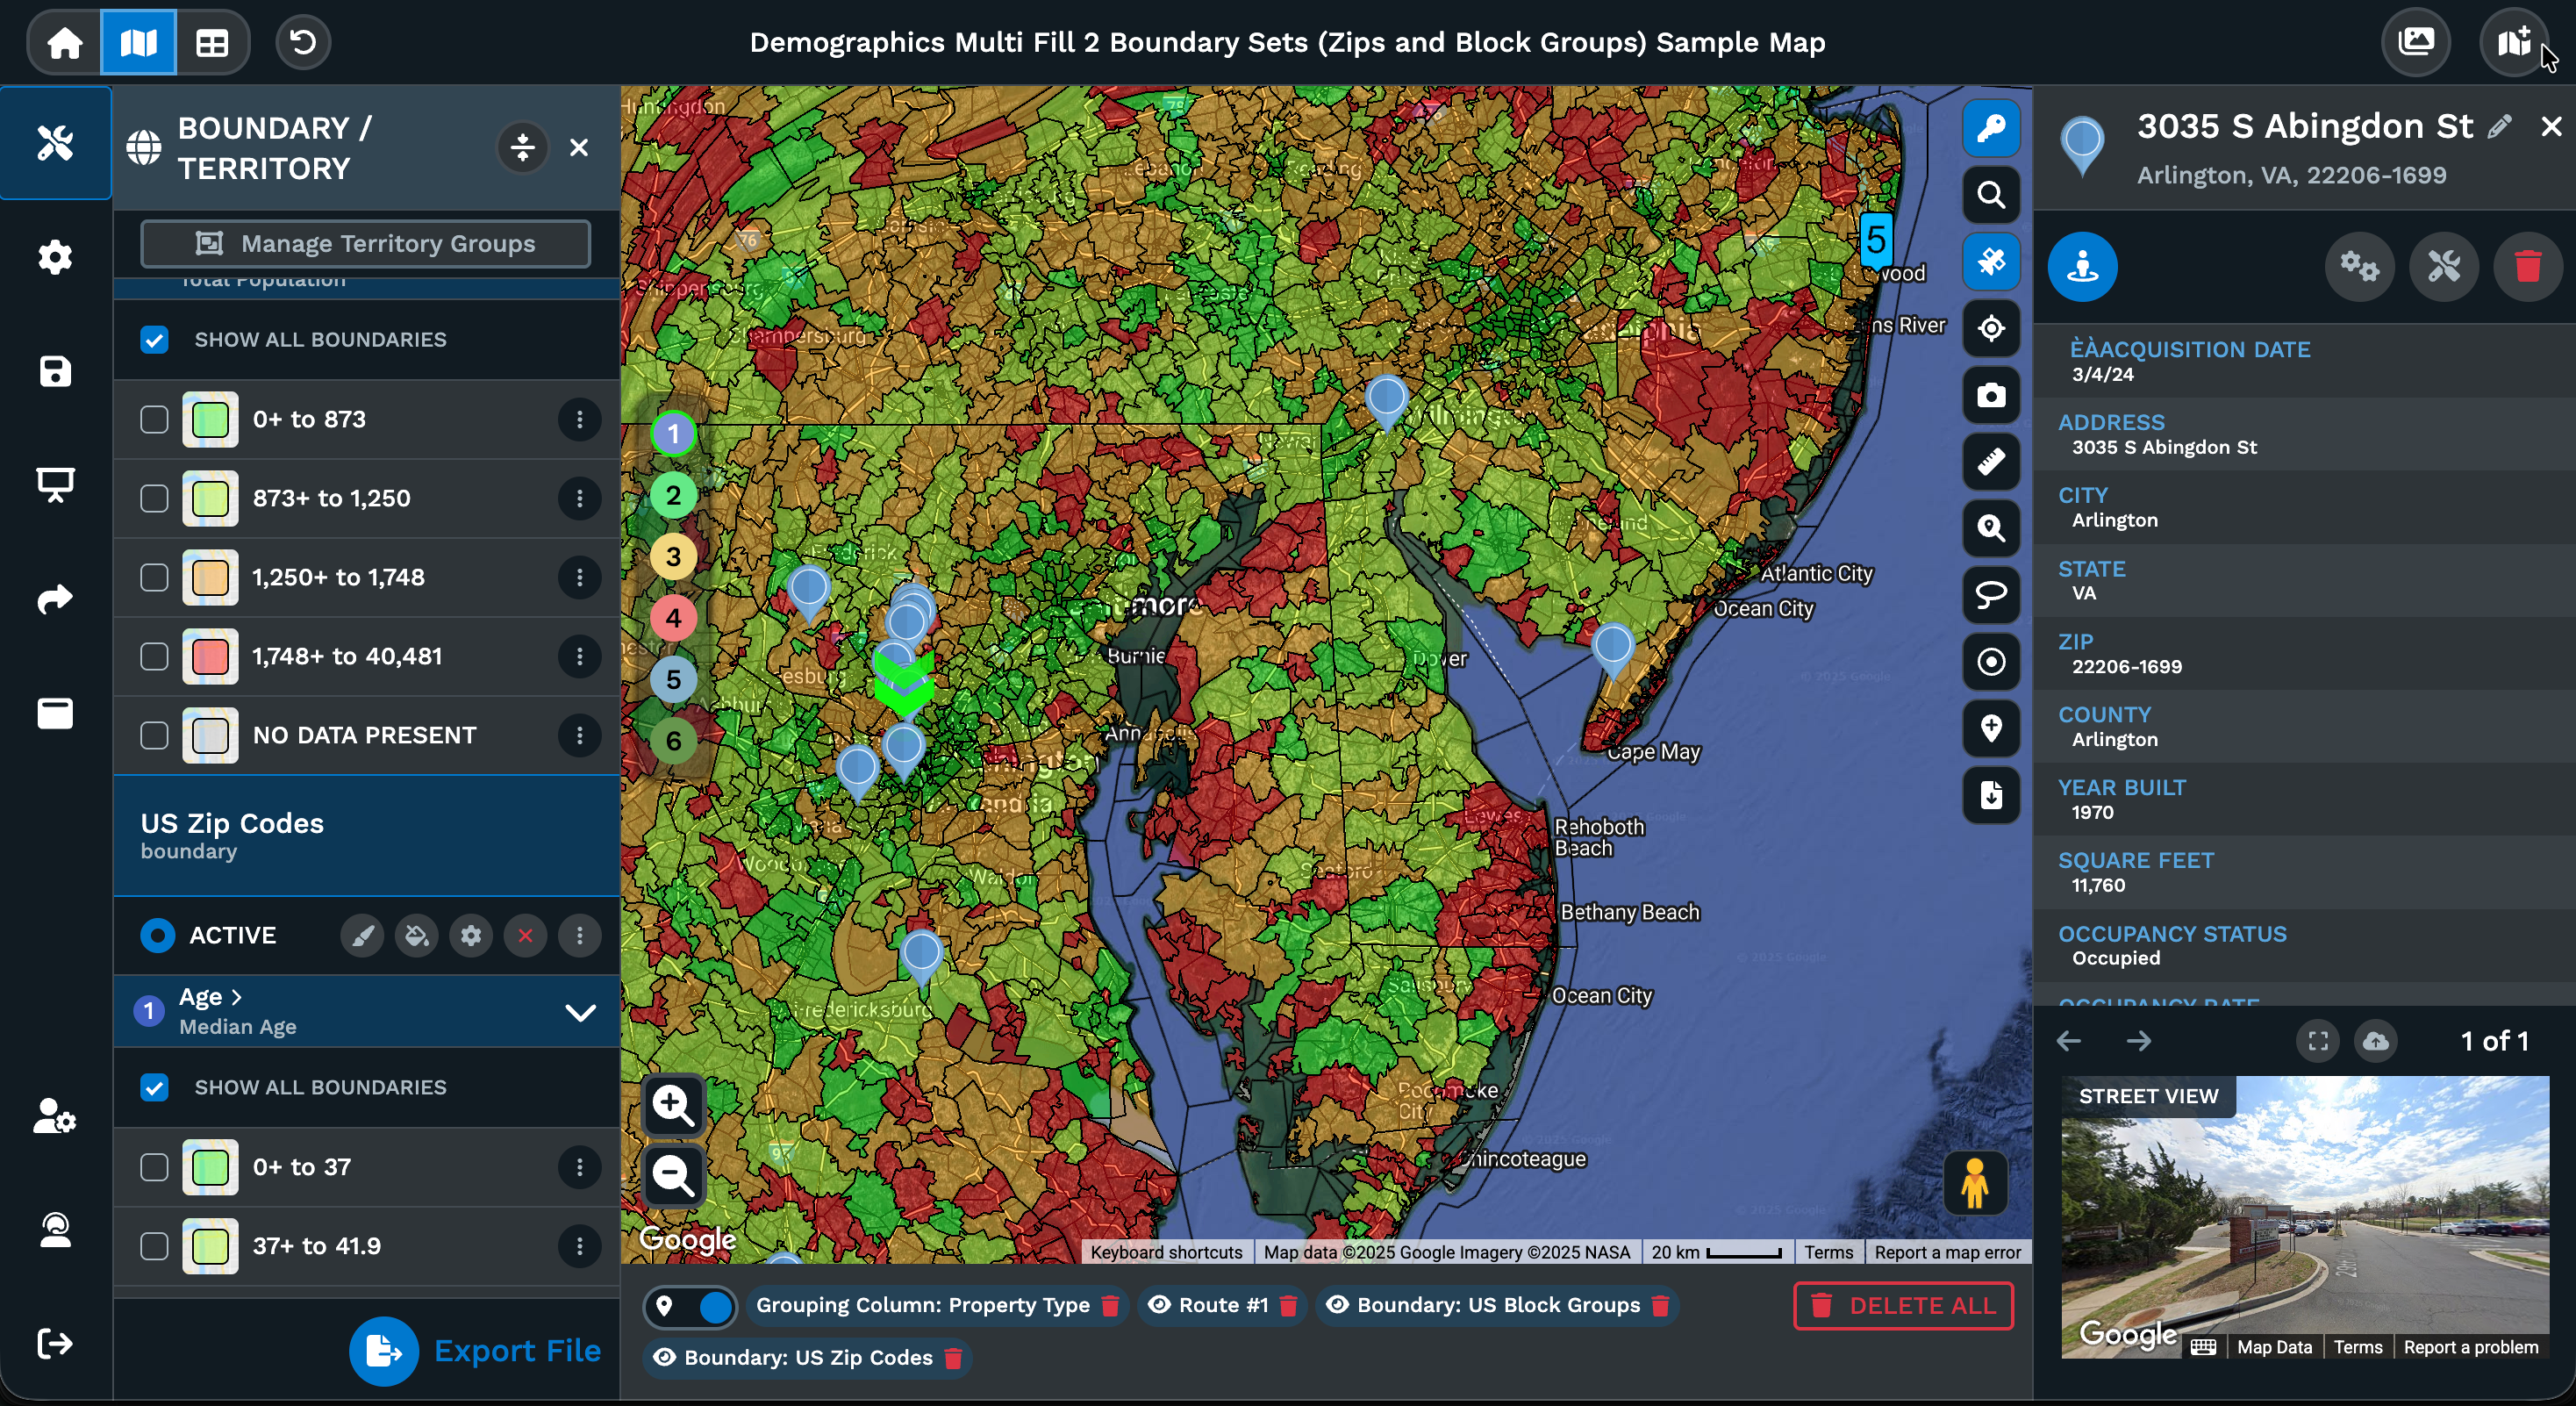
Create territories from your own data or Maptive's built-in geographic boundaries. Draw custom shapes, build from states, counties, zip codes, census tracts, or any boundary type. Easily modify and adjust territories based on your data with intuitive drag-and-drop editing.
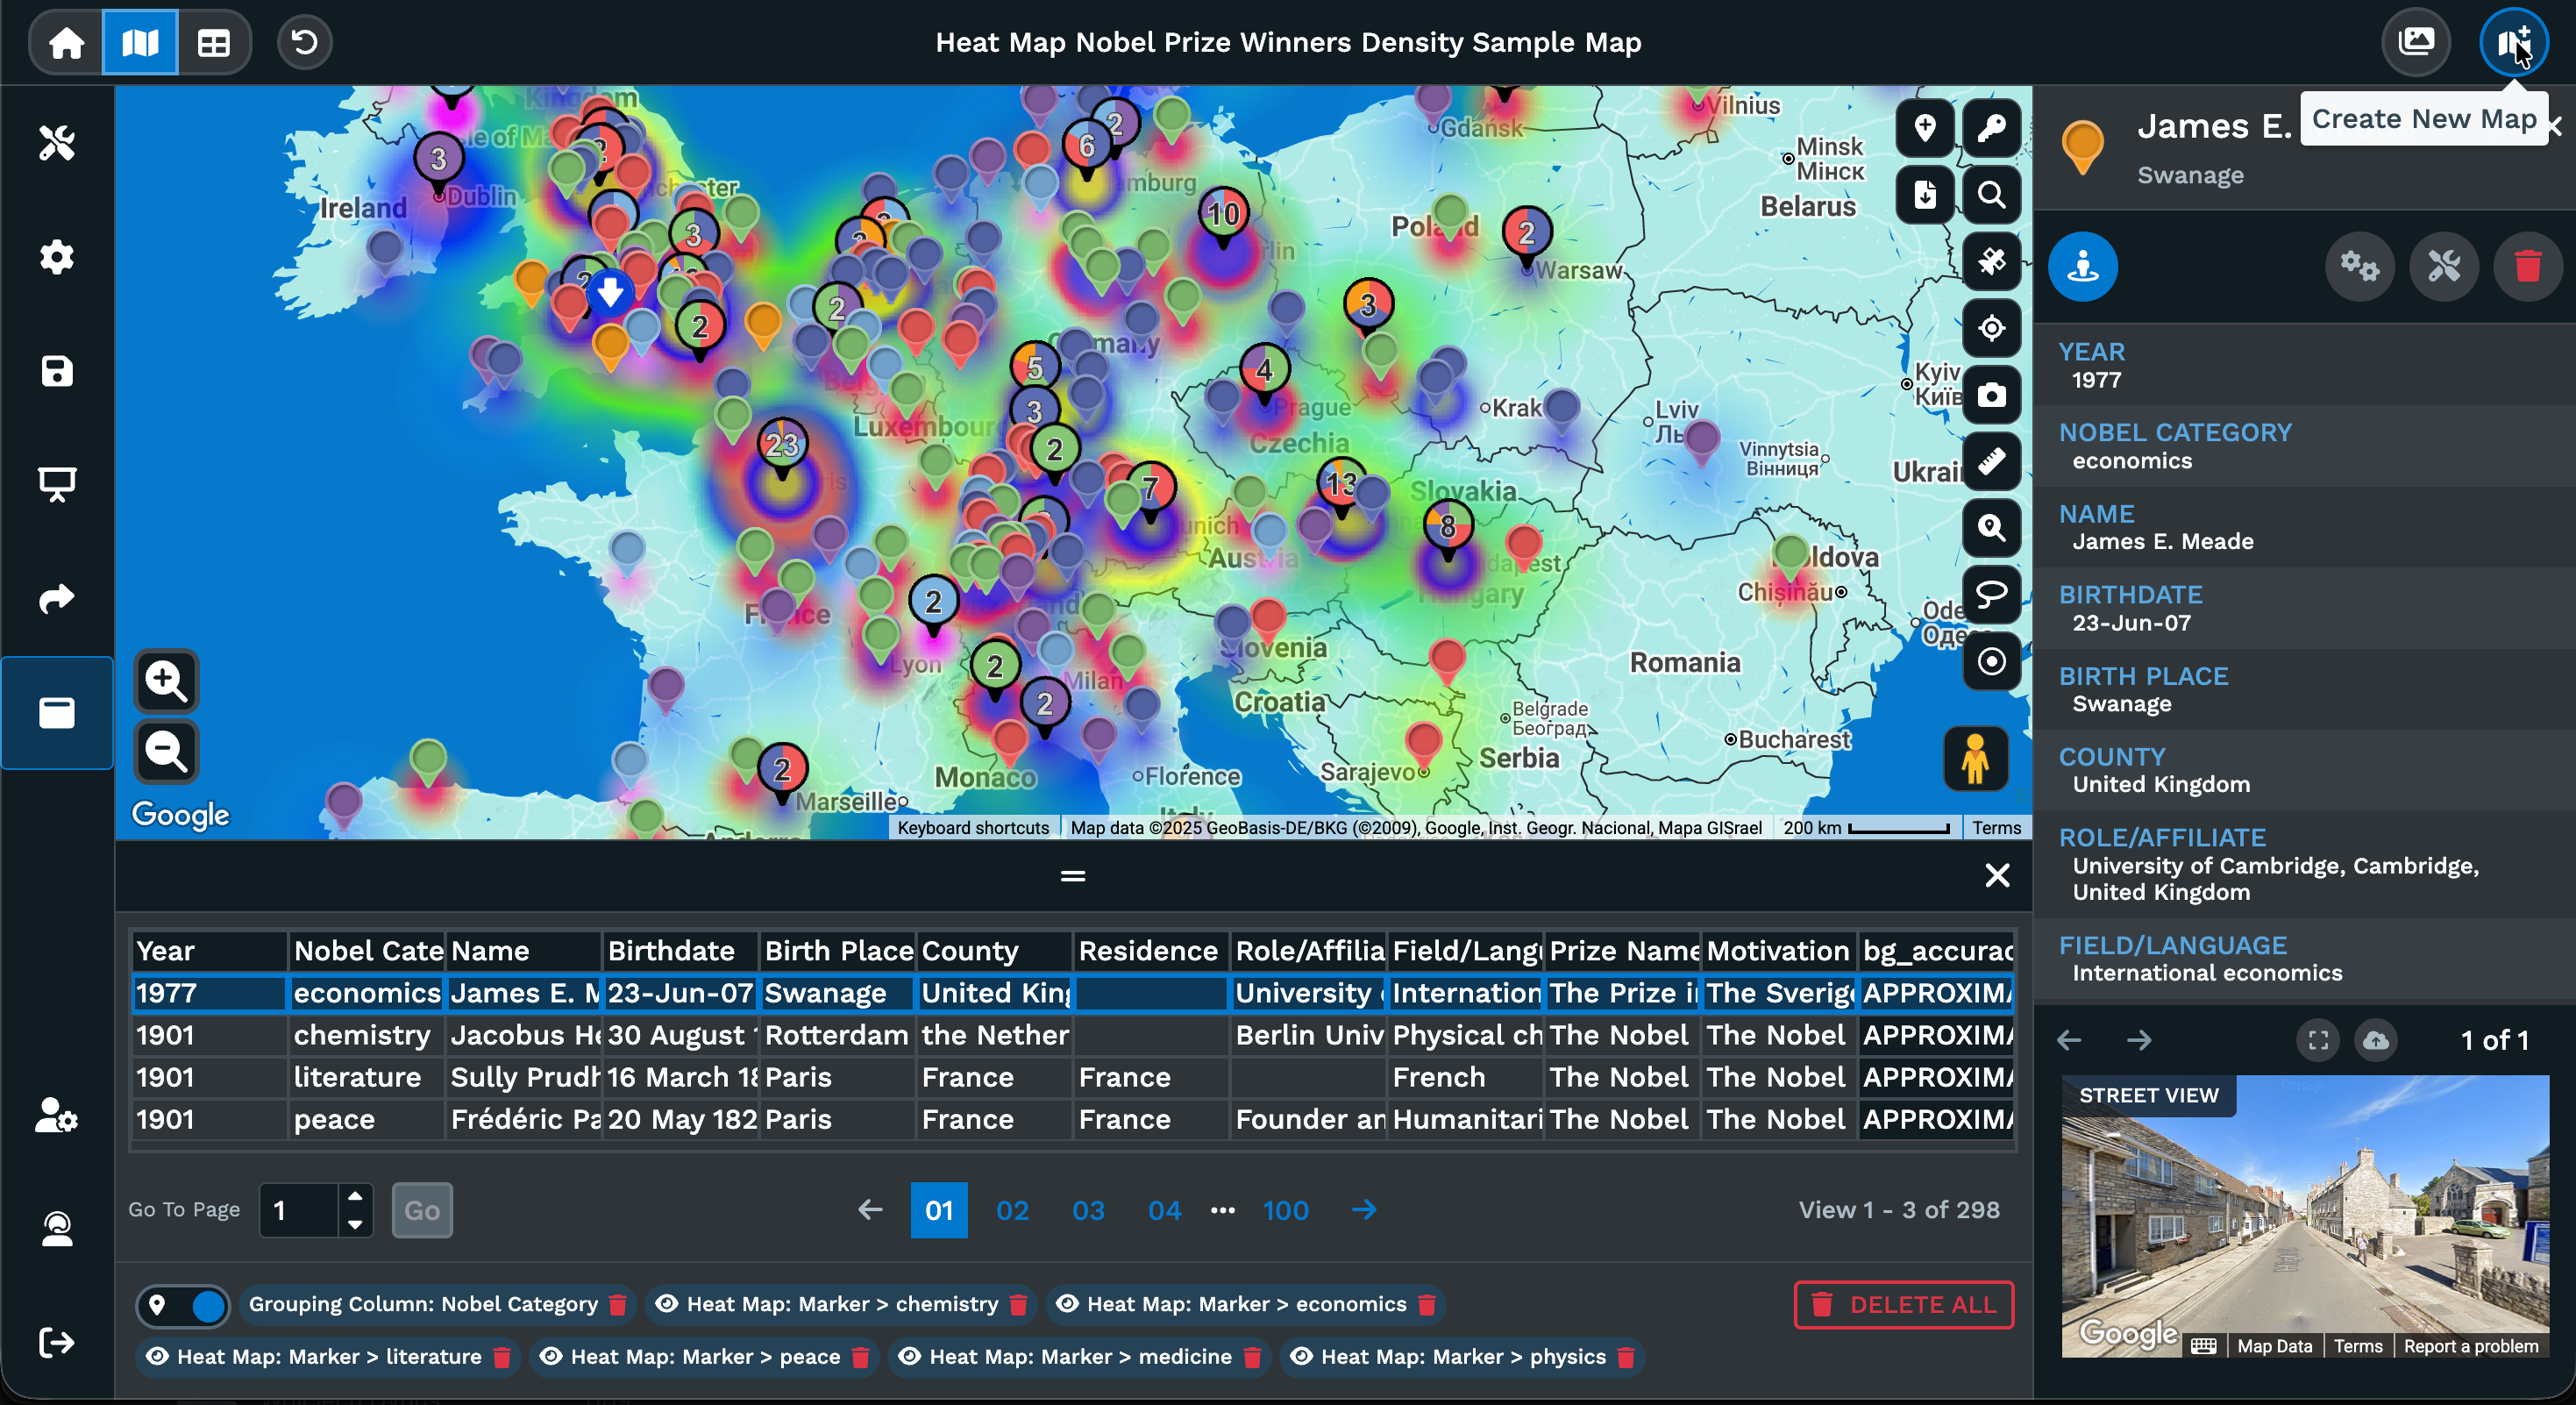
Heat Mapping
Visualize marker density or weighted data fields. Adjustable radius, opacity, and intensity parameters create gradient surfaces revealing concentration patterns.
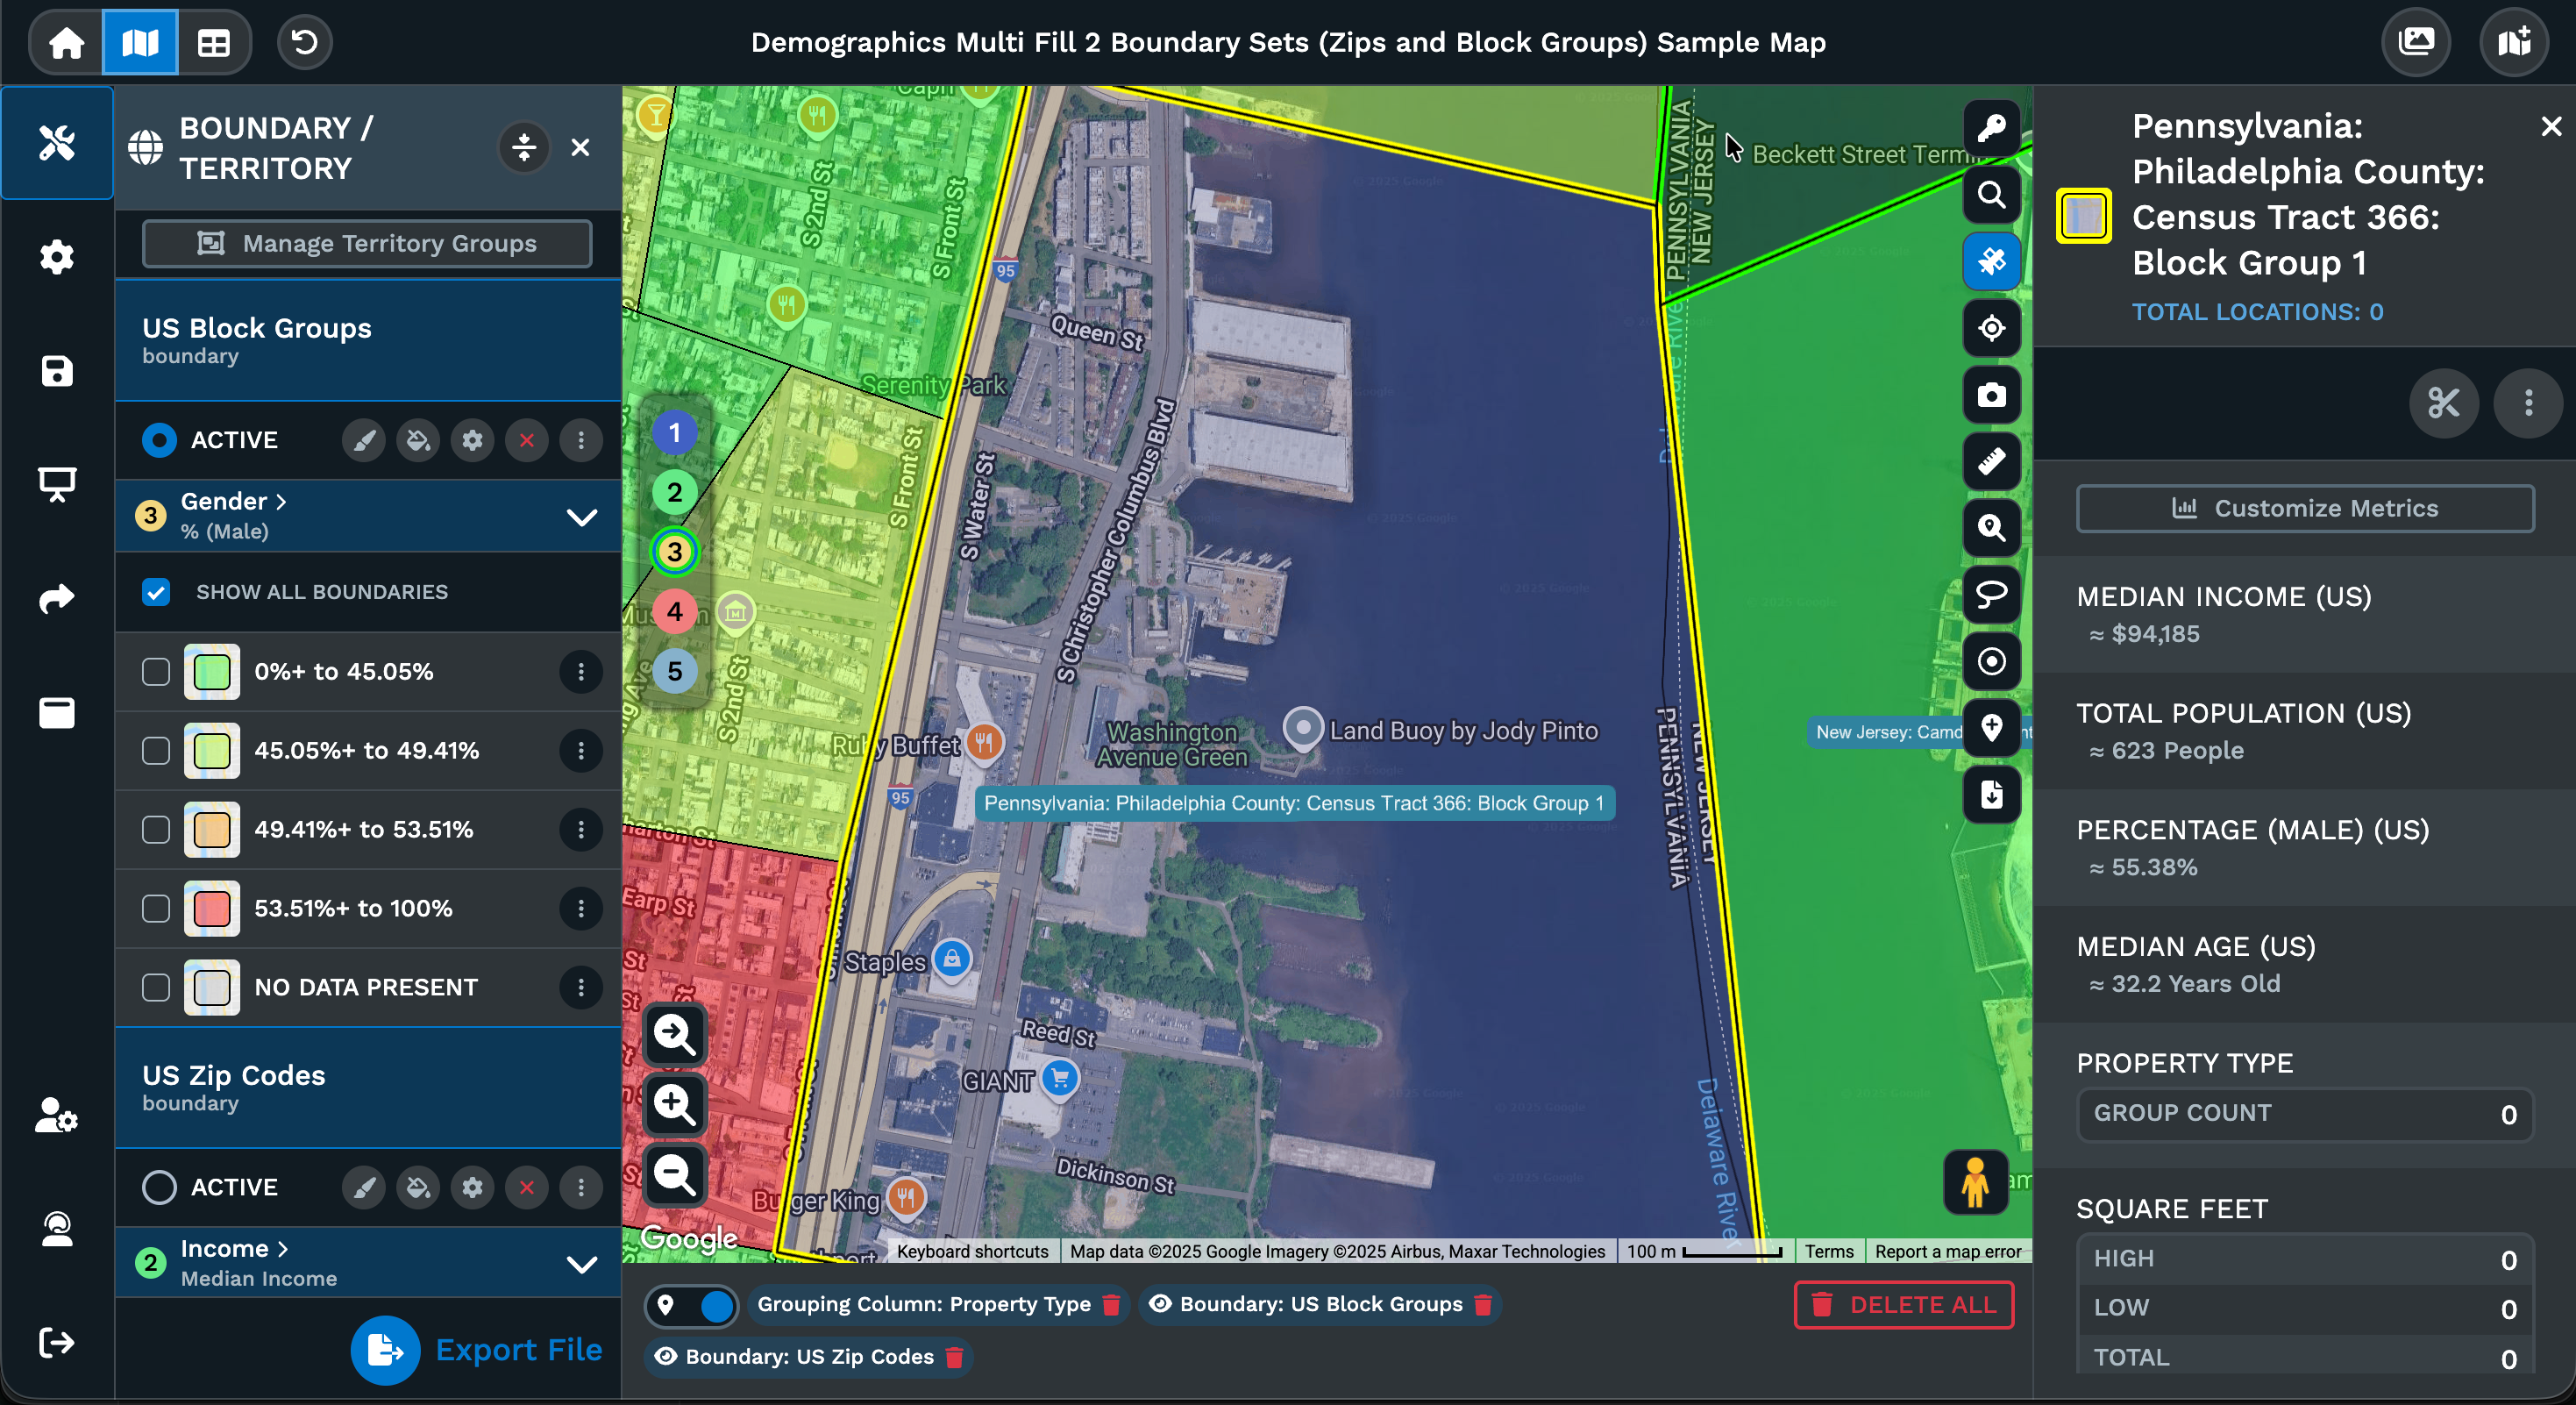
Demographics Tool
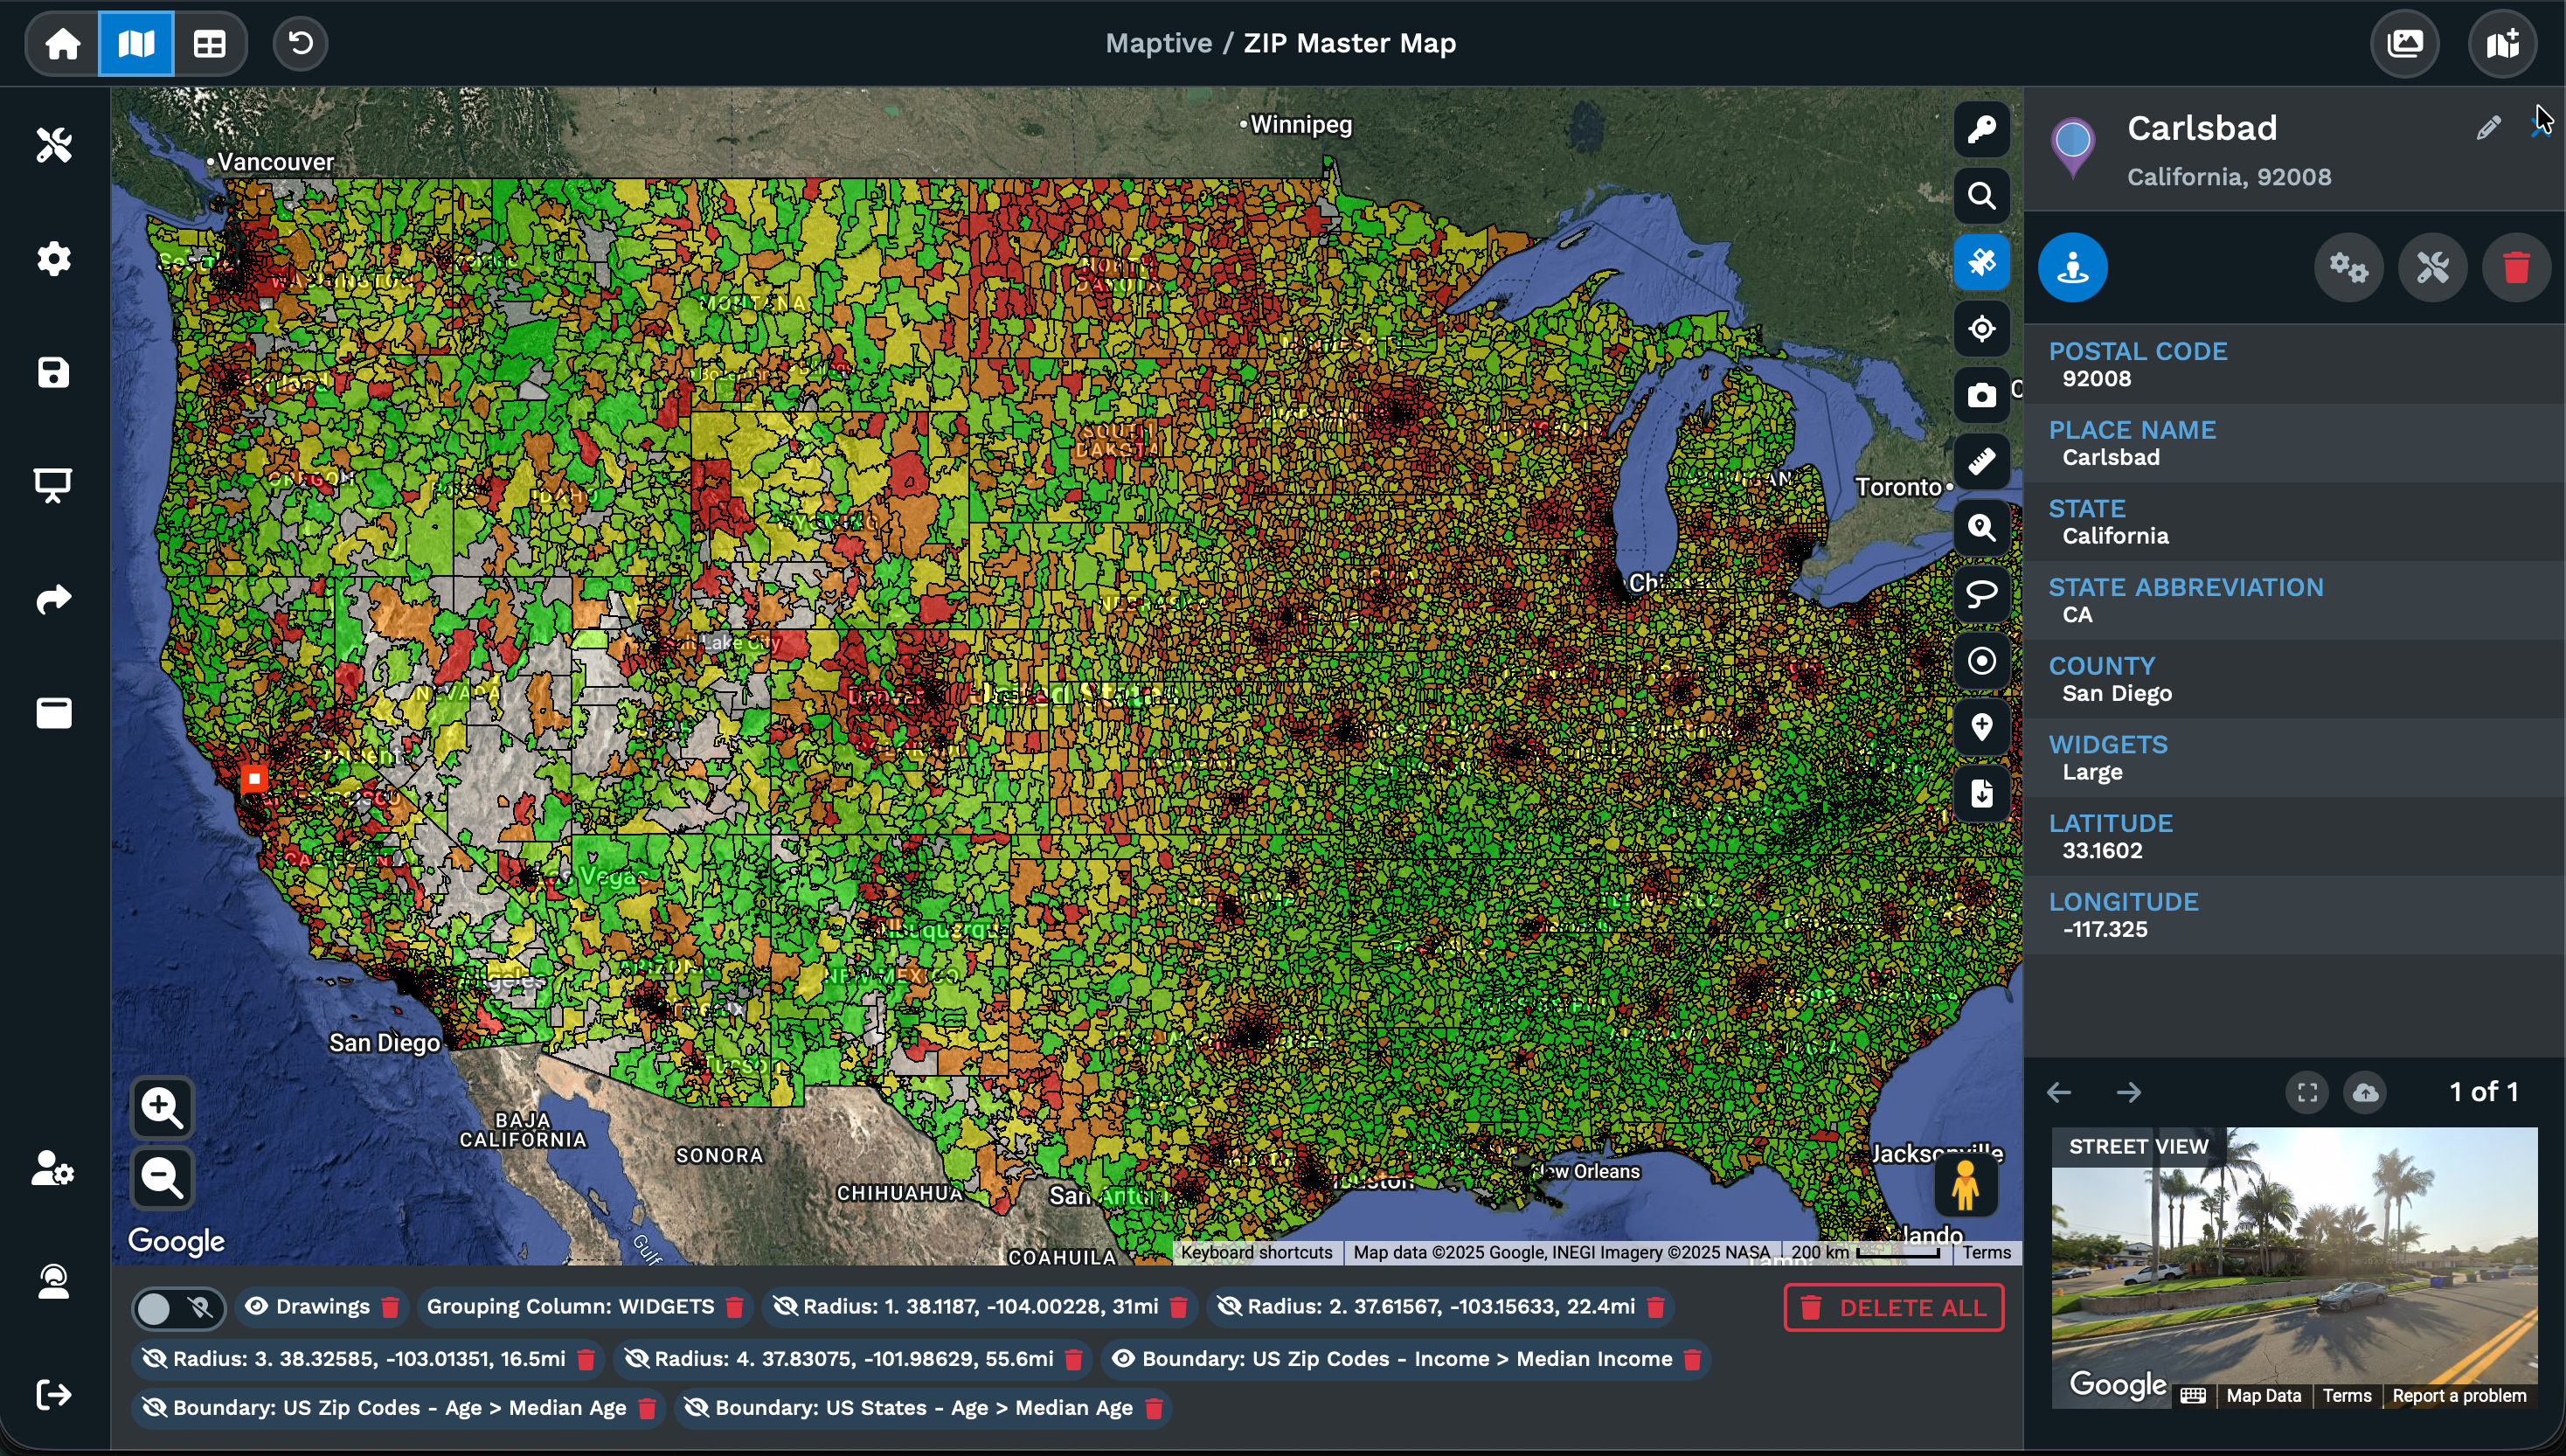
Integrate US Census data at state, county, zip, tract, and block group levels. 50+ variables including population, income, age, education, and ethnicity.
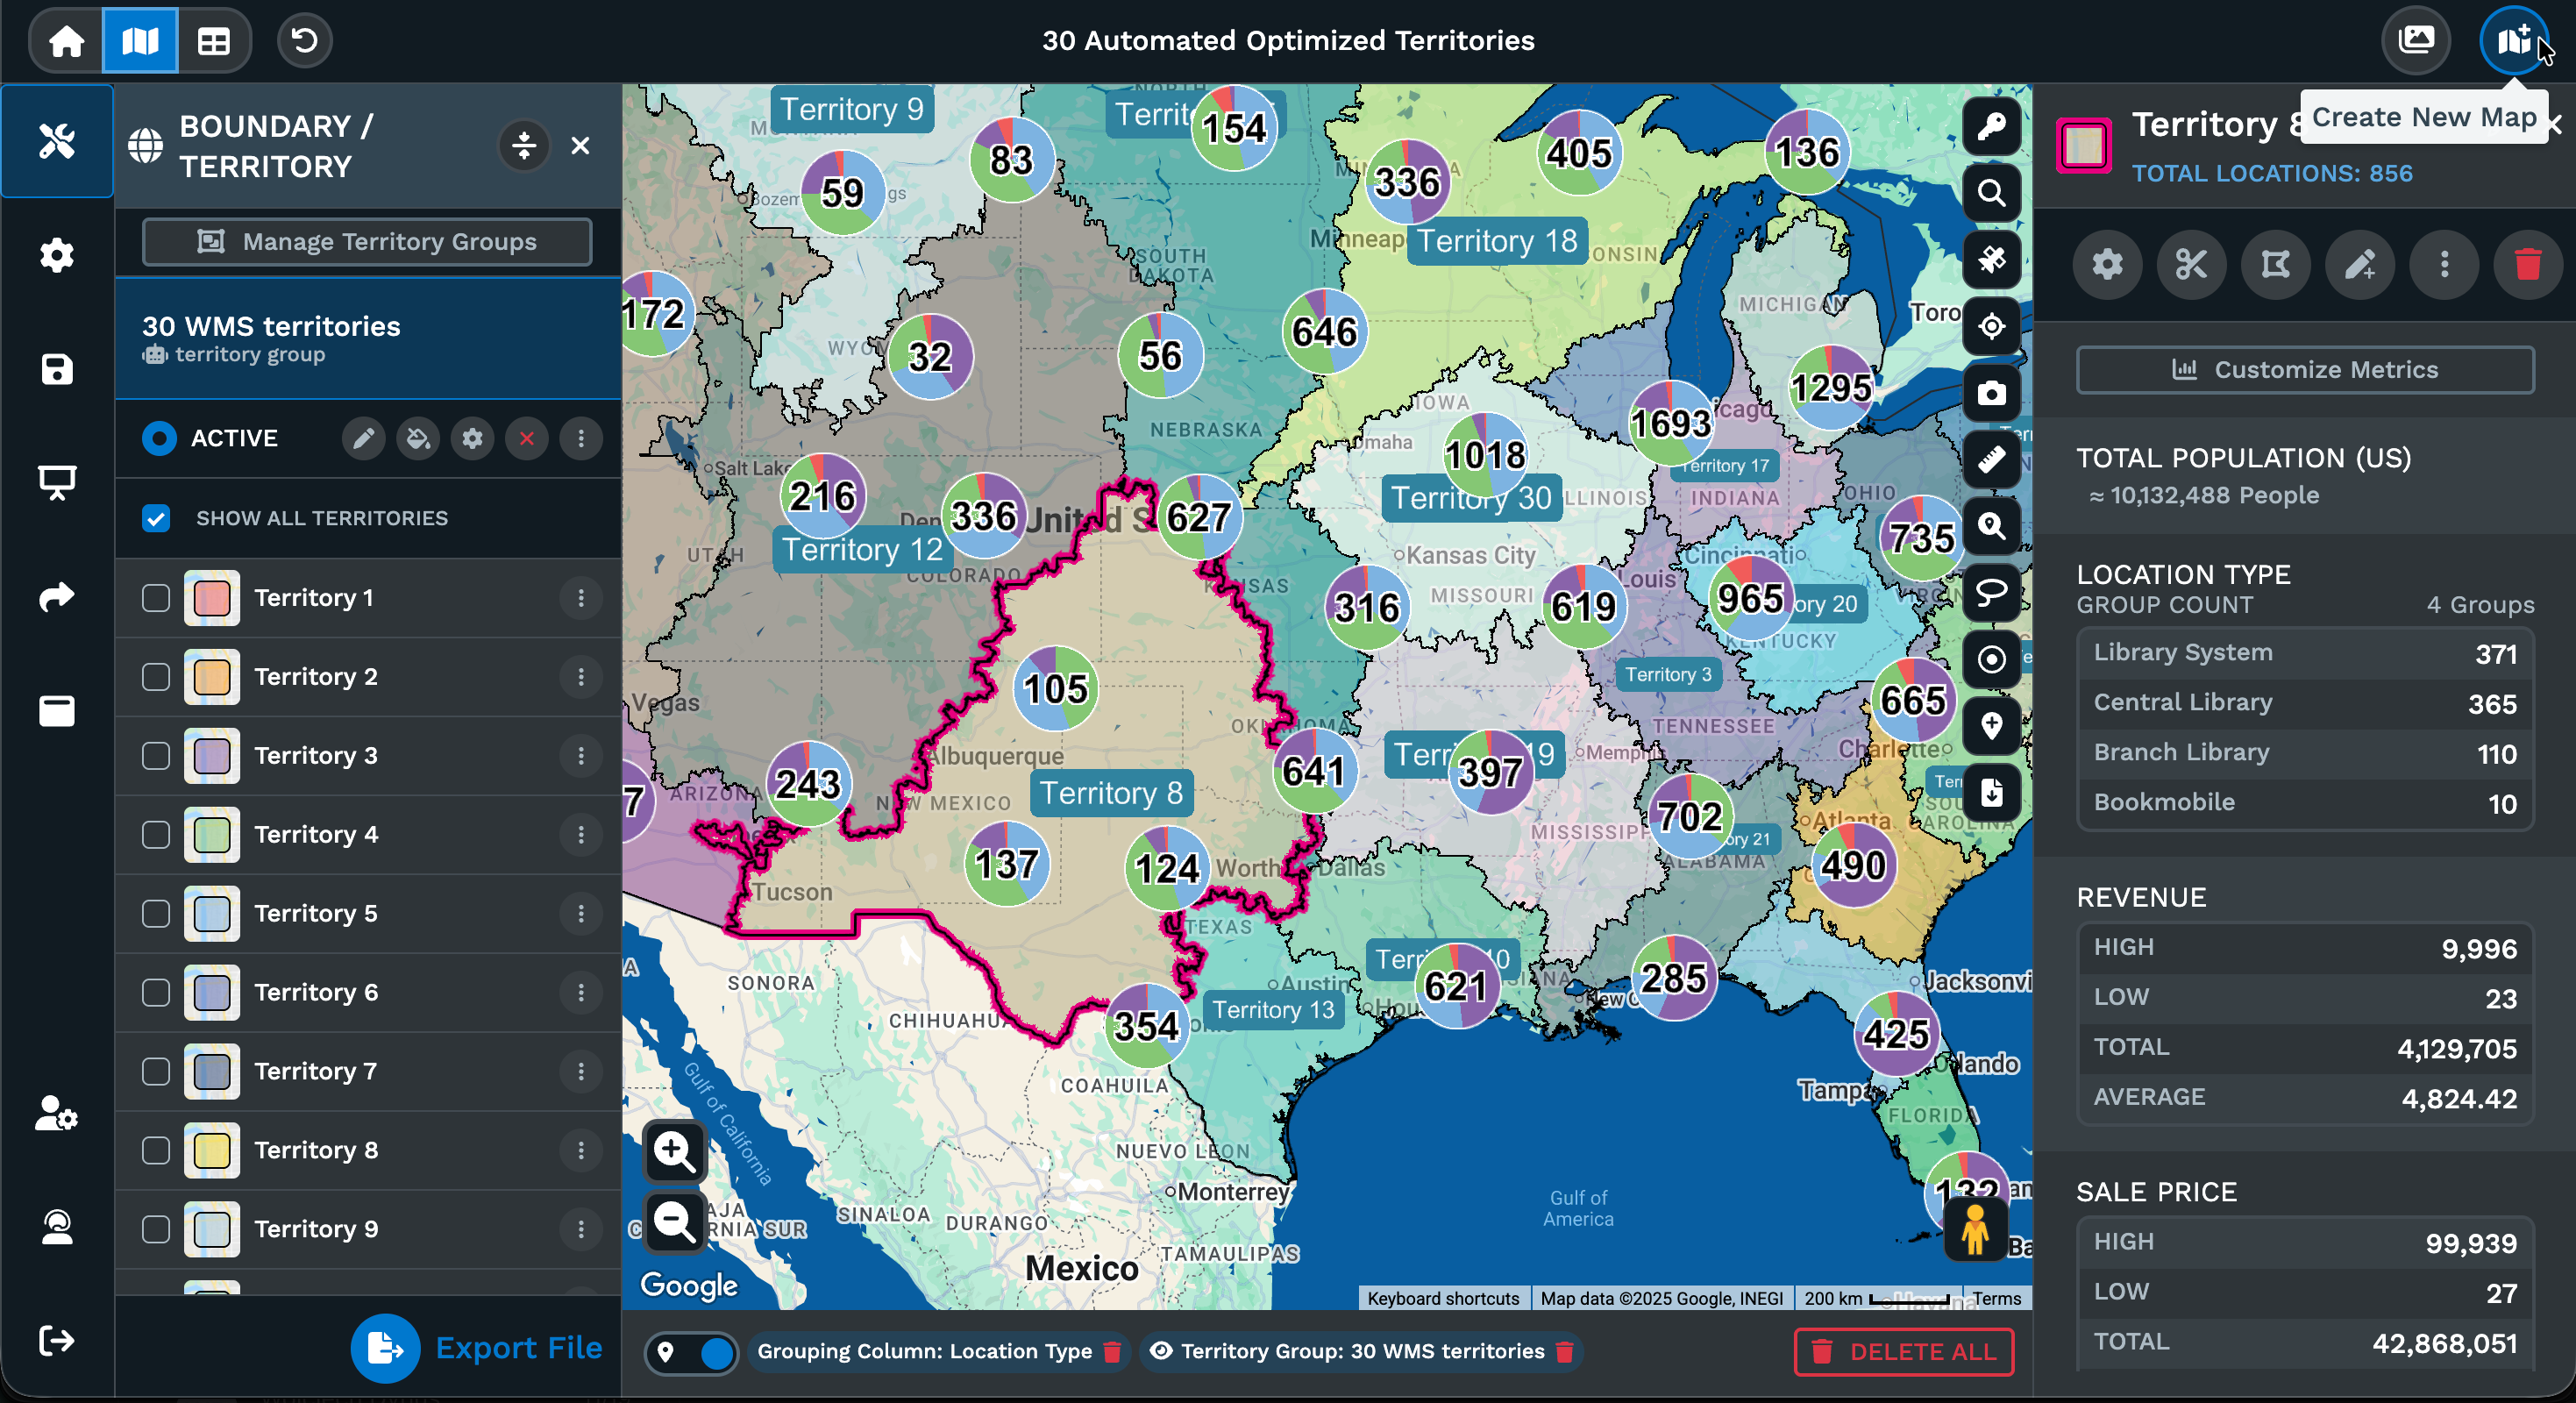
Automated Territories
Powerful AI-powered algorithm creates balanced, optimized territories from numerous geographic boundaries of your choice. Automatically factors salesperson locations, existing assignments, workload distribution, and multiple data fields to generate territories that maximize efficiency and coverage.
Analysis & Planning
Route Optimization
Multi-stop route planning with up to 73 stops per trip powered by Google's Vehicle Routing Problem (VRP) solver. Drag-and-drop customization, automatic path optimization, and turn-by-turn navigation exports.
Distance Calculator
Calculate distances between two or more locations instantly. Distance matrix calculator (beta) handles multiple point comparisons for sales assignment.
Filter Tool
Refine displayed data using categories, number ranges, dates, and custom criteria. Filter results update map visualization in real time.
Lasso Selection
Draw freeform selections around locations to edit data, plan routes, or export segments. Select irregular areas that other tools cannot capture.
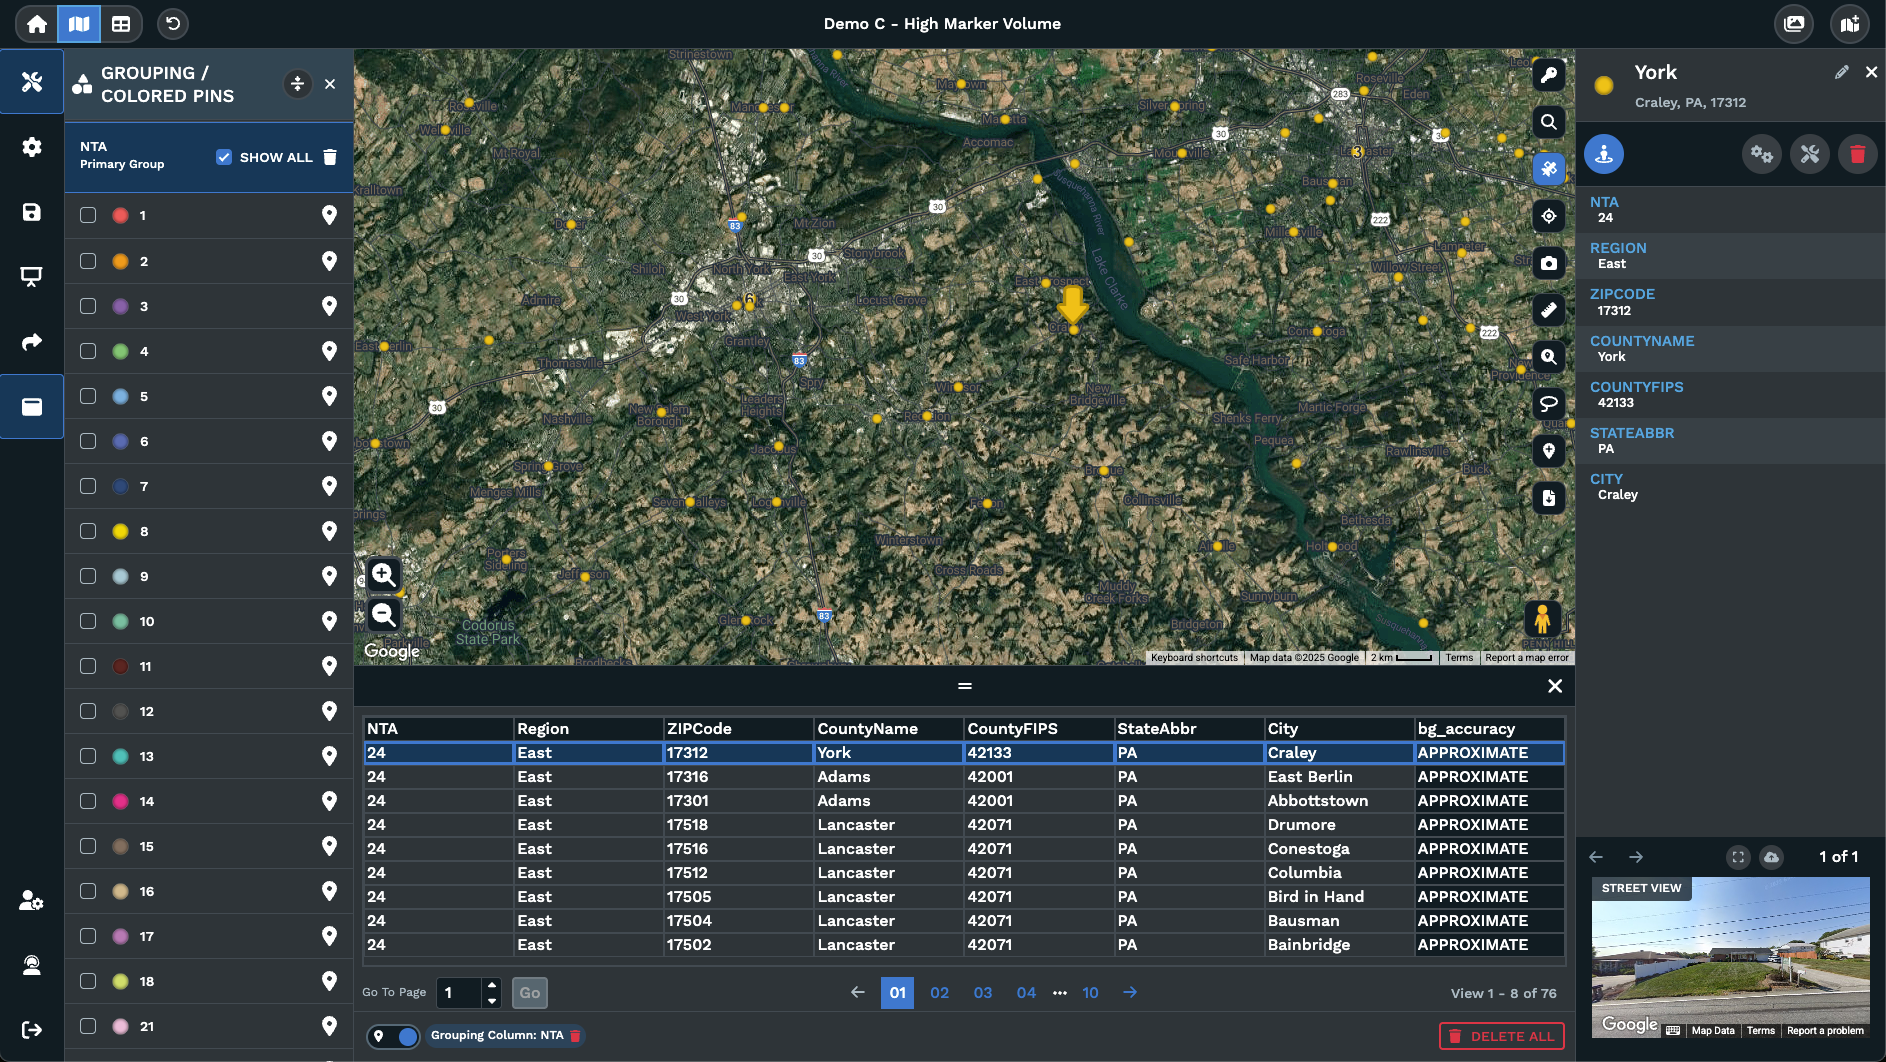
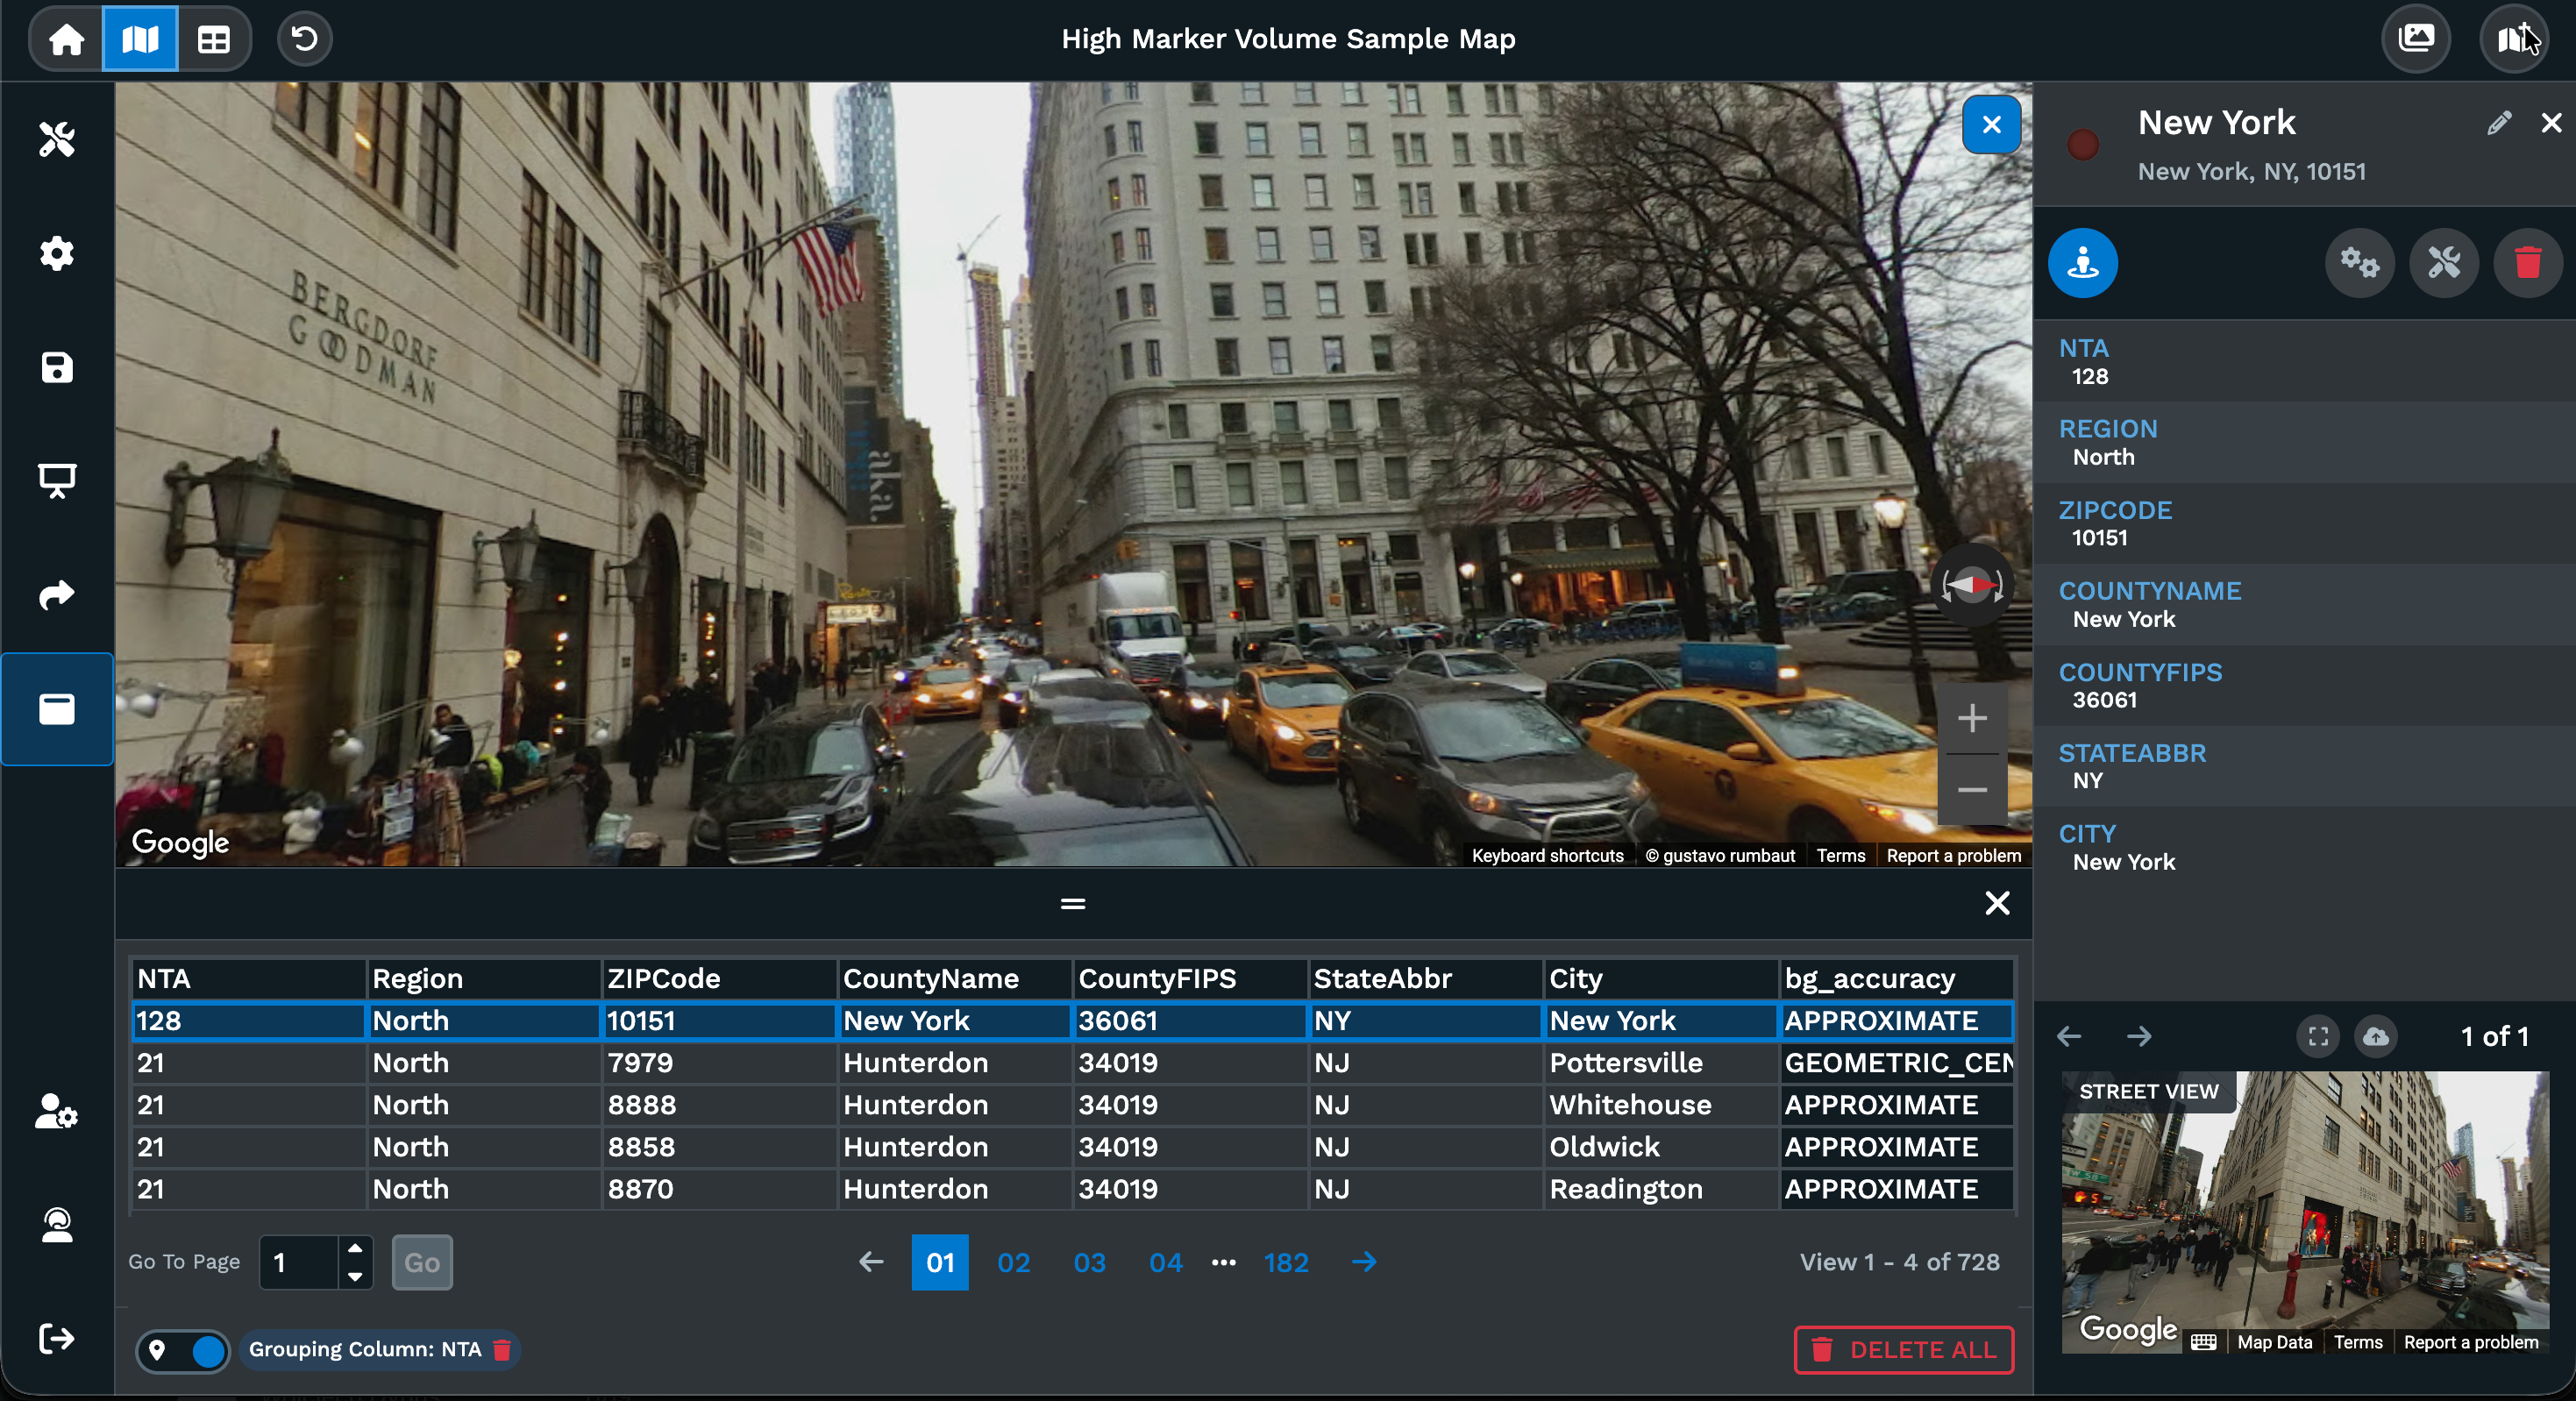
Split-Screen View
View maps and spreadsheets simultaneously. Edit data while observing map changes in real time. Introduced with Maptive iQ release.
Location Finder
Generate distance lists from any address to all mapped locations. Useful for finding nearest stores, facilities, or service points.
Visualization & Presentation
Custom Markers
Fully customizable markers with any color you choose. Upload custom images for branded markers, adjust sizes individually, and control every visual aspect. Extensive marker library included with unlimited customization options.
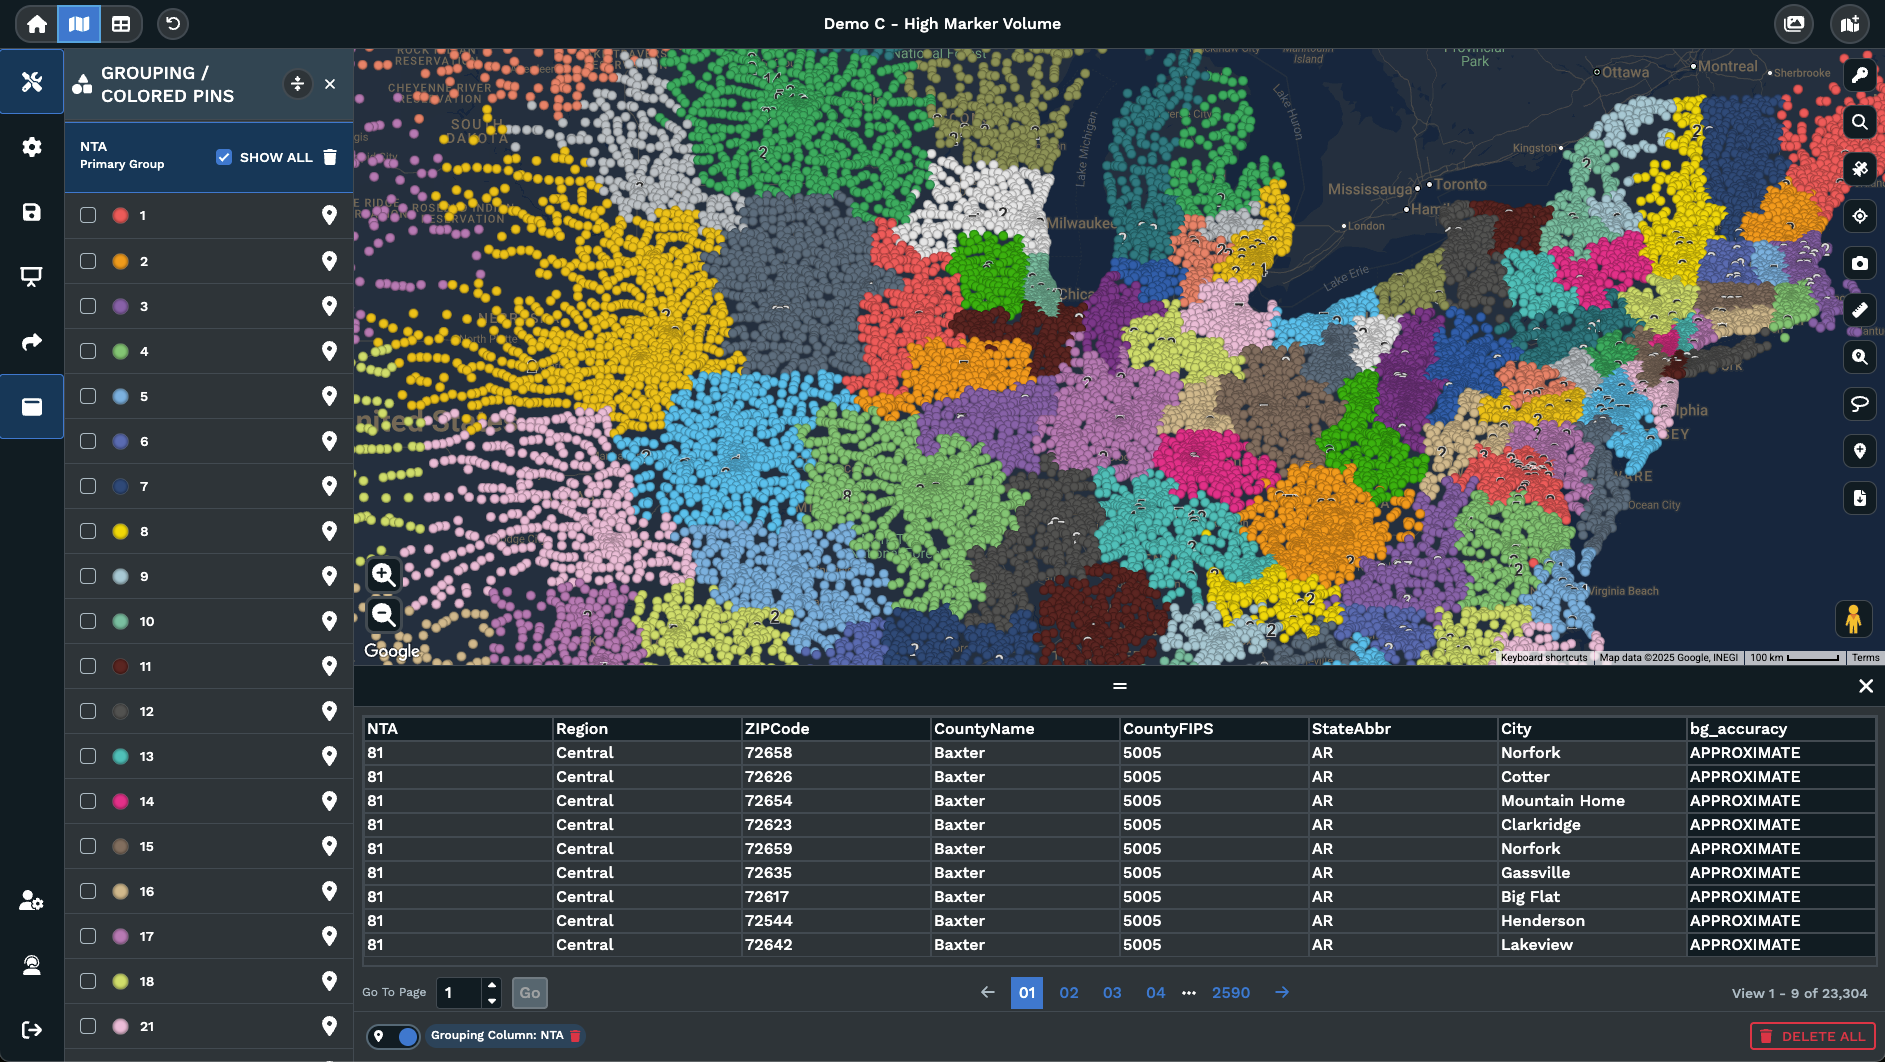
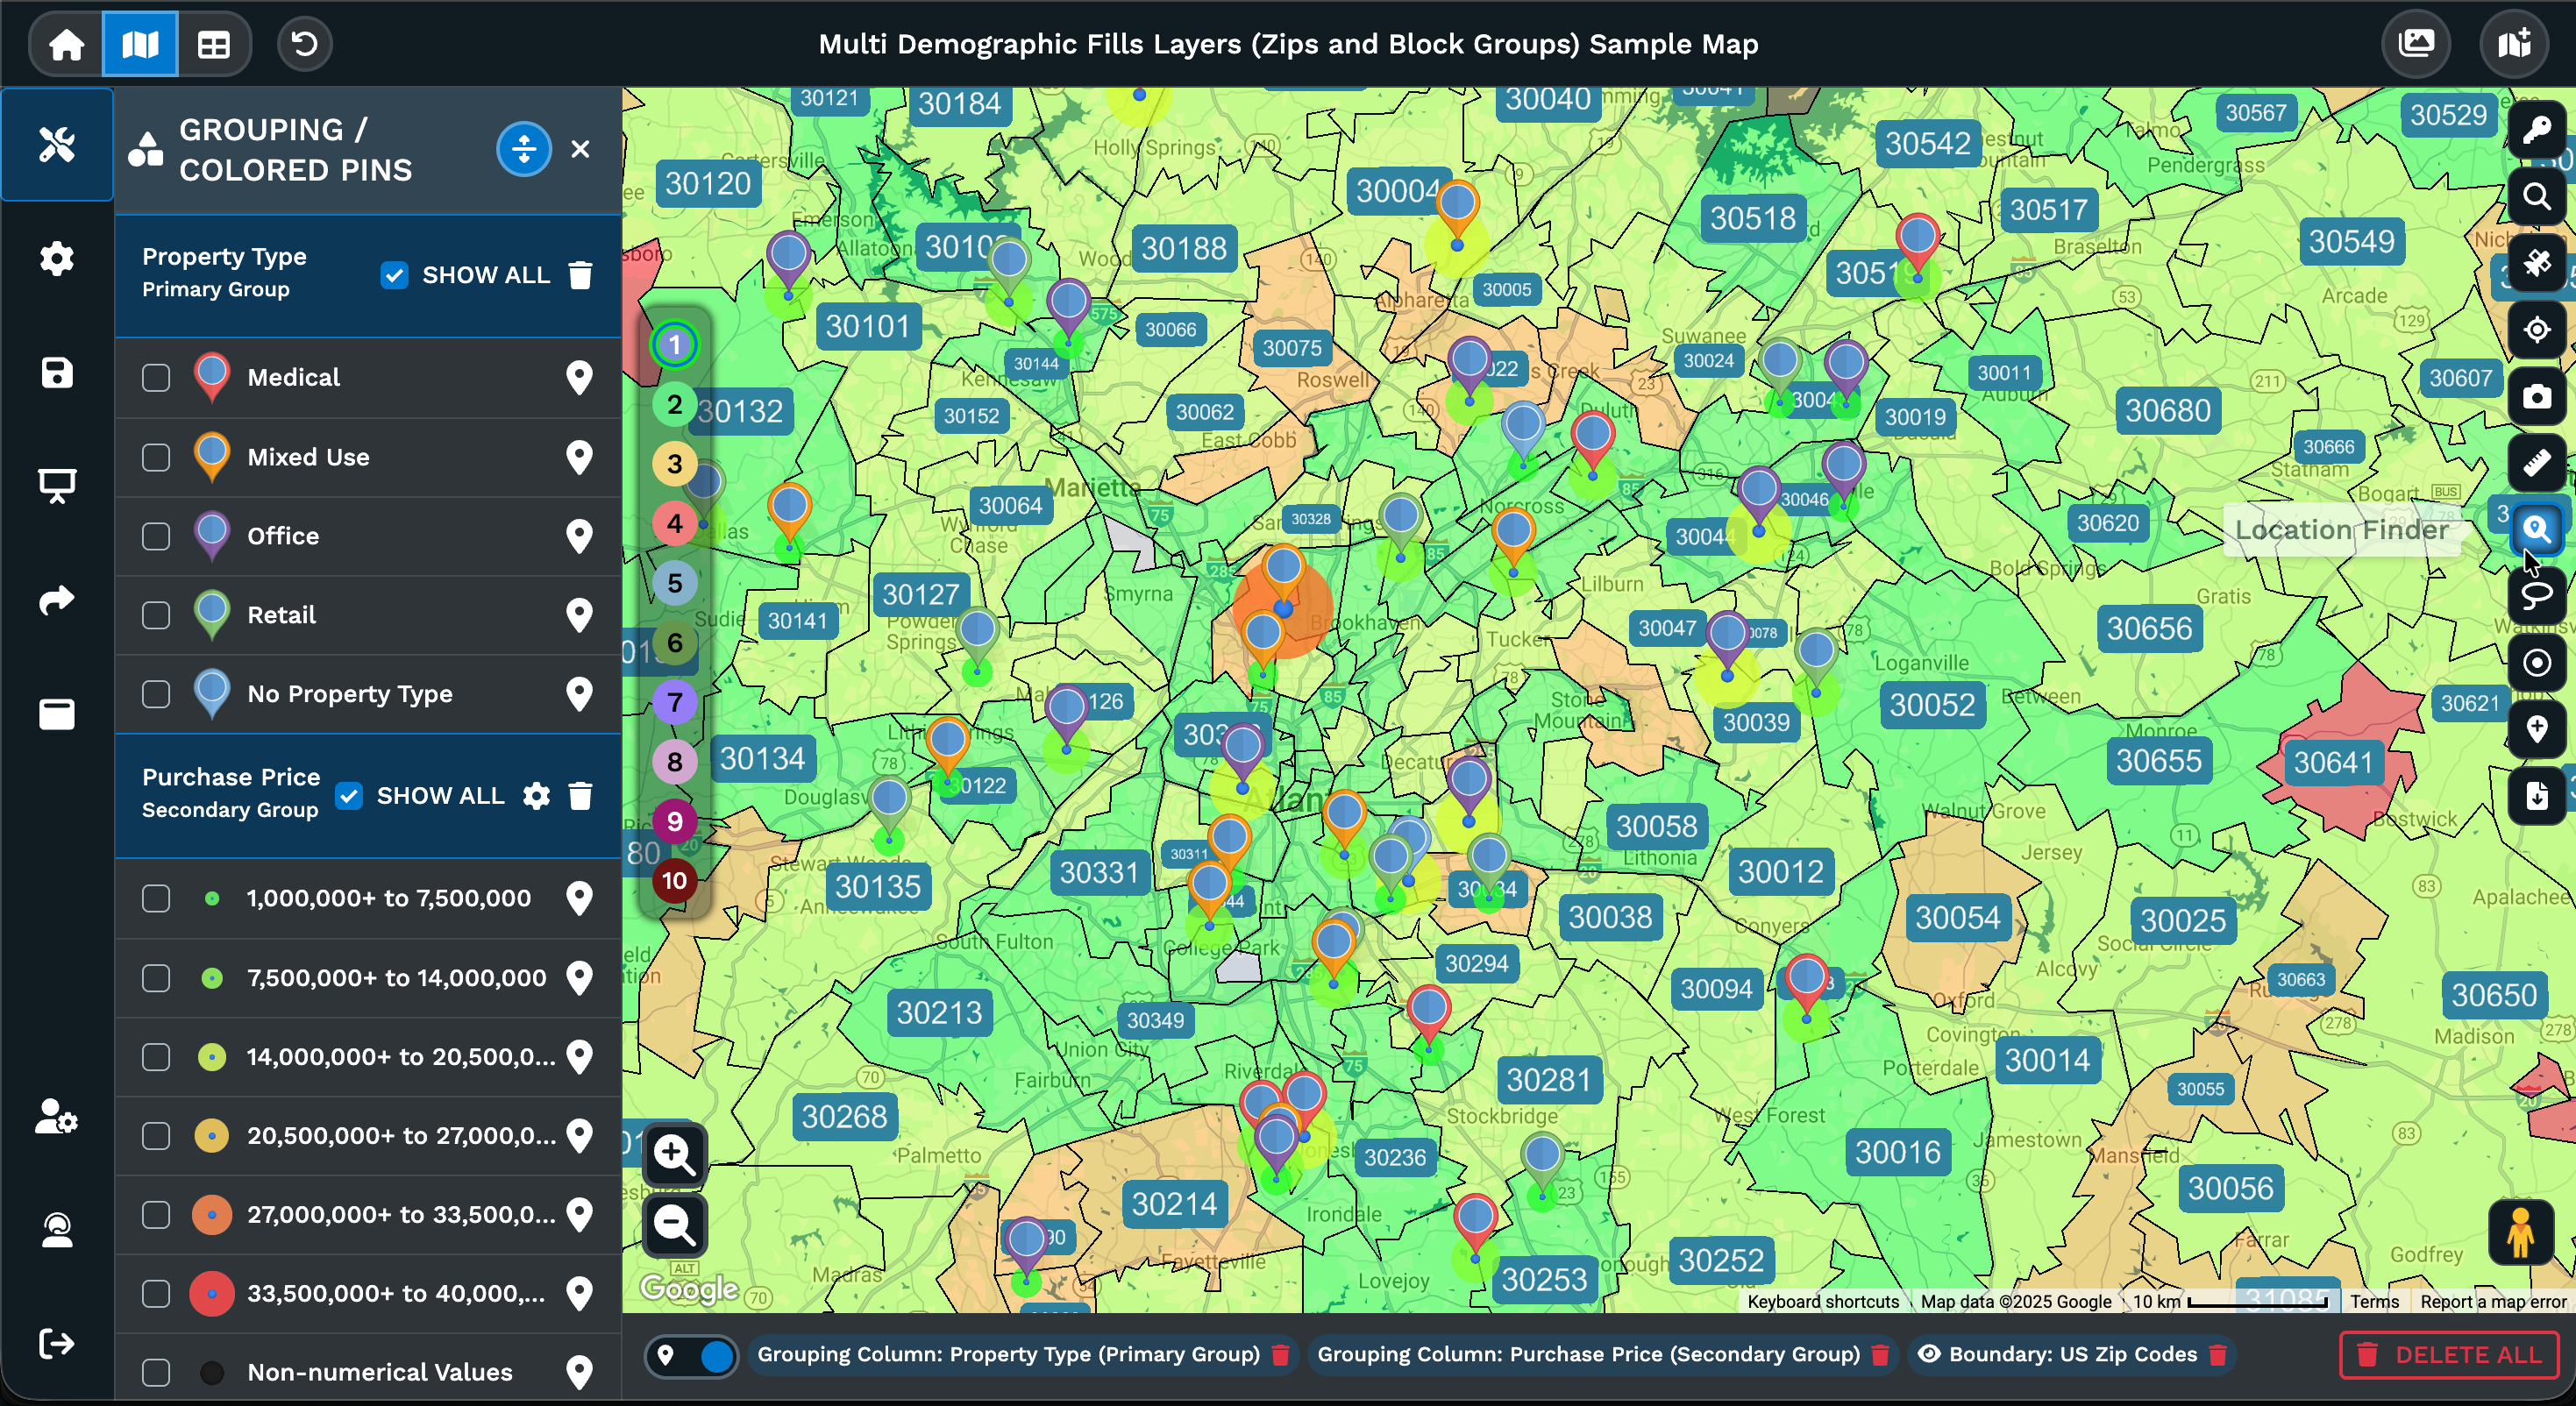
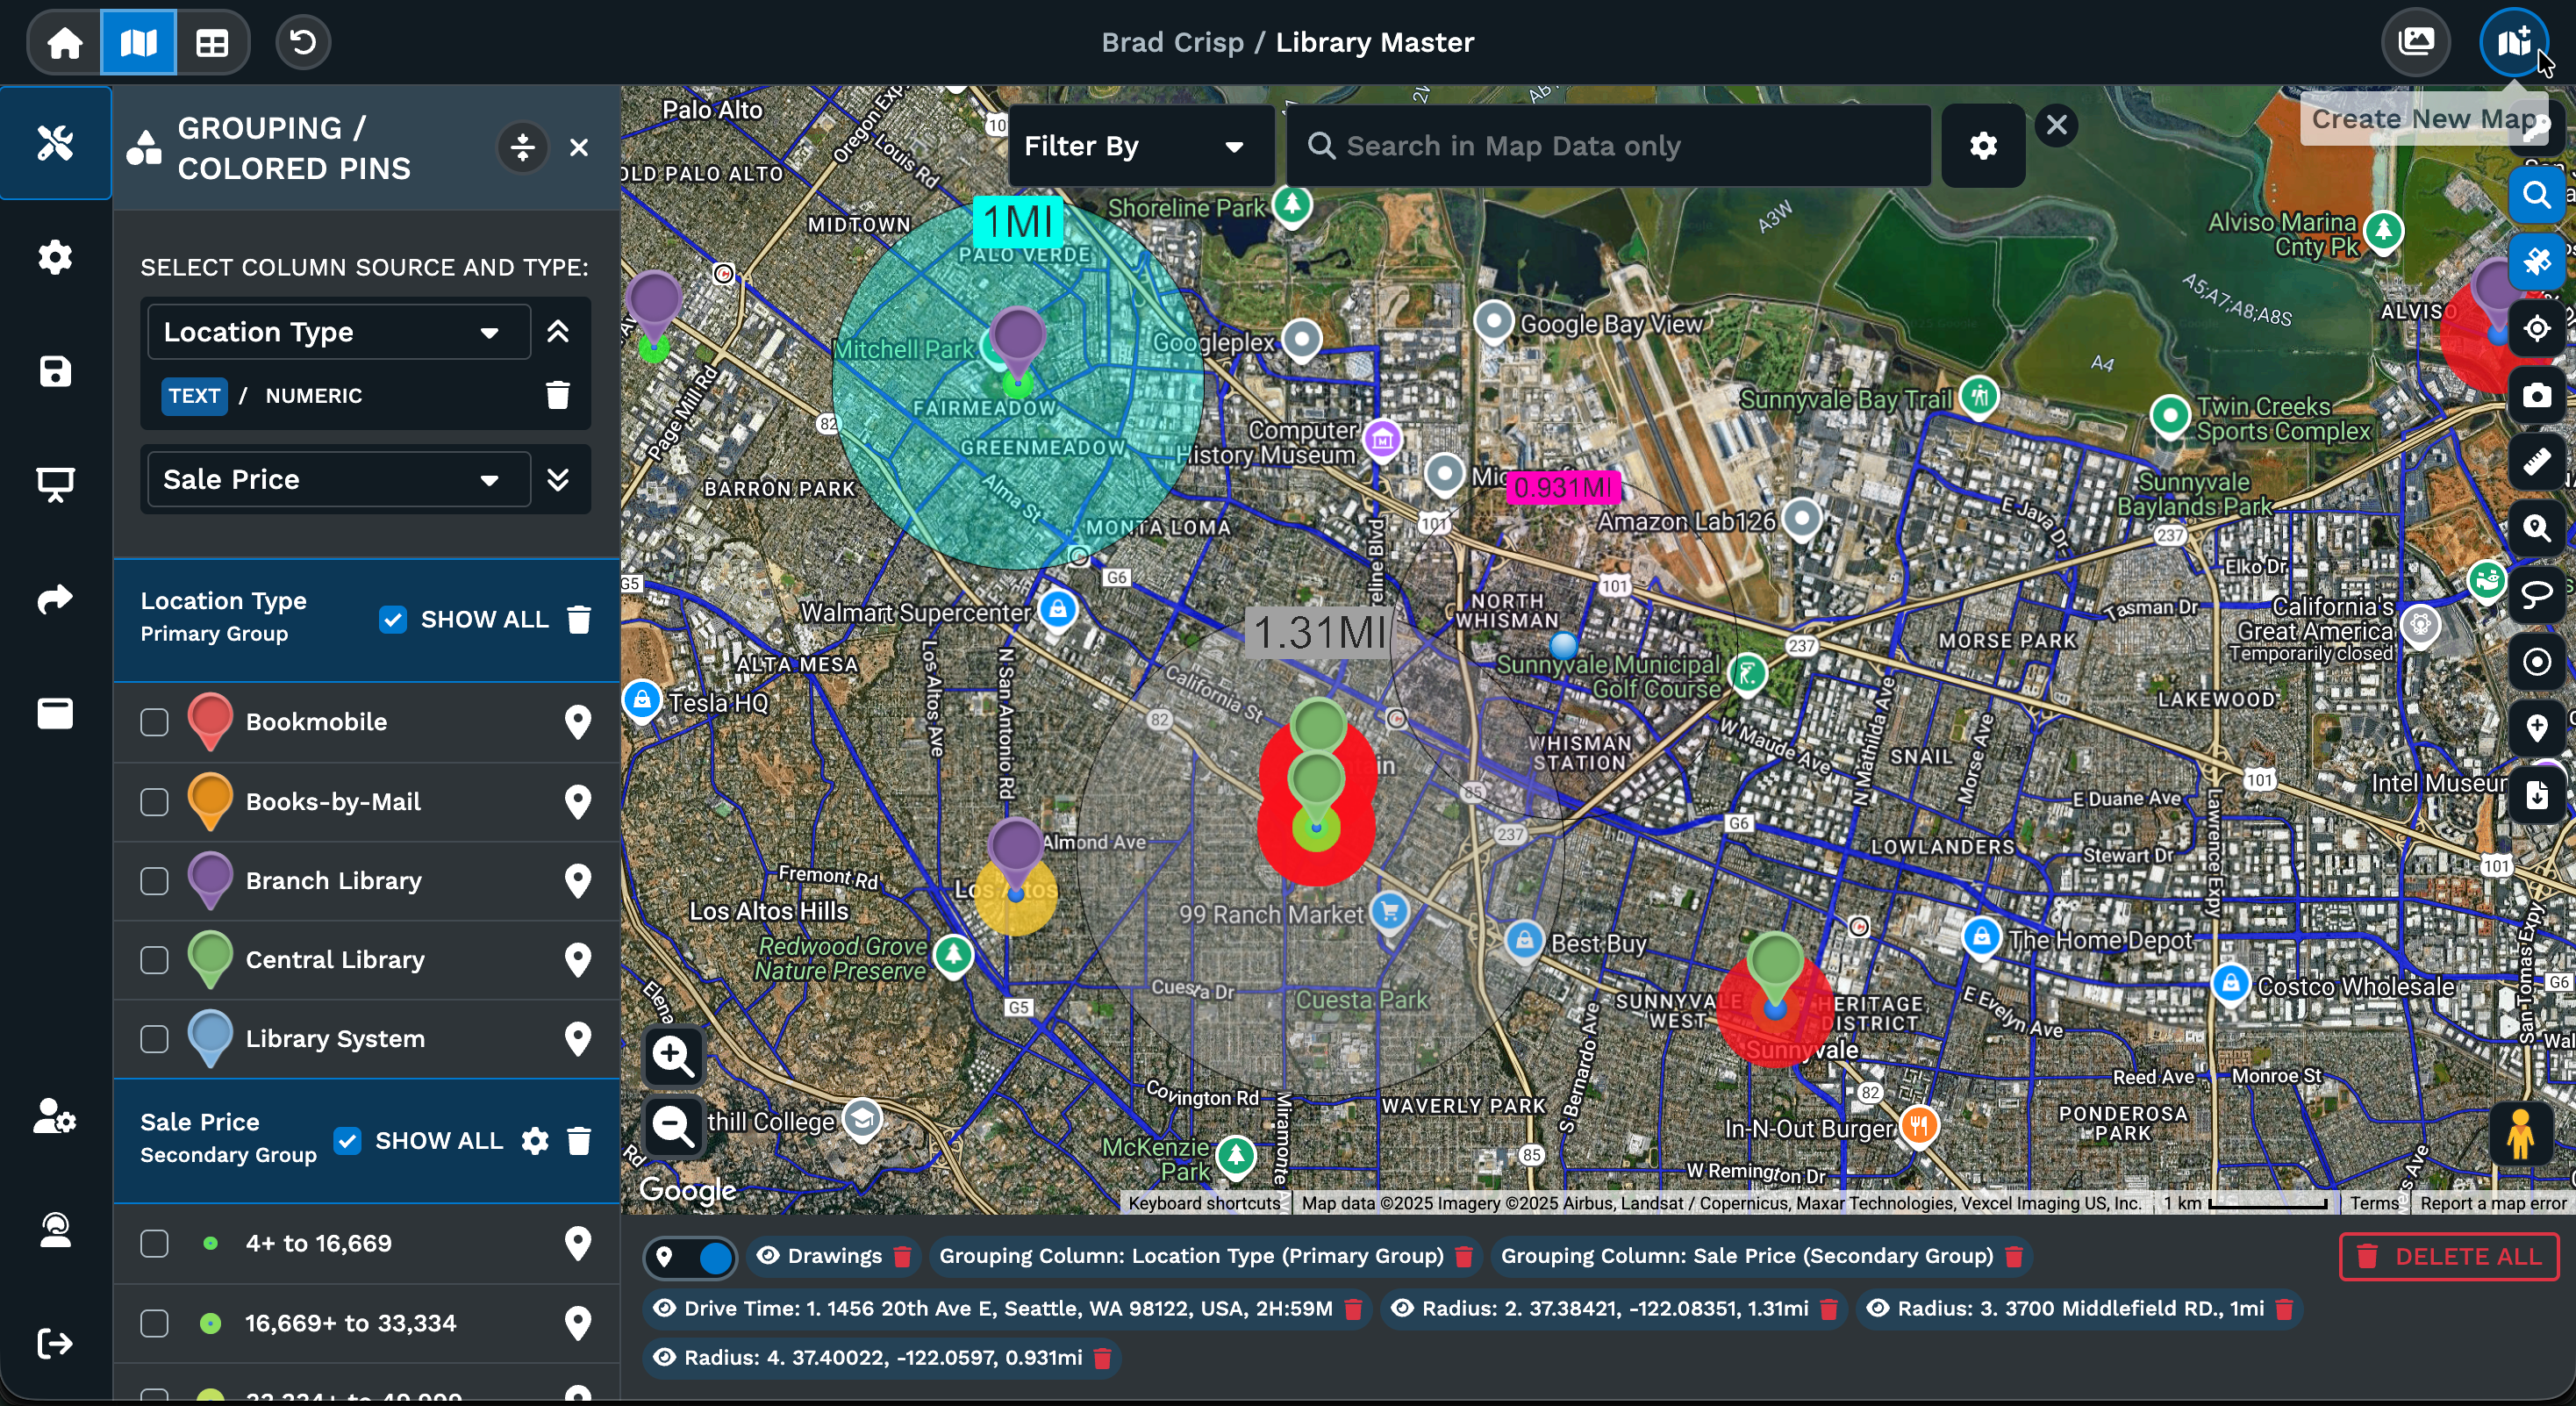
Multiple Grouping
Color-code markers by one field while sizing by another. Nested styling rules create visual hierarchies. Engine recalculates across filtered datasets.
Bubble Maps
Aggregate dense markers into proportional circles sized by numeric values. Hover to display totals with links to underlying records.
Pie Chart Clusters
Display categorical composition at zoom levels where markers overlap. Shows both location density and data distribution simultaneously.
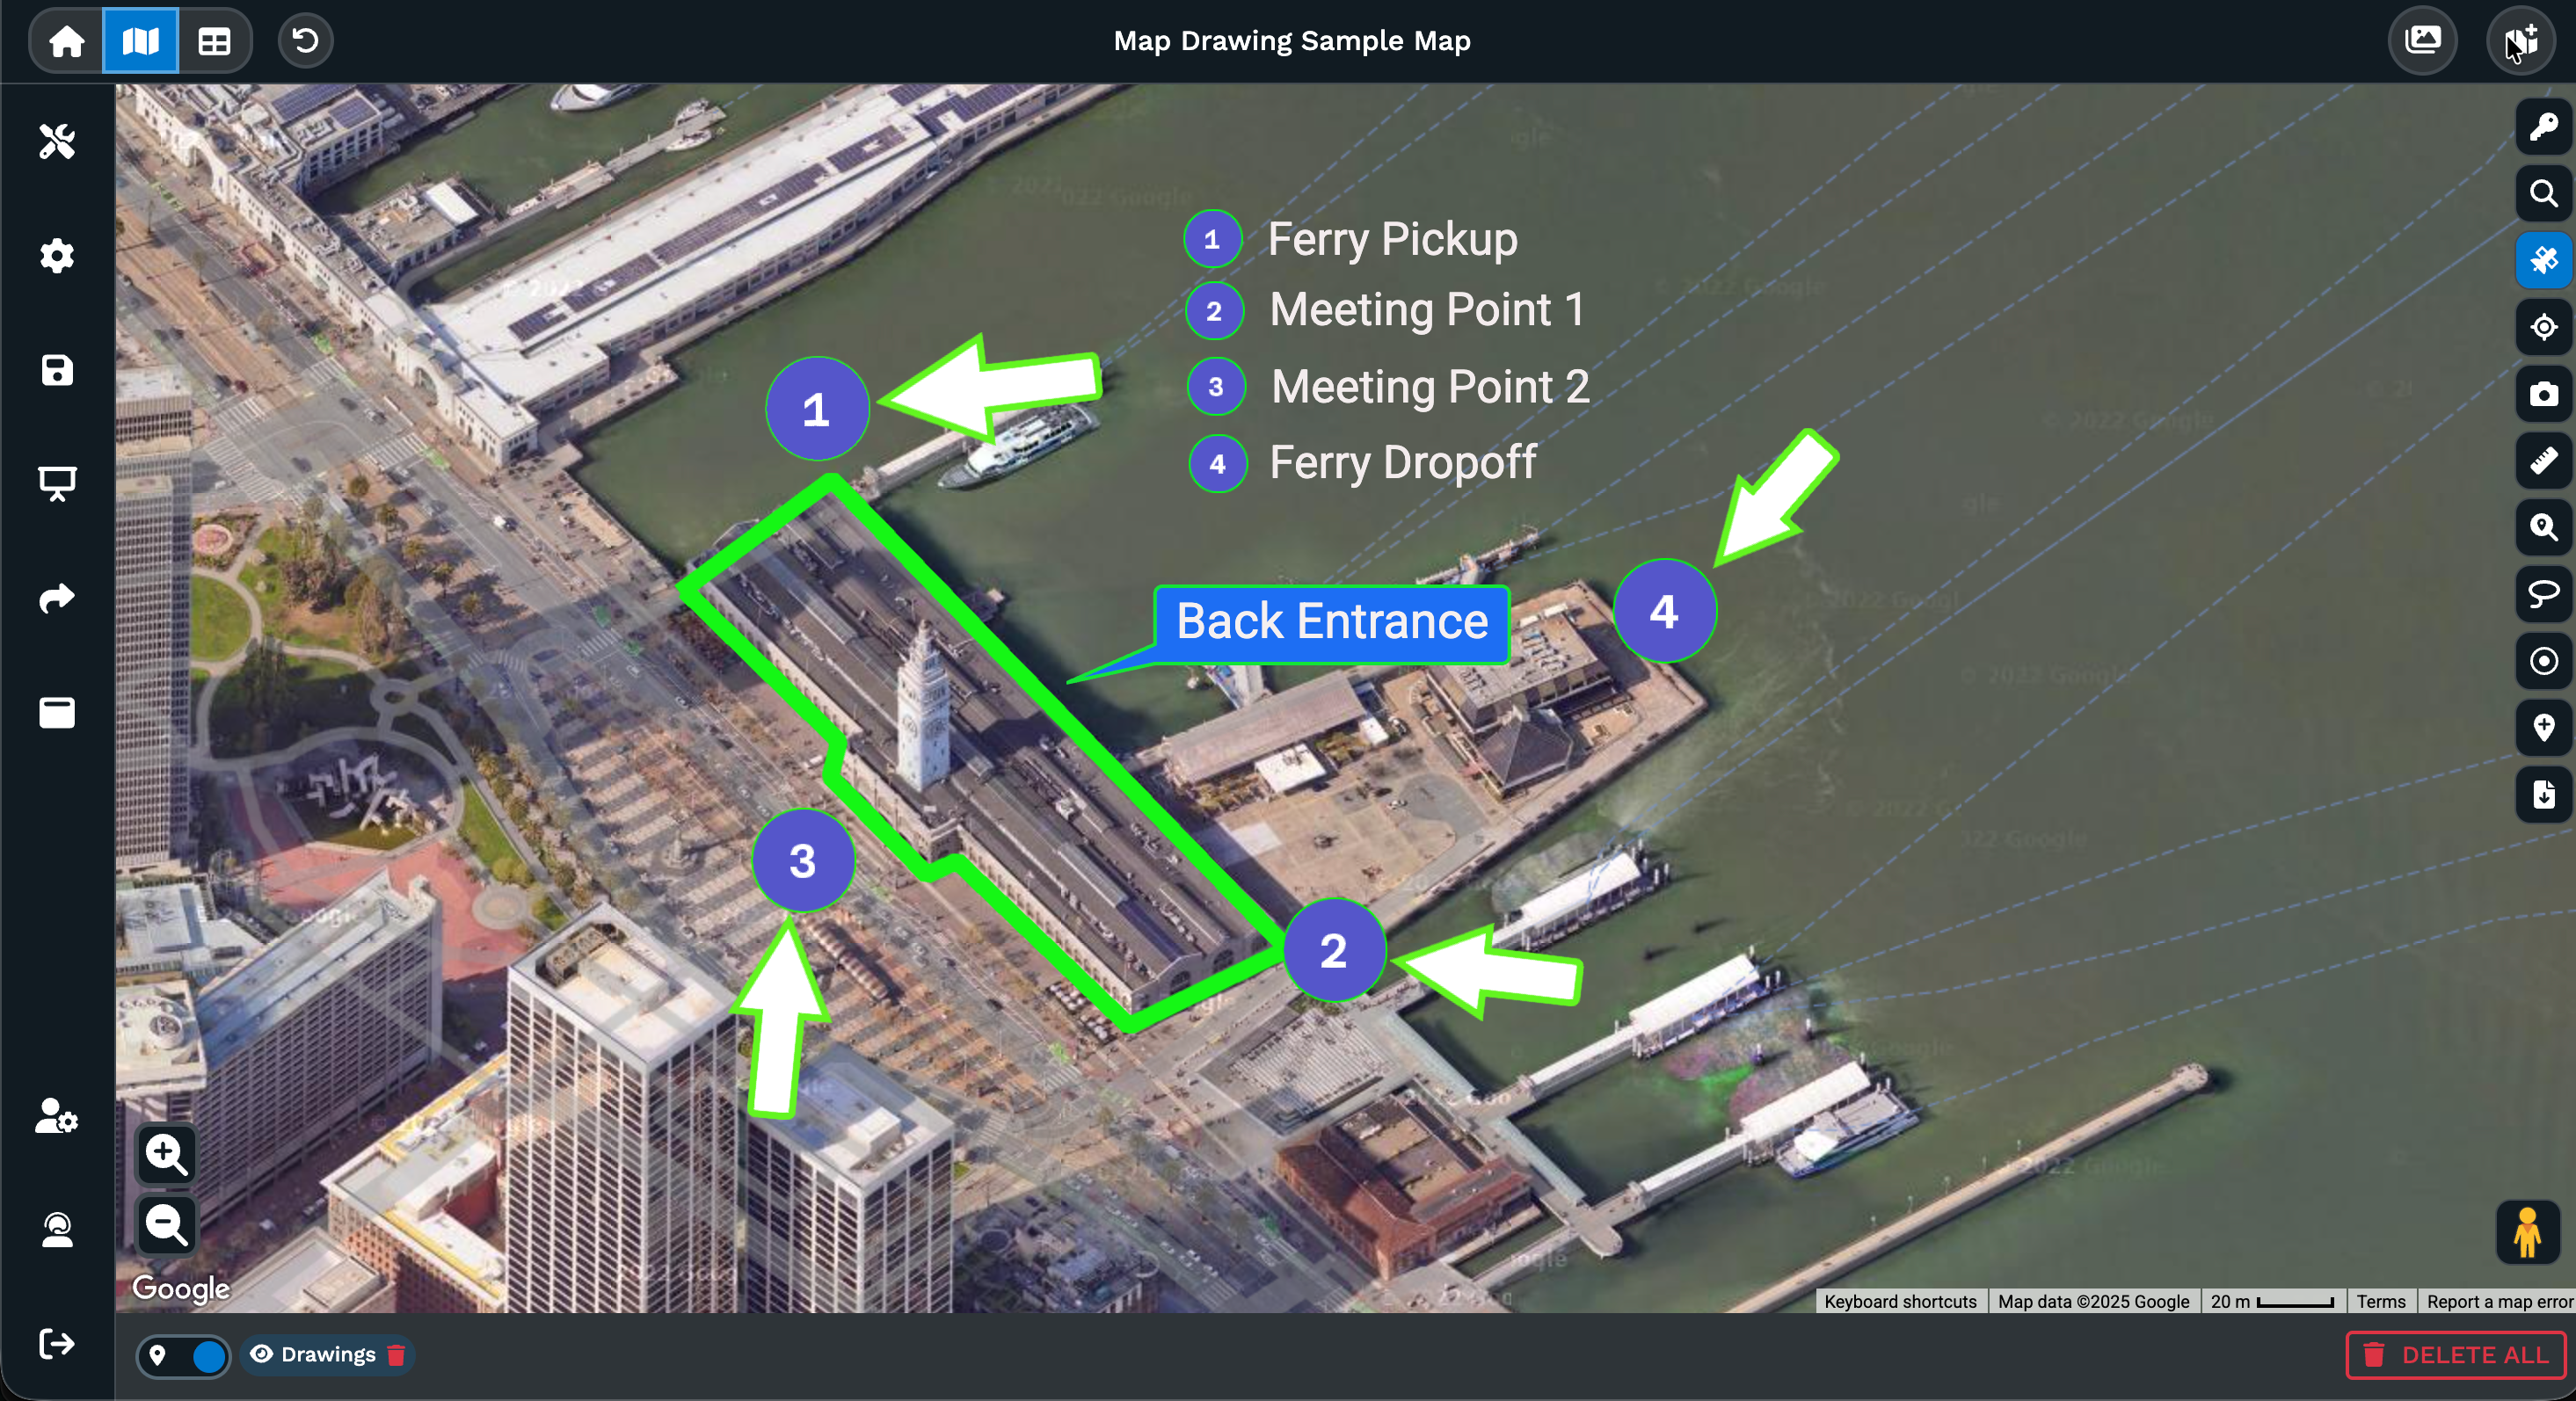
Drawing Tools
12 tools including callout bubbles, arrows, numbered markers, polygons, circles, labels, text, and icons. Full control over stroke, fill, and font parameters.
Export Options
High-resolution PNG and PDF exports up to 5120x3200 pixels for poster printing. Multiple map themes available. Customize exports with keys, legends, titles, and annotations. One-click sharing with password protection.
Complete Feature List
All features below are included with every plan at no additional cost.
- Detailed Drive Time Polygons (up to 8 hours)
- Radius Mapping (Buffer) with Export Options
- Polygon Territory Tool
- Geographic Boundary Tool (Spatial Joins)
- Heat Mapping (weighted)
- Demographics/Census Tool (50+ variables)
- Automated Territory Creation
- Multi-Stop Route Optimization (73 stops)
- Distance Calculator
- Distance Matrix Calculator
- Filter Tool
- Lasso Selection Tool
- Location Finder/Store Finder
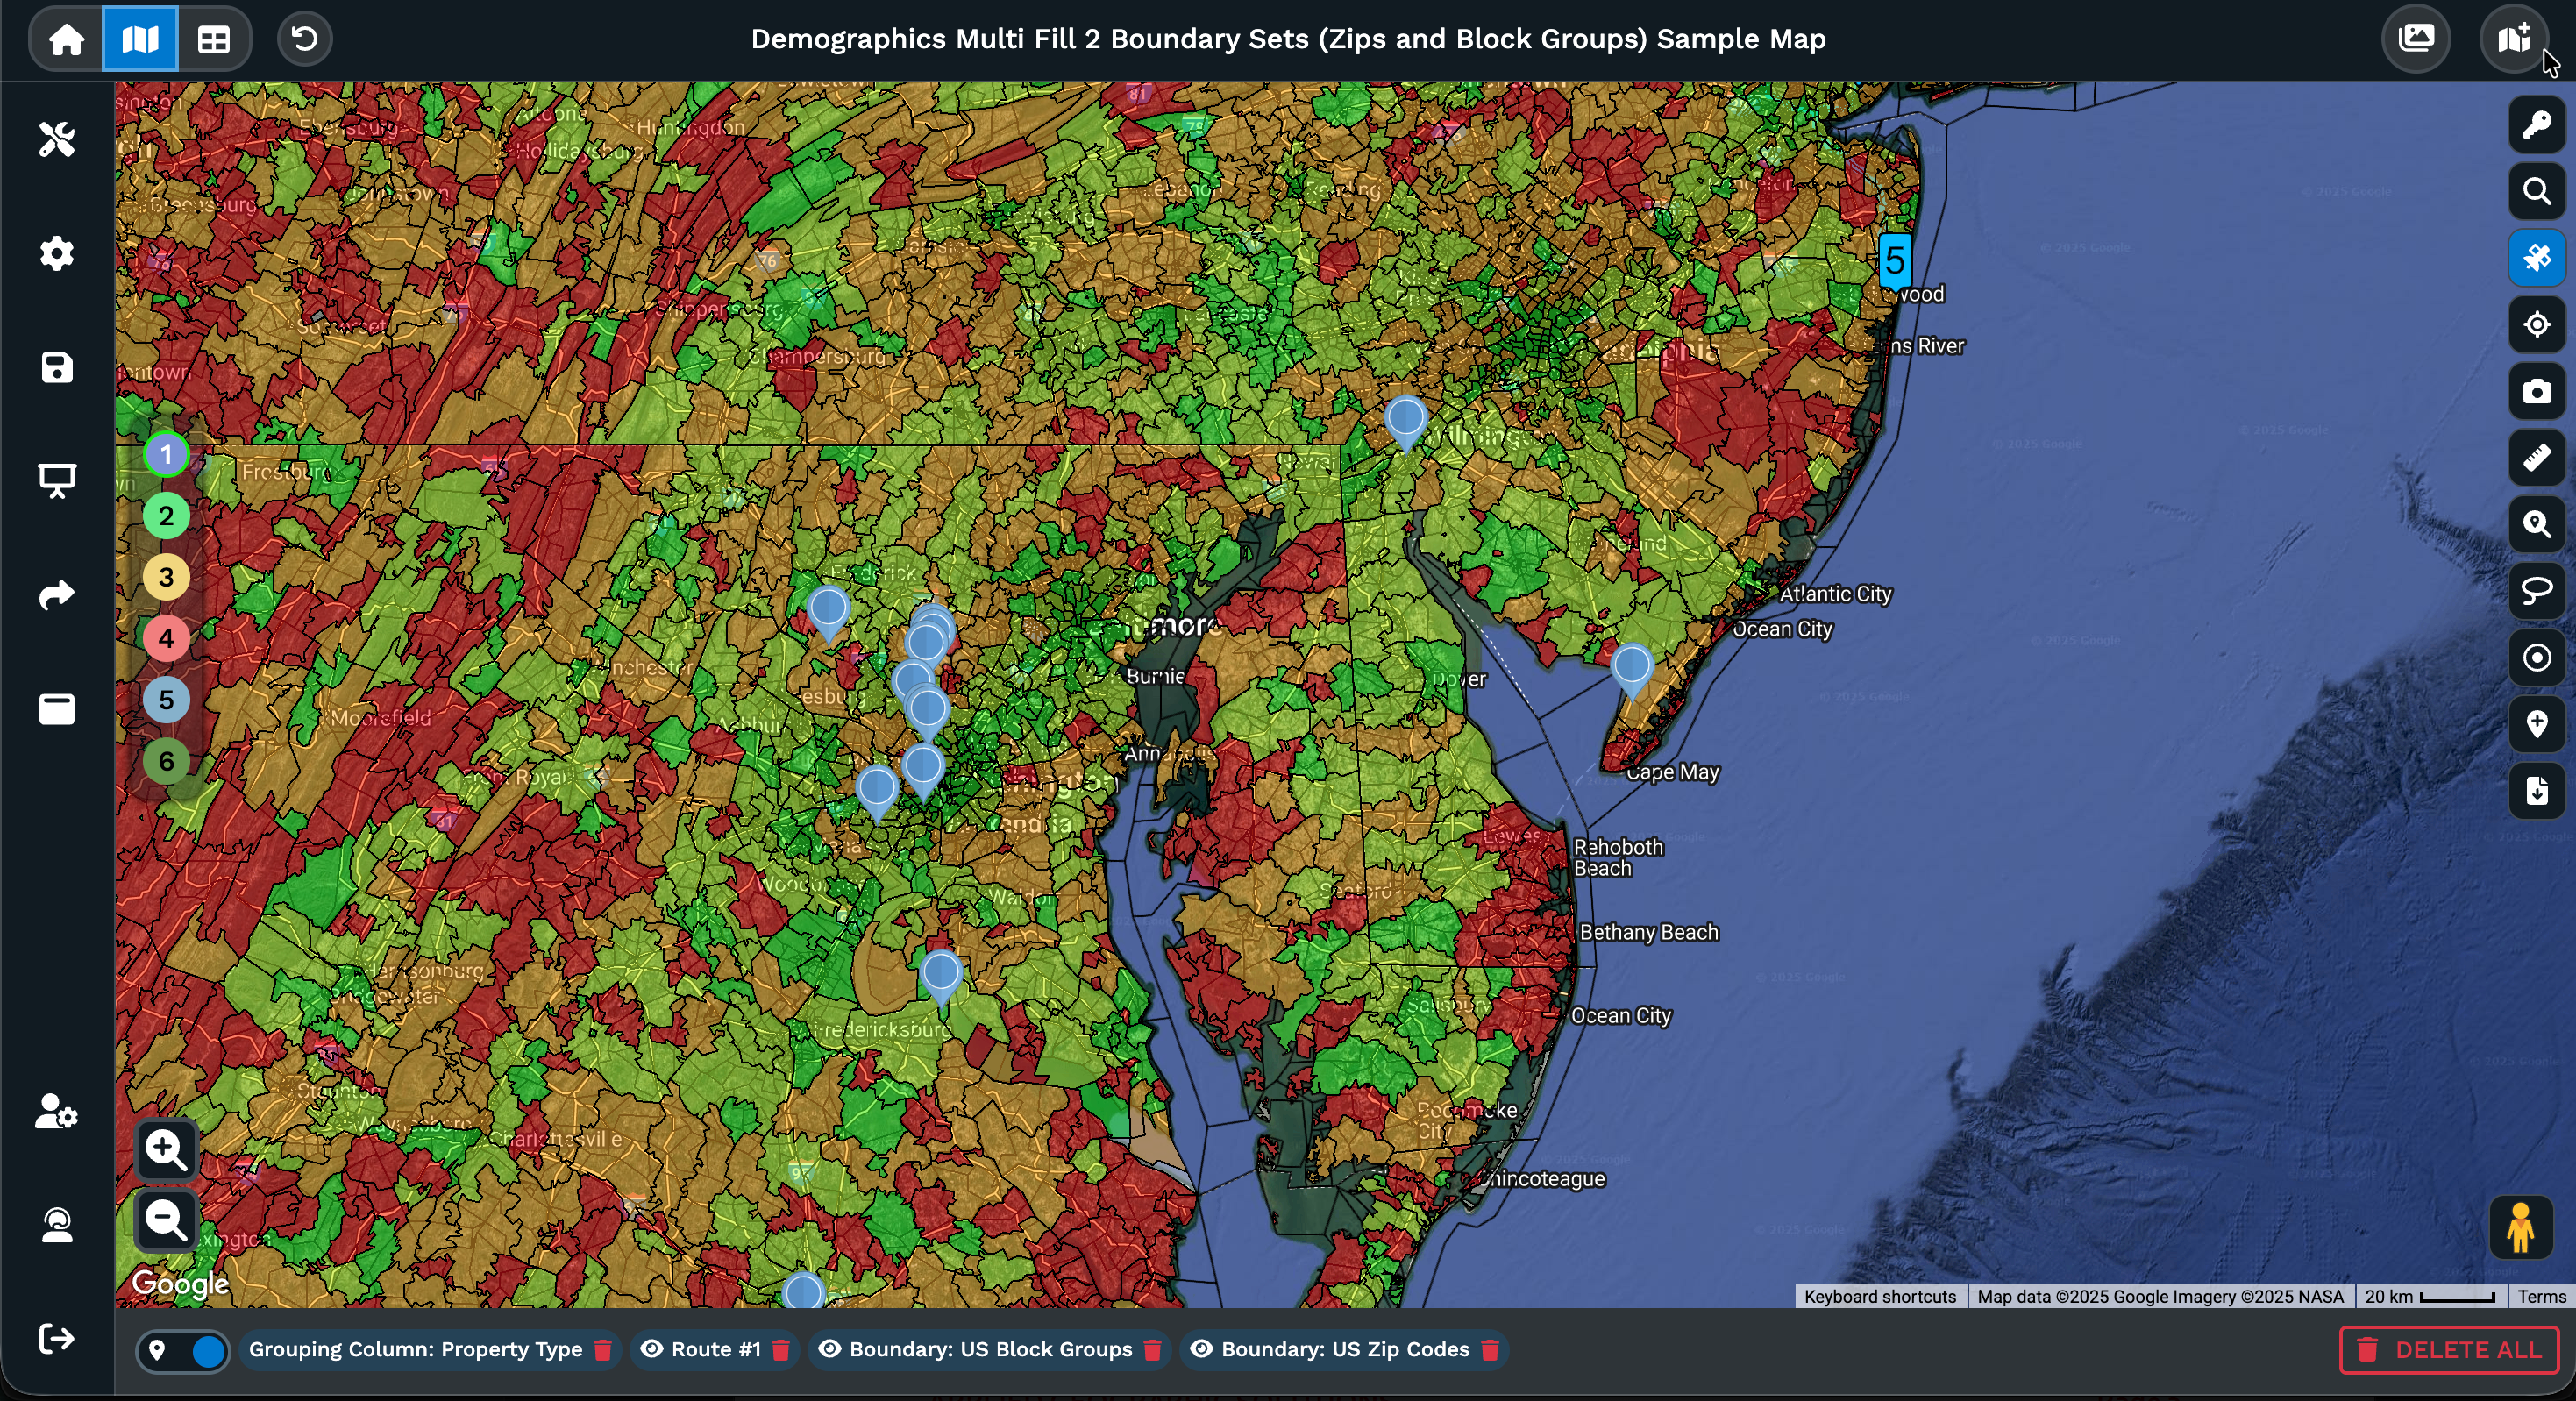
- Choropleth Boundary Mapping
- Bubble Maps
- Pie Chart Clusters
- Split-Screen Map/Spreadsheet View
- Multiple Variable Grouping
- Custom Marker Upload (any size)
- Unlimited Marker Customization (any color)
- 12 Drawing Tools
- Base Map Customization
- Satellite/Terrain/Street Views
- Google Street View Integration
- Spreadsheet Data Versioning
- Bulk Territory Editing
- Boundary/Territory Isolation
- Undo/Redo History
- Map Status Menu
- Saved Map Positions & Zoom
- Data Labels from Spreadsheet
- Hide/Restrict Data Viewing
- High-Resolution PNG/PDF Export (5120x3200px)
- PDF Export (vector quality)
- CSV/Clipboard Data Export
- HTML Embed Codes
- Password-Protected Sharing
- Granular Permission Controls
- Turn-by-Turn Navigation Export
- Presentation Mode
- REST API Access
- Google Sheets Integration
- Excel/CSV Import
- CRM Integrations (Salesforce, HubSpot, Zoho)
- 256-bit SSL Encryption
- Two-Factor Authentication
- Role-Based Access Controls
- Audit Logging
Maptive iQ (March 2025)
The iQ release introduced WebGL rendering for 200,000+ markers, 300% more drive-time calculation points, split-screen editing, automated territory optimization, spreadsheet versioning, and enhanced demographic overlays with mobile signal data achieving 90% precision for market analysis.
Processing & Performance
The platform processes large datasets rapidly without browser freezing or lockups or special hardware requirements. Enterprise-scale geocoding handles high-volume processing demands through robust cloud infrastructure, supporting industries like insurance during peak claims periods.
Processing by Data Volume
The platform scales processing performance across data volumes without degradation. Large datasets process quickly through optimized cloud infrastructure, transforming customer locations into fully interactive maps.
WebGL Rendering Capacity
WebGL rendering prevents browser freezing on large datasets. The engine handles enterprise-scale marker volumes while maintaining consistent performance through on-demand tile streaming that prevents browser bottlenecks.
Data Import Specifications
The platform supports Excel (.xlsx, .xls), CSV, and direct Google Sheets integration for data import. Copy/paste and drag-and-drop capabilities are available. Spreadsheet data is processed with standard address columns (street, city, state, zip) or latitude/longitude coordinates. The geocoding engine automatically corrects formatting issues during upload, handling messy data including missing zip codes and abbreviated street names.
Visualization Engine
The platform provides multiple visualization methods including choropleth mapping, heat maps, proportional symbols, pie-chart clusters, and multi-variable marker grouping. Each visualization type supports weighted data fields and custom styling parameters.
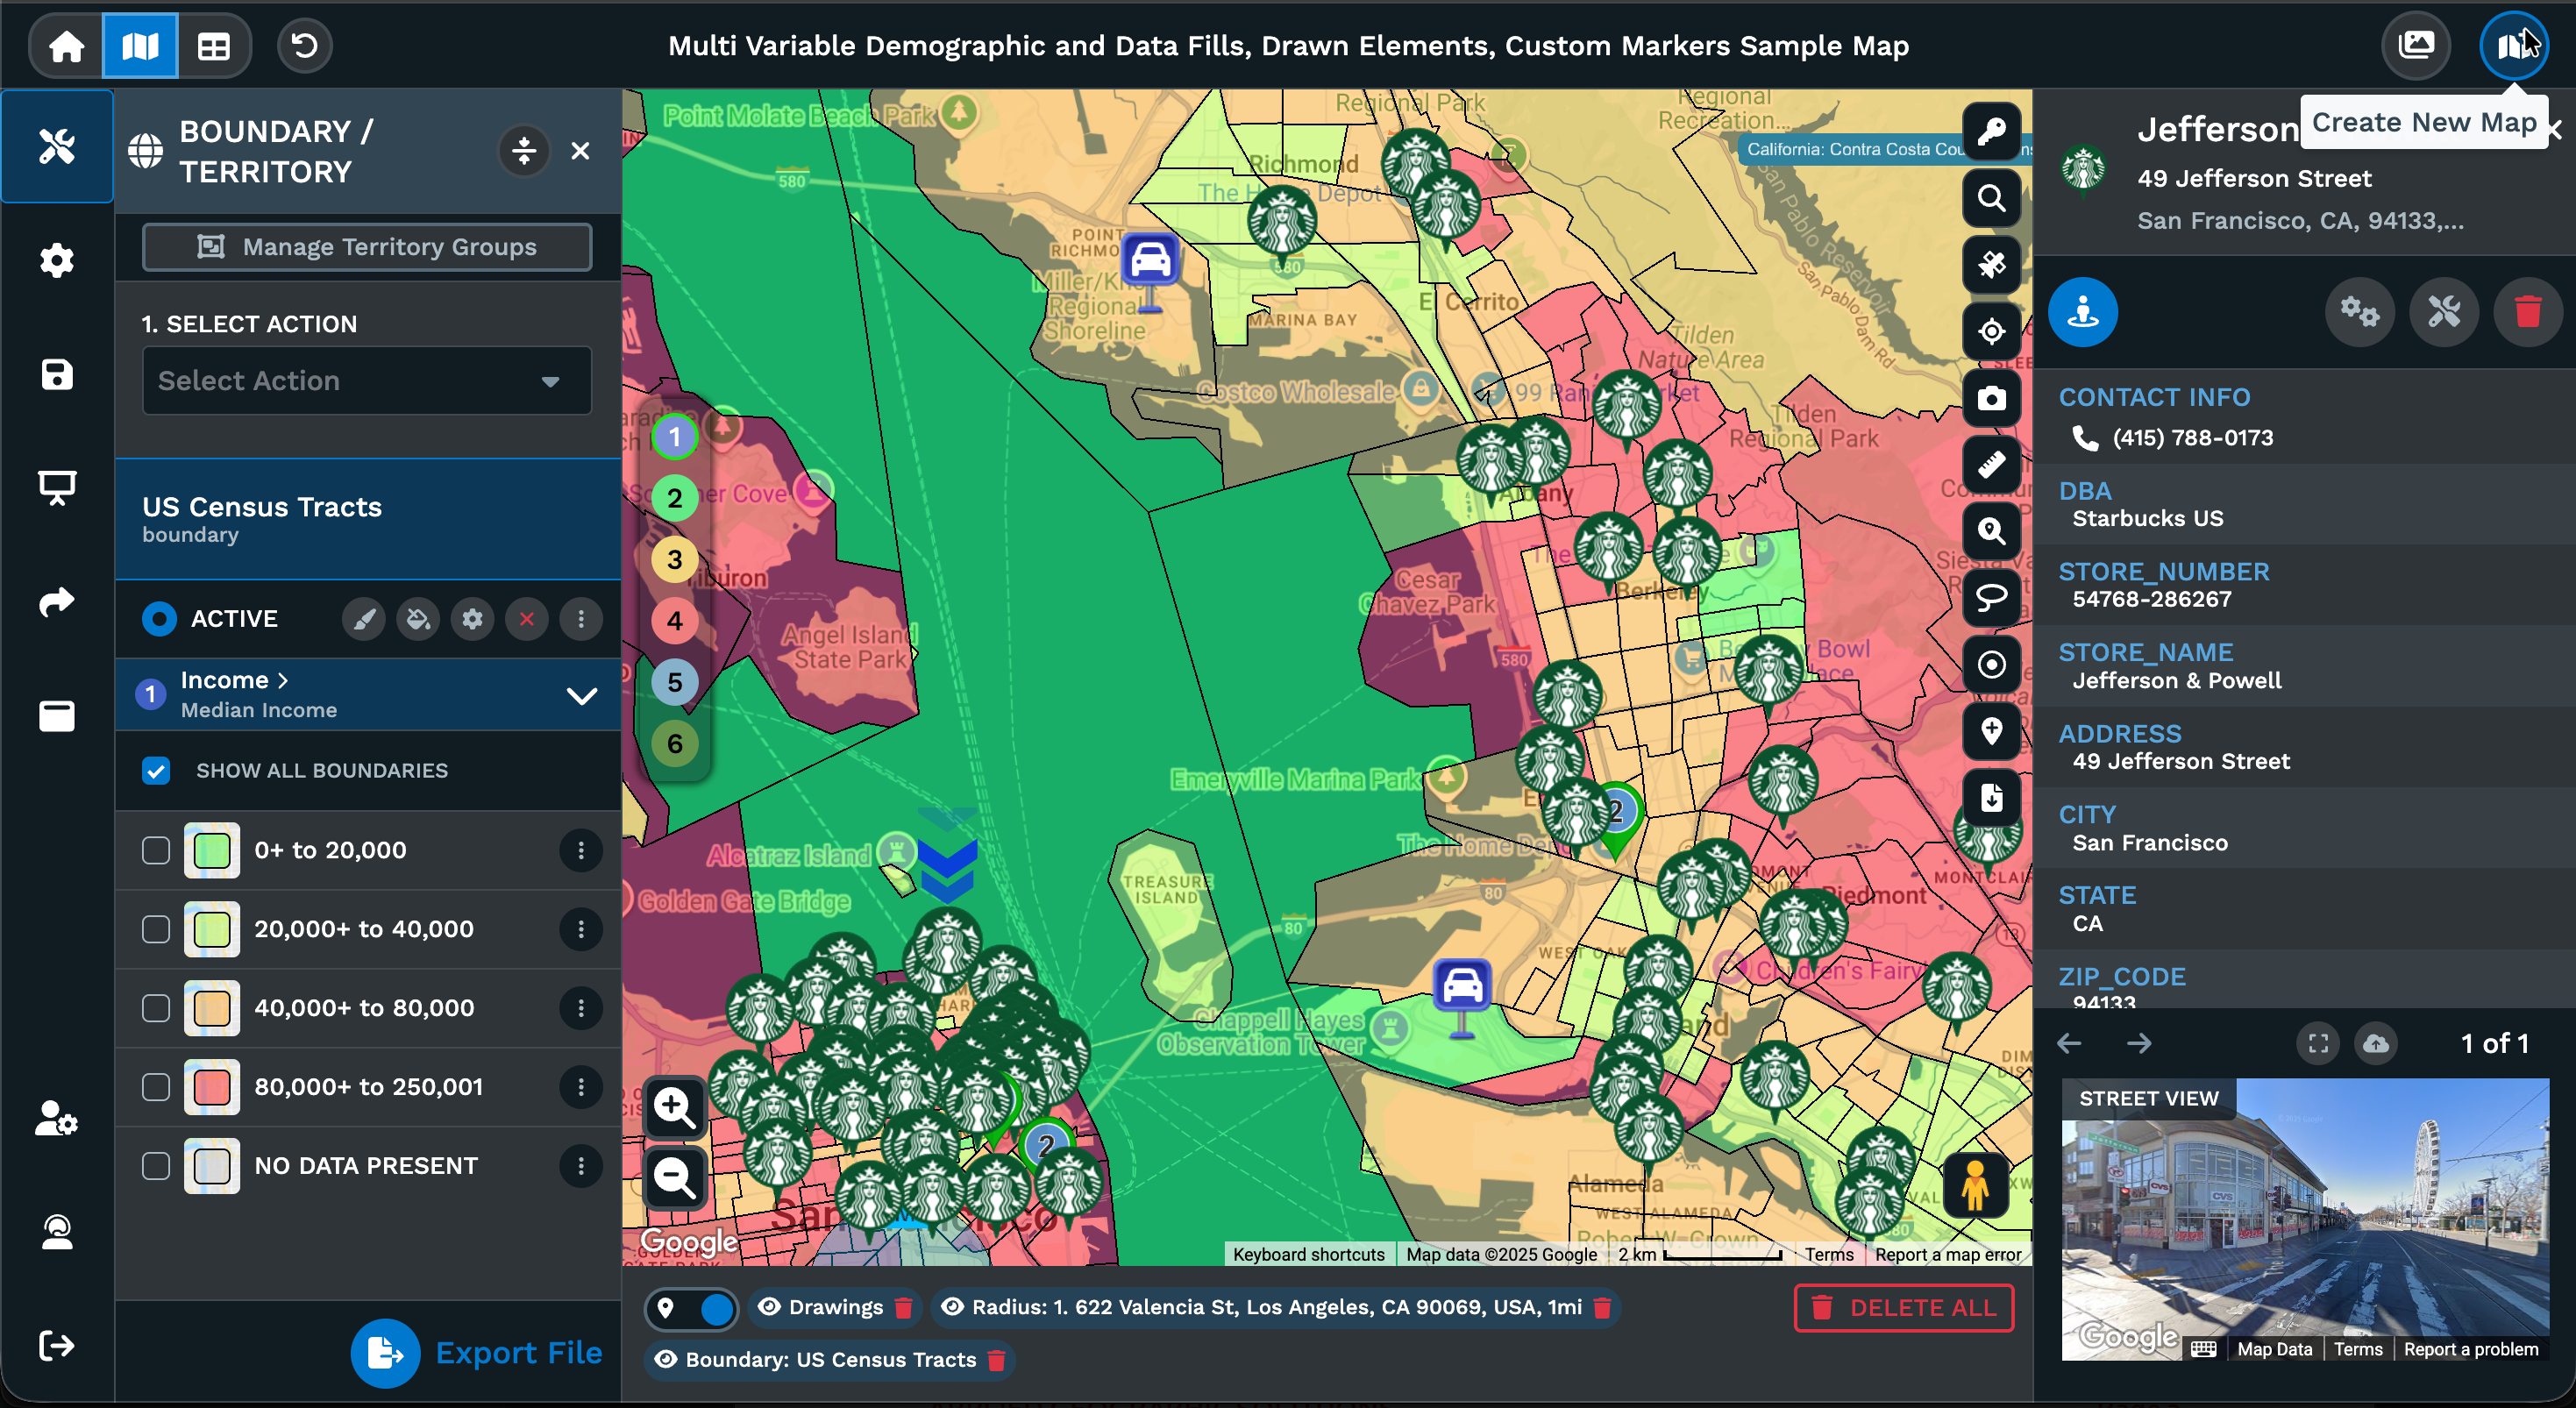
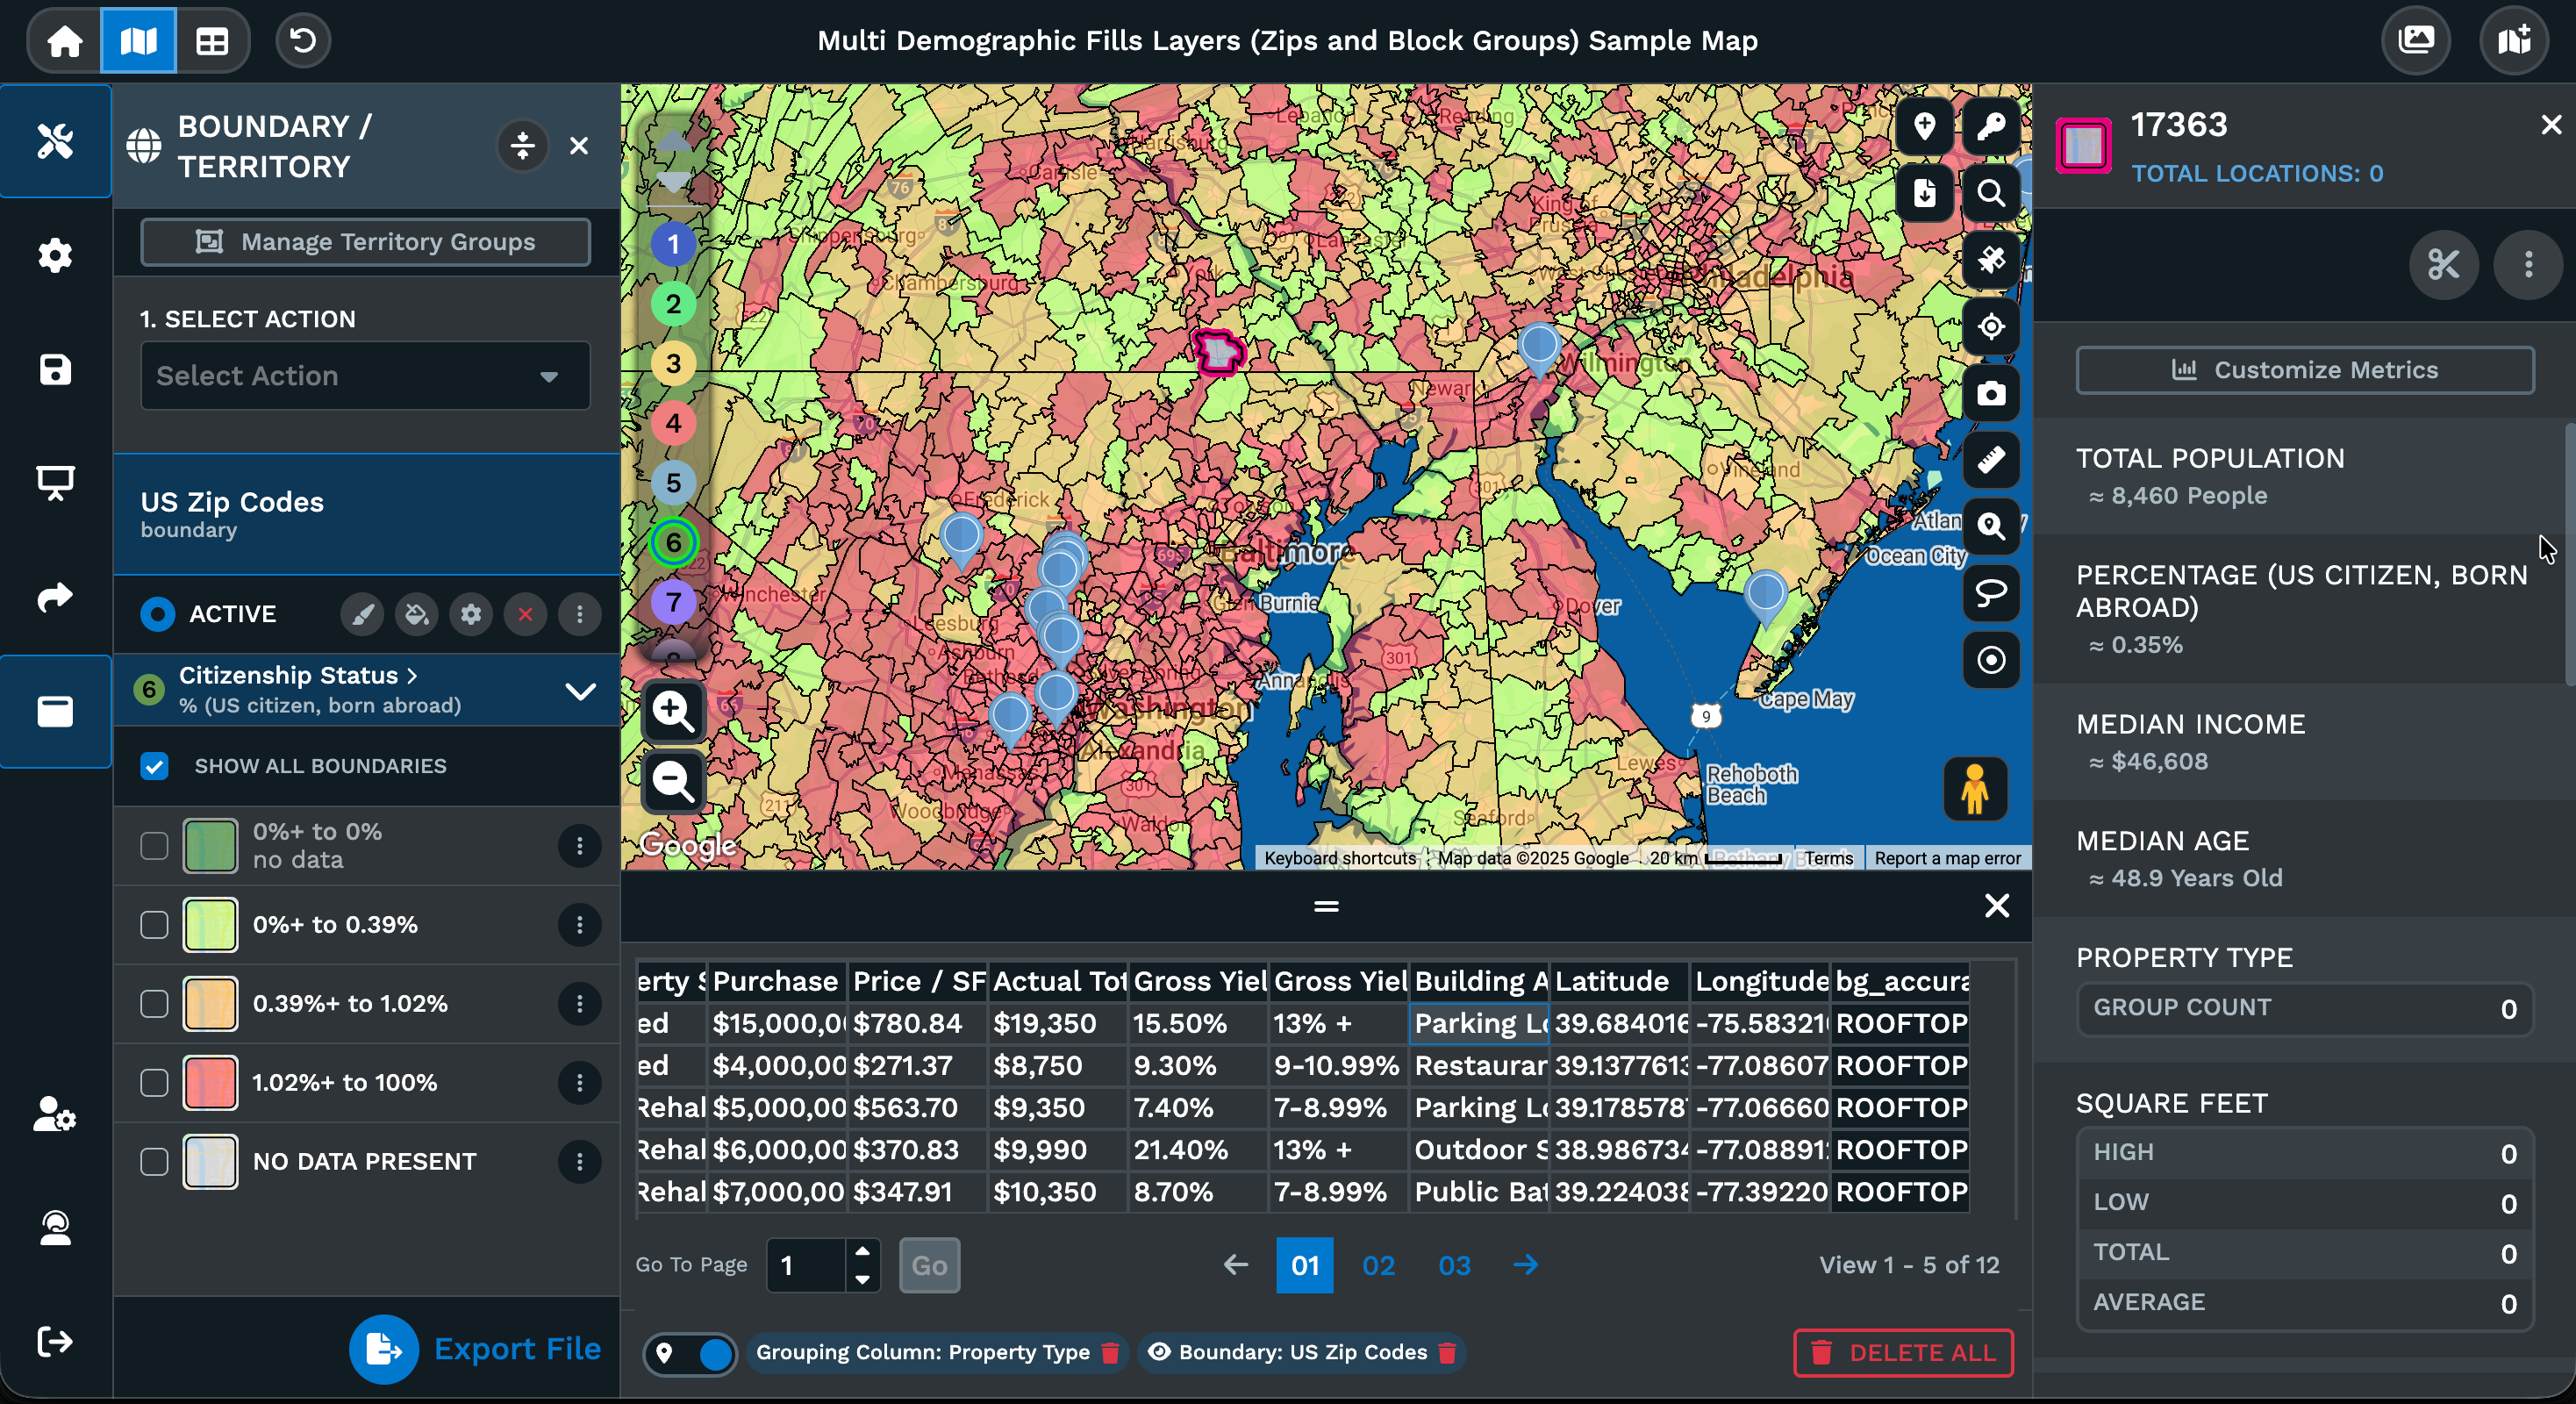
Choropleth Mapping
Aggregates statistical data across geographic regions using graduated color scales. Calculates sum, average, count, minimum, or maximum values for any numeric field within territories.
Heat Mapping
Supports weighted visualization where users select numeric columns like sales volume or client counts rather than simple marker density. Adjustable radius, opacity, and intensity thresholds create gradient surfaces.
Bubble Maps
Aggregates dense marker sets into proportional circles sized by numeric measures. Hover displays totals with links to underlying records for drill-down analysis.
Multi-Variable Grouping
Applies nested rules to simultaneously size markers by one data field (such as revenue) while coloring by another (such as product category). Engine recalculates across filtered datasets.
Pie-Chart Clusters
Displays categorical composition breakdowns at zoom levels where individual markers would overlap. Conveys both location density and data distribution simultaneously.
Drawing Tools
12 dedicated tools including callout bubbles, arrows, numbered markers, polygons, circles, polylines, rectangles, labels, text, and icons. Each with customizable stroke, fill, and font parameters.
Marker Customization
Fully customizable markers with unlimited color options, custom image uploads for branded markers, and complete control over size, color, and icon selection. Every visual aspect can be tailored to match your brand and data visualization needs.
- Unlimited color options for any marker
- Custom image uploads for branded markers
- Data-driven labels from spreadsheet columns
- Marker-integrated labels that scale with zoom levels
- Nested styling rules for visual hierarchies
Base Map Styling
Base map customization provides full control over water and land colors, highway visibility and labels, road display and labels, administrative labels, points of interest, and transit labels.
- Satellite imagery with hybrid labels
- Terrain views with elevation contours
- Monochrome and custom color presets
- Google Street View integration
- Adjustable feature visibility toggles
Export Capabilities
Maps export as high-resolution image files at resolutions up to 5120x3200 pixels for poster-size printing. Interactive maps embed on websites with configurable features including search boxes, distance calculators, radius tools, and filter controls. Public sharing generates URLs with password protection options and granular permissions controlling viewer access to tools, data columns, and editing capabilities.
Territory Management
Maptive iQ's Automated Territory Optimization features a powerful territory balancing engine that generates constraint-based territories using custom-defined parameters. The algorithm balances territories across multiple metrics simultaneously, using your own data, Maptive's built-in boundaries, or socio-economic datasets to create optimized territories tailored to your business needs.
Algorithm Parameters
The algorithm generates territories using multiple constraint types. Users define maximum accounts per representative, drive time limits, sales representative locations, and existing territory structures. The system factors salesperson locations, demographic data, and multiple data fields when creating balanced territories.
- Maximum accounts per representative
- Drive time and distance limits
- Sales representative home locations
- Existing territory preservation
- Revenue and workload balancing
- Customer density distribution
- Market potential weighting
Balancing Metrics
Territories balance across multiple metrics simultaneously including sales numbers, customer locations, leads, revenue potential, population, market potential, and workload distribution.
Territory Tools
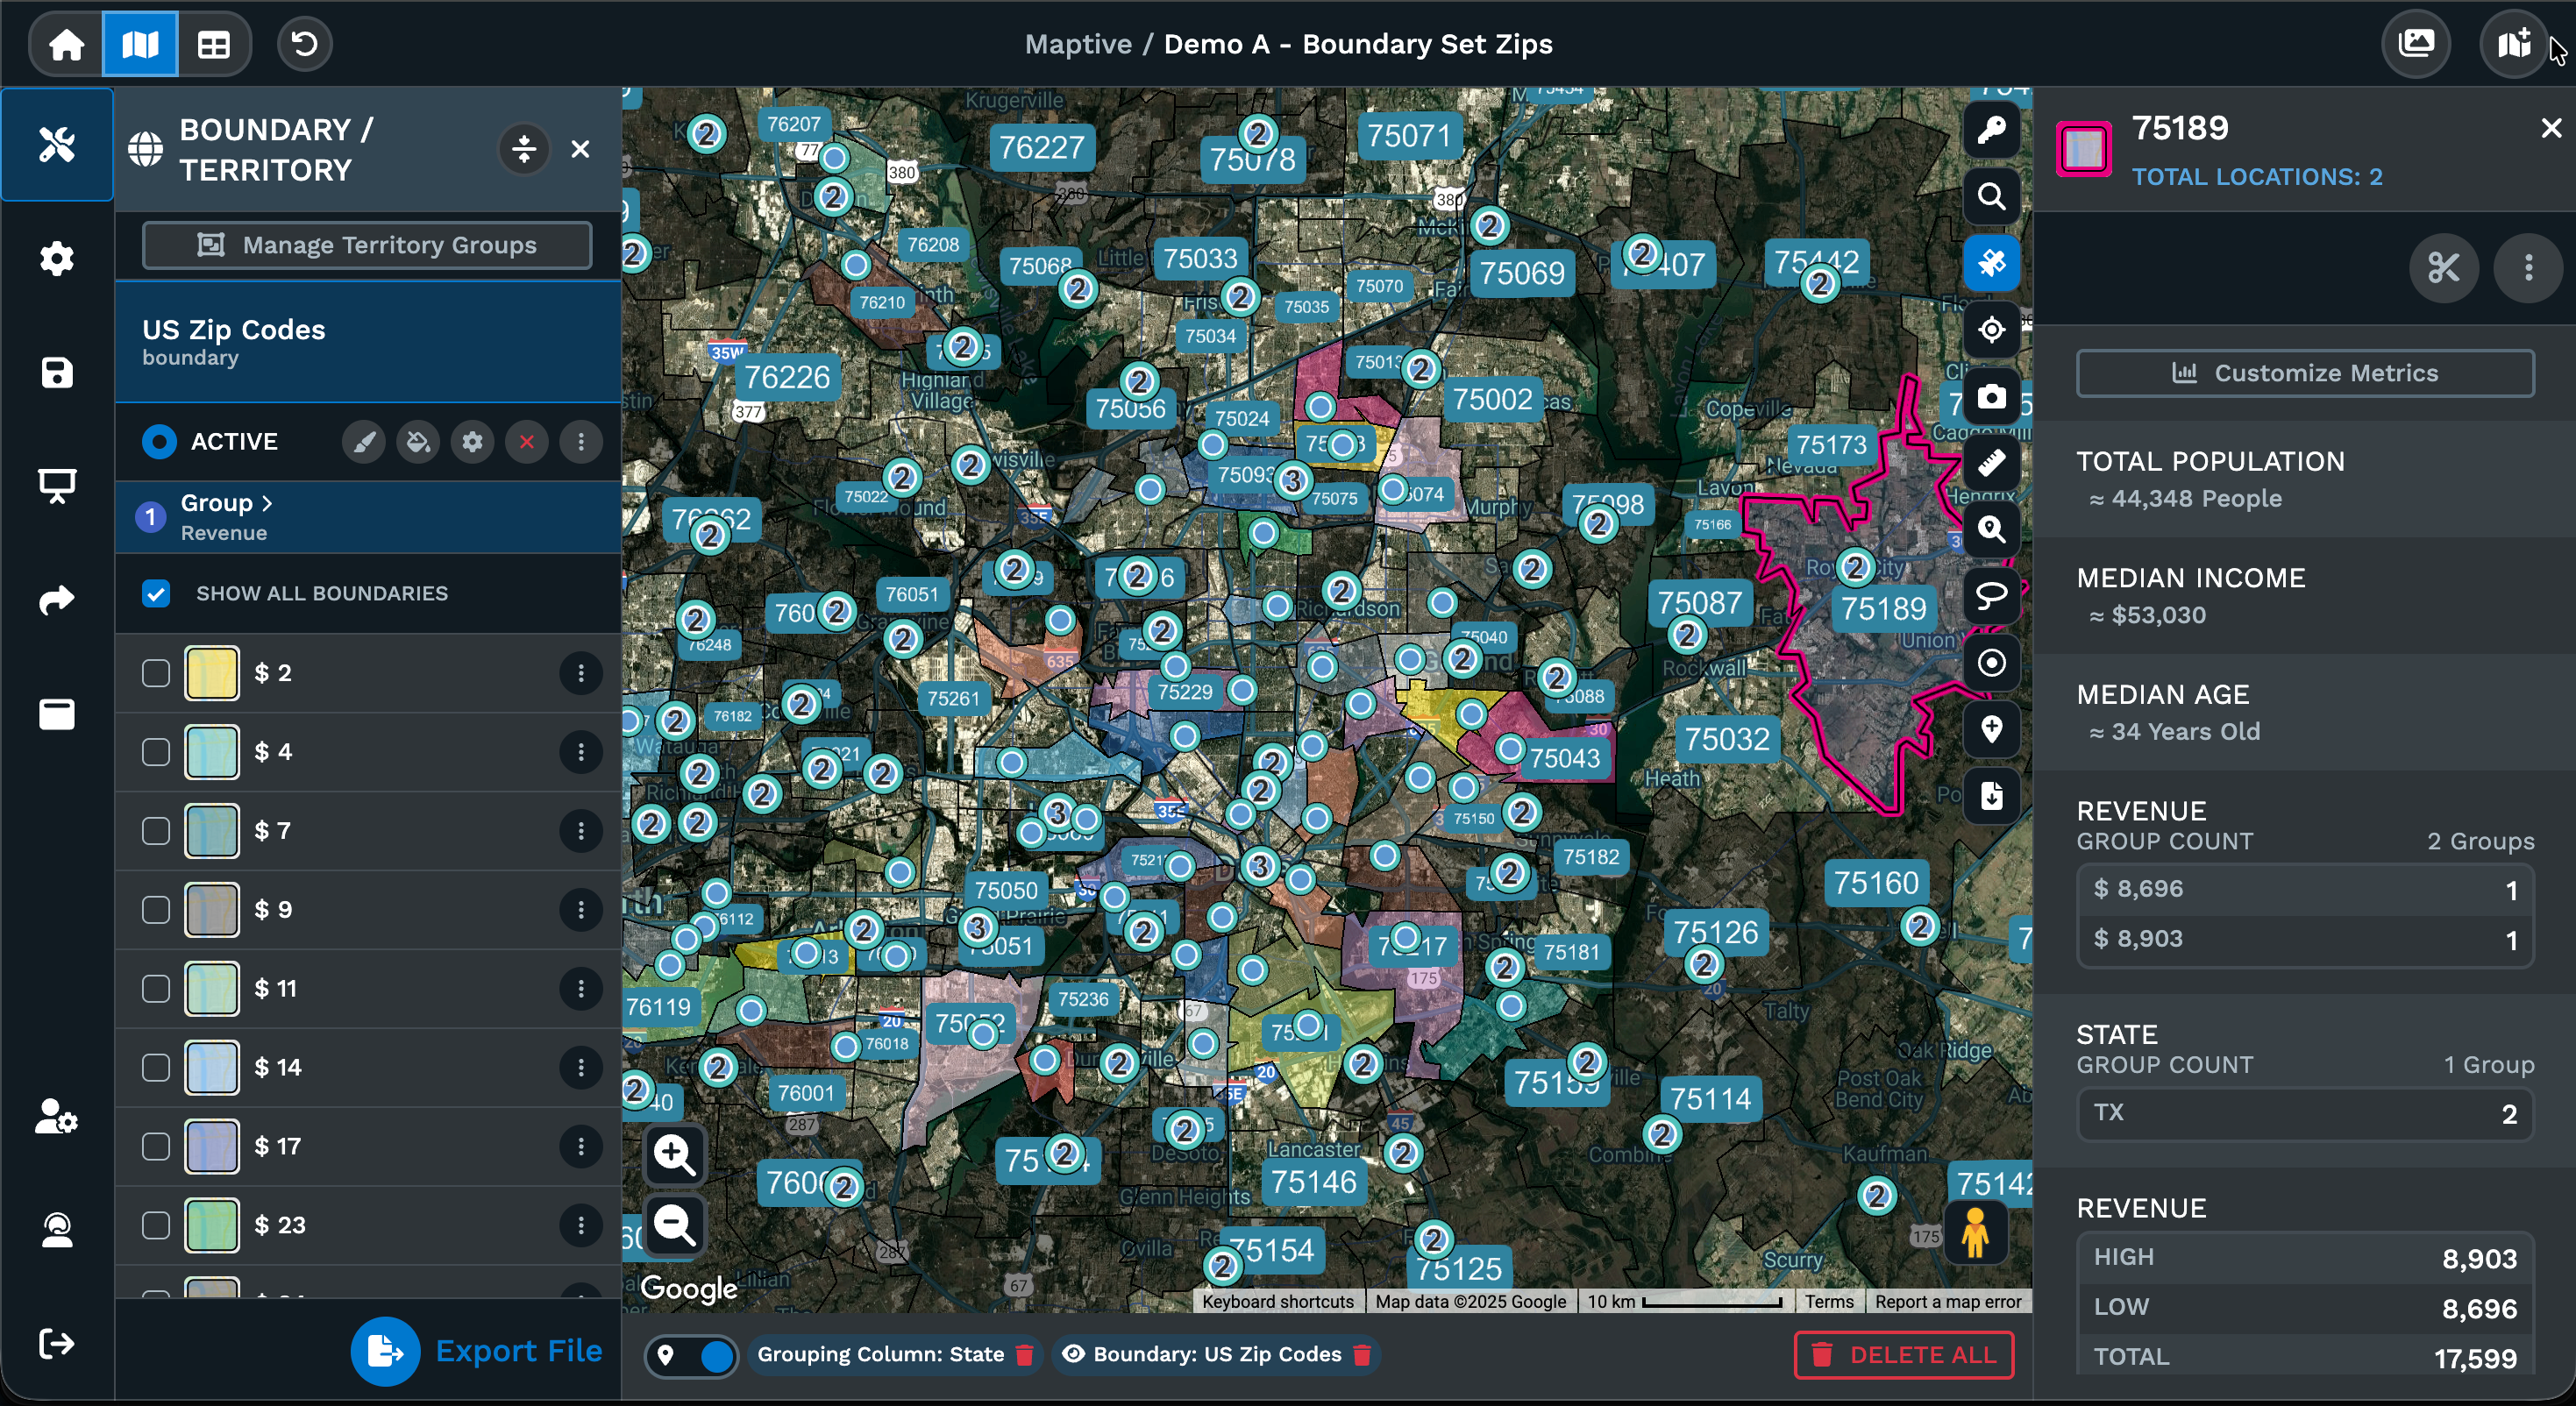
Combined boundary and territory tools convert boundaries to editable polygons for seamless adjustments. Bulk editing updates all markers within territories in single operations. Multi-level territory support enables hierarchical structures built from states, counties, zip codes, or custom boundary sets. One-click updates propagate boundary changes across multiple maps simultaneously. Automated notification systems alert teams when assignments change during market realignments.
Boundary Conversion
Converts ZIP codes, counties, or districts to editable polygons. Geographic Boundary Tool aggregates regions by matching codes and calculating combined statistics.
Bulk Operations
Reassigns hundreds of accounts simultaneously. Territory boundary modifications propagate across multiple maps in seconds through batch update tools.
Split-Screen View
Displays maps alongside spreadsheet data with real-time synchronization showing live impact of territory modifications as boundaries are adjusted.
Implementation Results
Nationwide parts distributors compressed two weeks of territory redesign work into one afternoon. Field teams saved 12% on routes. Companies cut over $100,000 in fuel costs quarterly using the constraint-based balancing algorithms.
Route Optimization
Route optimization handles up to 73 stops per trip powered by Google's Vehicle Routing Problem (VRP) solver with AI-enhanced algorithm-based sequencing that minimizes travel time. The platform processes multi-stop route planning with drag-and-drop customization, automatic path optimization, and turn-by-turn navigation exports.
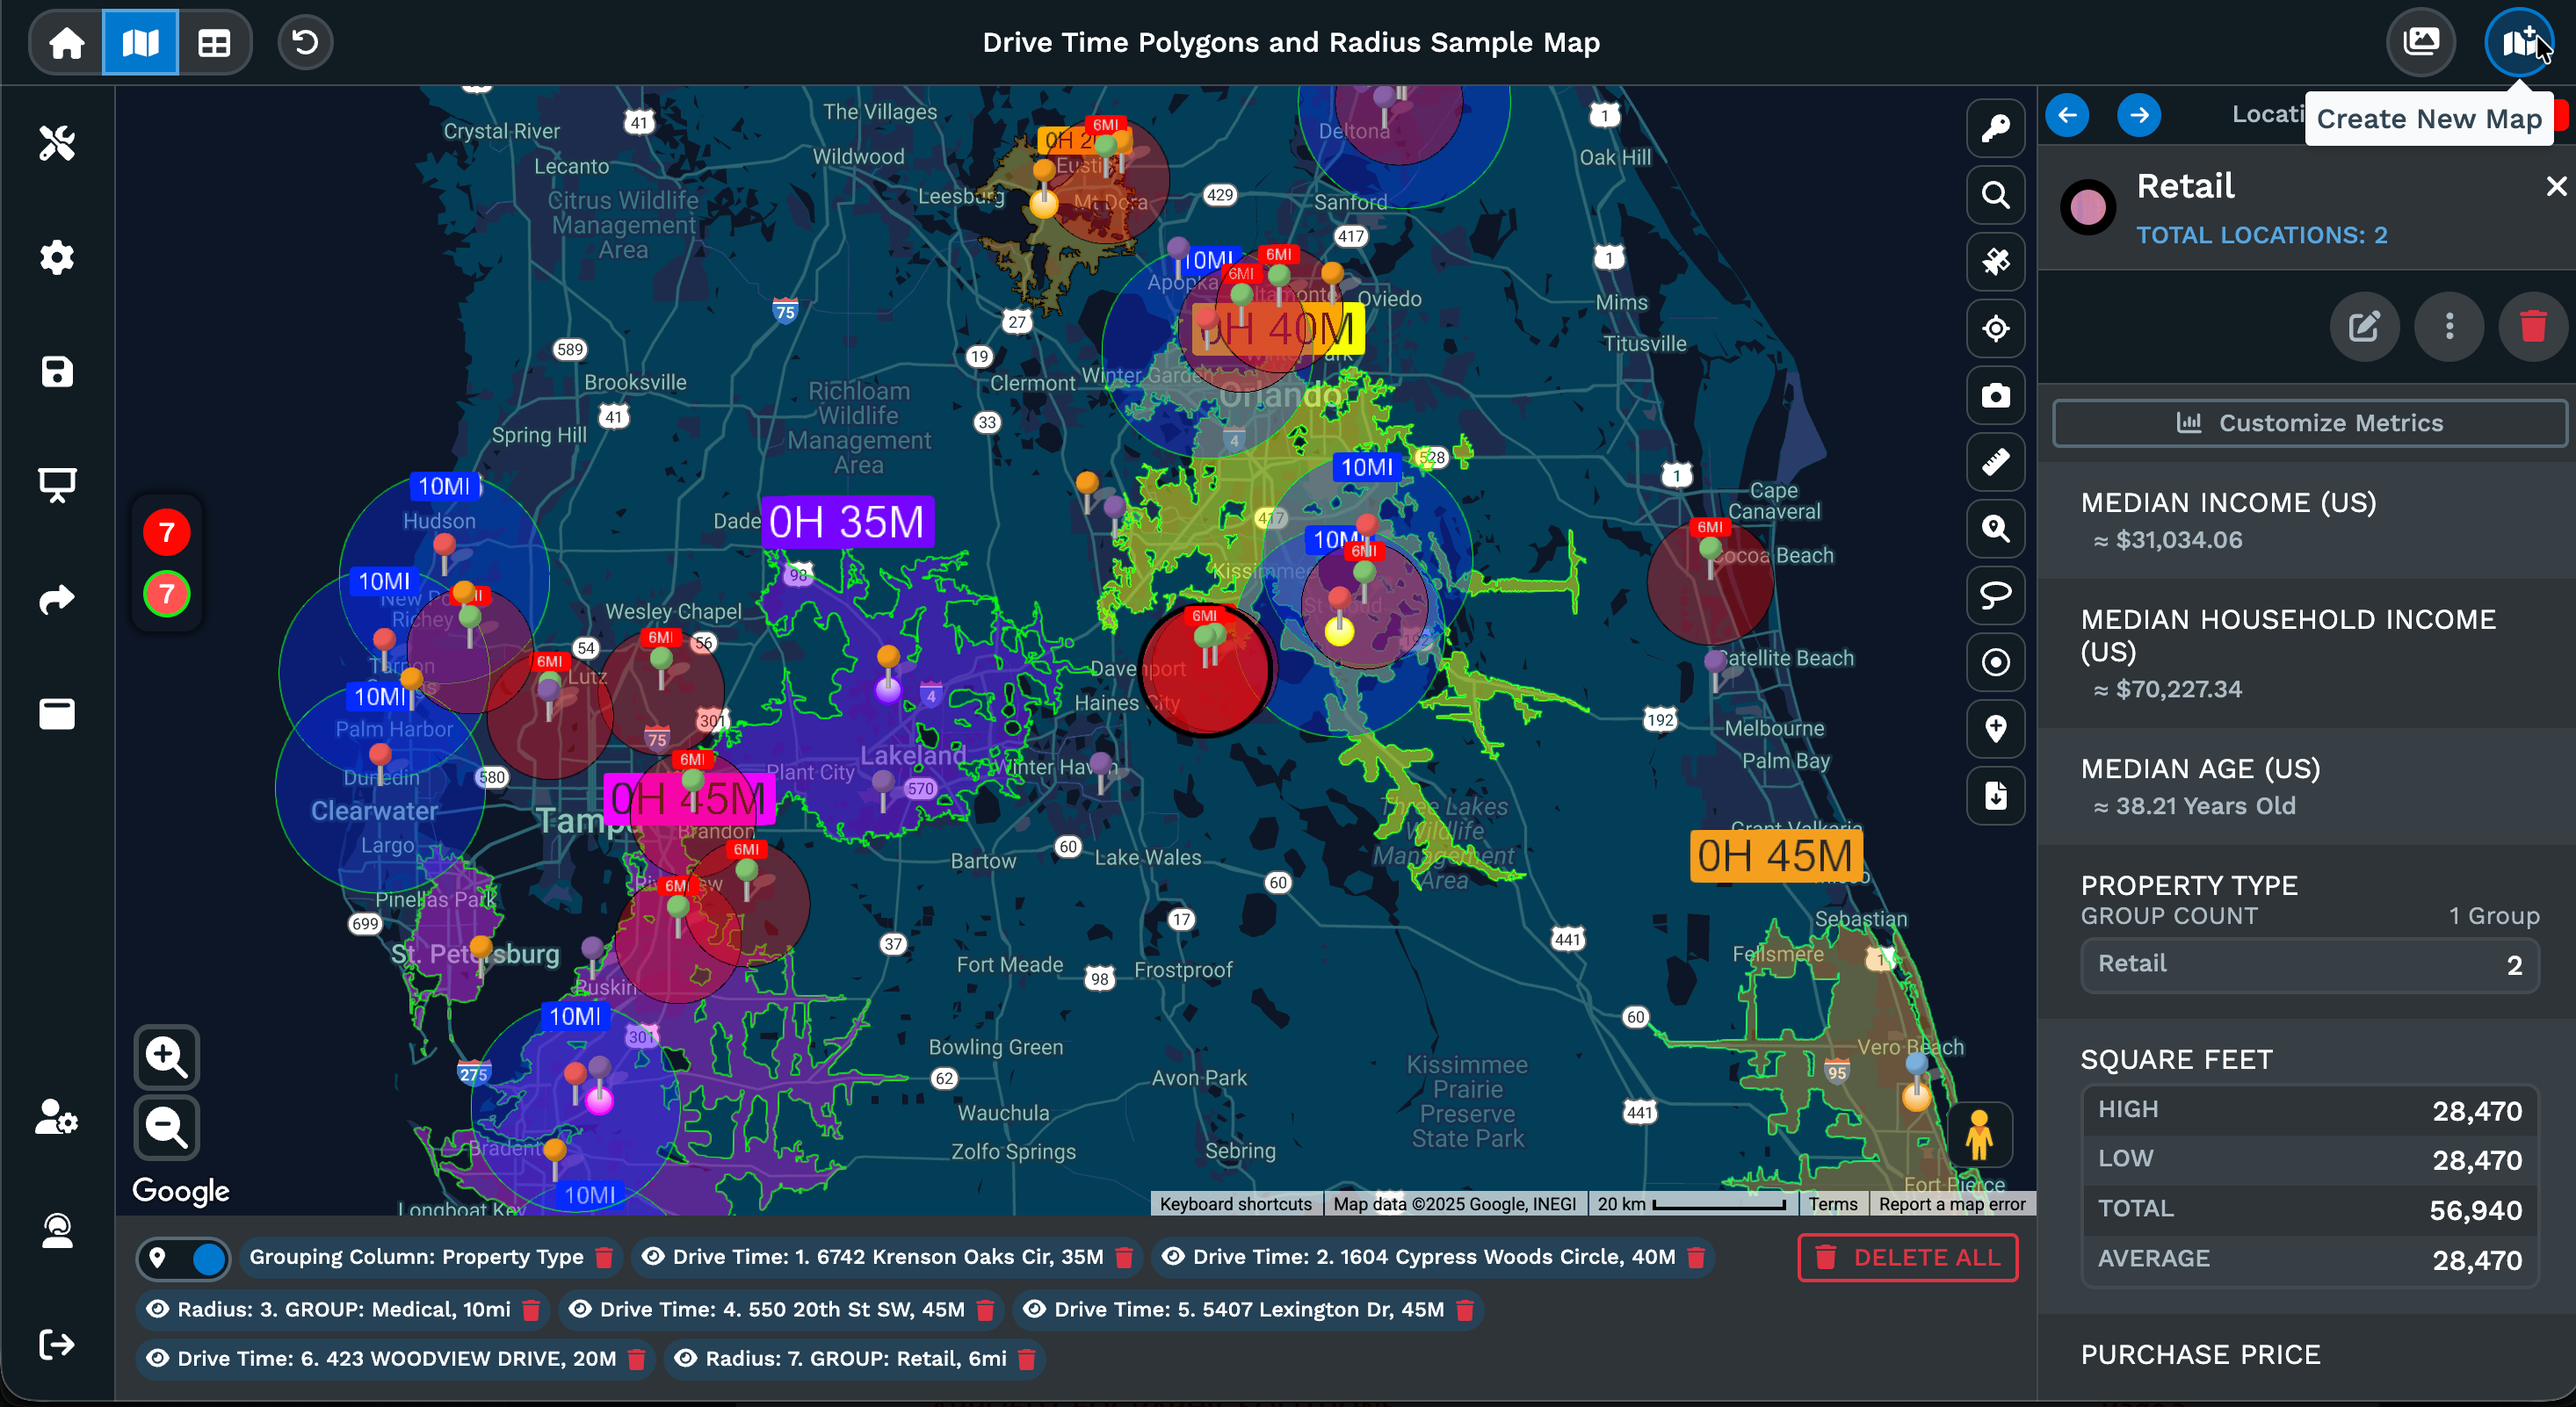
Isochrone Mapping
Drive time polygons calculate using actual road networks with accuracy up to 4 hours (expanding to 8 hours). The polygons use 300% more calculation points than previous versions, creating accurate service areas that reflect real driving conditions. Drive time calculations incorporate live traffic conditions rather than static data.
- Road-network based calculations
- Live traffic integration
- 300% more calculation points
- 22% reduction in routing errors
- 15% fuel cost savings documented
Distance Matrix
Distance matrix calculations support complex routing scenarios. The platform's API processes over 1 million address lookups monthly with real-time updates. Google Maps' underlying routing engine combined with Maptive's optimization algorithms delivers computational power for complex multi-vehicle, multi-constraint routing scenarios.
- Multi-stop sequence optimization
- Drag-and-drop route customization
- Turn-by-turn navigation export
- Mobile device integration
- Real-time traffic updates
Spatial Analysis Tools
Radius tool creates fixed-distance circles while driving radius maps calculate reachable areas using actual road geometry. Proximity analysis identifies closest locations. Lasso tool selects points within drawn boundaries. Boundary tools calculate aggregate statistics for points within polygons. Results export to Excel or display as filtered subsets and statistical aggregations.
Demographics & Census Data
The platform includes integrated US Census data at state, county, zip code, census tract, and block group levels. Over 50 statistical variables are available including population density, median household income, age distribution, education levels, poverty rates, and ethnic composition.
Census Variables
Demographic census overlays integrate statistical variables with automatic aggregation across any boundary type. Data sources include US Census Bureau statistics and Canadian census data from Statistics Canada with regular updates from official government sources.
Geographic Levels
Data is available at multiple geographic levels with the ability to aggregate across boundaries. Map your data by county name, census tract code, or other geographic identifiers. Pre-loaded boundaries cover 30,000 US cities and towns, all state and county boundaries, Canadian provinces, and UK postcode areas.
- State level boundaries and statistics
- County level mapping by name or FIPS code
- ZIP code tabulation areas (43,000+)
- Census tract mapping by code
- Block group precision
- Canadian provinces with Statistics Canada data
- UK postcode areas and districts
Data Expansion
Maptive is integrating 100,000+ datasets through data partnerships, expanding the platform into a comprehensive location intelligence system. This expansion includes consumer spending patterns, income breakdowns by geographic area, healthcare utilization statistics, and industry-specific demographic variables. Maptive iQ demographic overlays access mobile signals and purchasing trends with up to 90% precision for pinpointing underserved areas.
Data Layers
Maptive integrates over 100,000 data layers through a strategic partnership with an industry-leading data provider with over 30 years of experience serving Fortune 500 companies and major enterprises. These datasets cover consumer behavior, healthcare utilization, financial characteristics, real estate metrics, and industry-specific variables, all accessible directly within your maps for instant geographic analysis.
Consumer & Retail Data
- Demographics: Population, age, gender, ethnicity, household composition
- Income: Household income, disposable income, discretionary spending
- Consumer Expenditure: Grocery, apparel, electronics, furniture, restaurants
- Retail Potential: Market demand indices by product category
- Credit Characteristics: Credit scores, debt levels, financial behavior
Healthcare & Medical
- Hospital Discharges: Inpatient discharge data by condition
- ED Visits: Emergency department utilization rates
- Chronic Disease: Prevalence rates for diabetes, heart disease, COPD
- Medicare Enrollment: Coverage types and beneficiary counts
- Healthcare Access: Provider density, facility proximity
Financial & Real Estate
- Net Worth: Asset distribution by geographic area
- Property Values: Median home values, price trends
- Housing Characteristics: Owner vs renter, housing age, unit types
- Mortgage Data: Loan values, rates, refinancing activity
- Business Density: Commercial activity metrics by area
Industry-Specific Data
- Automotive: Vehicle ownership, makes, purchase behavior
- Solar & Energy: Rooftop potential, energy consumption
- Tourism & Travel: Visitor patterns, lodging demand
- Education: School enrollment, attainment levels
- Employment: Industry mix, occupation types, commute patterns
Complete Data Category List
The following categories are available for geographic overlay and analysis:
Proprietary Data & Predictive Analytics
Data layers include proprietary datasets not publicly available, providing competitive advantages for market analysis and site selection. Beyond current statistics, the platform offers historical trends, future projections, and predictive analytics to support strategic planning and forecasting decisions.
Use Cases by Industry
Maptive iQ Enhancement
Maptive iQ expands data layer capabilities with mobile signal analysis and purchasing behavior patterns. The AI-powered analysis achieves up to 90% precision for identifying underserved markets and optimal expansion territories.
- Mobile signal foot traffic patterns
- Real-time purchasing behavior signals
- Competitive location intelligence
- Market saturation analysis
- Expansion opportunity scoring
- Demographic trend forecasting
Enterprise Integration
Direct CRM integrations with Salesforce, HubSpot, Zoho, Pipedrive, and Keap feature bidirectional sync that updates territory maps automatically when new data points are added. The REST API enables automated address lookups and territory assignments processing over 1 million addresses monthly.
CRM Integrations
Salesforce users currently sync 50,000+ leads weekly with under 90-second lag between CRM updates and map refresh. Real-time data updates refresh maps in seconds after operational system pushes via scheduled jobs or webhook triggers.
- Salesforce bidirectional sync
- HubSpot integration
- Zoho CRM connectivity
- Pipedrive data sync
- Keap integration
Data Connectivity
Enterprise integration extends through Google Sheets connectivity, Excel and CSV import workflows, HTML embed codes for website integration, and custom API connections to internal databases and legacy systems.
- Google Sheets real-time sync
- REST API for automation
- Webhook trigger support
- HTML embed codes
- Scheduled batch jobs
Security Architecture
Security architecture includes 256-bit SSL encryption for data in transit and at rest, role-based access controls with granular permissions, audit logging, and regional data storage selection for compliance requirements. Two-factor authentication and single sign-on (SSO) provide enhanced account protection.
| Integration Feature | Capability | Update Frequency |
|---|---|---|
| Salesforce Sync | Bidirectional lead and account data | Under 90 seconds |
| Google Sheets | Real-time data synchronization | Automatic on change |
| REST API | Address lookups, territory assignments | Real-time |
| Webhook Triggers | Event-driven map updates | On event |
| Batch Processing | Scheduled data imports | Configurable |
Cloud Infrastructure
Maptive delivers enterprise-grade reliability with robust cloud infrastructure featuring hardware redundancy, automatic failover mechanisms, and comprehensive security protocols. The platform maintains 99.9% uptime with zero major outages documented in 2025.
Platform Benefits
Browser-based architecture eliminates software installation requirements and compatibility issues across operating systems. Automatic data saving during processing prevents work loss from connection interruptions. The platform maintained zero documented major outages in 2025.
- No software installation required
- Cross-platform browser access
- Automatic progress saving
- Geographic redundancy
- Automatic software updates
Cloud Architecture Benefits
The cloud-based architecture eliminates traditional IT overhead while providing enterprise-grade reliability and performance.
- Zero capital expenditure on hardware
- No server maintenance costs
- Automatic software updates
- Scales with actual usage
- No IT staff intervention required
Enterprise Security
Maptive meets enterprise security standards required by Fortune 500 companies and government agencies. The platform has passed Salesforce AppExchange security review, demonstrating compliance with rigorous third-party security assessments. Security features include 256-bit SSL encryption for all data transmission, multi-factor authentication (MFA), single sign-on (SSO) integration, role-based access controls, comprehensive audit logging, and regional data storage options for compliance requirements.
Security Features
- Salesforce AppExchange security review passed
- 256-bit SSL encryption (data in transit and at rest)
- Multi-factor authentication (MFA)
- Single sign-on (SSO) integration
- Role-based access controls
- Comprehensive audit logging
Compliance & Access Control
- Granular user permissions
- Regional data storage selection
- Password-protected map sharing
- Viewer access restrictions
- Data column visibility controls
- Tool access permissions
Mobile Access
Maptive is fully mobile-accessible through modern web browsers on smartphones and tablets without requiring app downloads. The platform supports iOS, Android, and Windows mobile devices with responsive browser-based access.
Field teams use mobile access to update routes during traffic changes and capture notes without returning to office. Changes sync immediately to headquarters systems.
Mobile Features
- Address search and current location detection
- Location finder and grouping tools
- Filter tools and distance calculator
- Radius mapping and drive time polygons
- Route optimization with turn-by-turn directions
- Real-time sync across all devices
Customer Support
Maptive provides direct access to trained mapping experts through multiple support channels. Support is handled by people, not bots or automated scripts, and every user receives expert assistance regardless of plan level.
Support Channels
Multiple contact methods connect users with mapping experts during business hours. All channels are staffed by trained specialists who understand the platform's technical capabilities.
- Live Chat: Connects with an expert in minutes during business hours
- Phone: 888-788-2871 with immediate response or same-day callback
- Email: support@maptive.com with same business day response
- Scheduled Meetings: Book one-on-one sessions for complex implementations
Support Hours
Support operates Monday through Friday, 8:00 AM to 8:00 PM Eastern Time, providing coverage across North American business hours.
Expert Staff
Support is handled exclusively by trained mapping experts. No bots, AI assistants, or automated scripts. Users speak directly with specialists who understand spatial analysis and territory management.
Data Assistance
Support includes data import assistance and file cleanup at no extra cost. Team helps configure custom map setups, resolve formatting issues, and optimize data structures for mapping workflows.
Team Training
Training sessions available for teams adopting the platform. Ongoing support with no artificial limits on requests. Every user receives identical expert support regardless of plan level.
User Reviews
"The Maptive support team is top notch and have always taken all the time necessary to answer my questions." Reviews on G2 and Capterra consistently cite ease of use, responsive customer service, and fast setup as key platform strengths.
Team Location
Development teams operate from the United States and Canada with American leadership. The US-based support team handles all customer inquiries directly from San Francisco headquarters.
Address: 548 Market St, Suite 46873, San Francisco, CA 94104
Contact Information
- Support Phone: 888-788-2871
- Support Email: support@maptive.com
- Sales Email: sales@maptive.com
- Hours: Mon-Fri, 8 AM - 8 PM ET
Technical Specifications
Complete technical reference for platform capabilities, supported formats, and operational limits.
| Maximum locations per map | 100,000 |
| WebGL marker rendering | 200,000+ |
| Geocoding capacity | Enterprise-scale |
| Batch processing speed | 50K rows/30sec |
| Address plotting rate | 10/second |
| Route optimization stops | 73 per trip |
| Drive time polygon range | Up to 8 hours |
| Data Import | Excel, CSV, Google Sheets |
| Data Export | CSV, Clipboard |
| Image Export | PNG, PDF |
| Max Export Resolution | 5120x3200 pixels |
| Custom Marker Size | Fully Customizable |
| Coordinate Systems | Lat/Long, Address |
Geoprocessing Operations
The platform performs geoprocessing operations through its browser interface without requiring desktop GIS software.
Buffers
Radius tool creates fixed-distance circles. Drive time polygons generate road-network isochrones. Driving radius maps calculate reachable areas using actual road geometry.
Overlays
Demographic census tool layers statistical variables over user data. Boundary-to-polygon conversion allows territory editing. Marker-to-boundary matching colors territories based on point locations.
Boundaries
Geographic Boundary Tool aggregates postal codes, counties, or districts by matching codes and calculating combined statistics. Automated territory creation merges boundary sets using data inputs.
Spatial Joins
Combine data across layers by geographic location. Radius tool exports points within circles. Drive time polygons extract enclosed markers. Lasso tool selects points within drawn boundaries.
Area Dissolves
Merge adjacent boundaries into unified territories. Combine postal codes, counties, or custom regions into larger aggregated areas while calculating combined statistics automatically.
Pricing Structure
Maptive pricing starts at $250 for a 45-day pass, $1,250 annually for individuals, and $2,500 annually for teams supporting up to 1,000,000 geocodes monthly. All features included without tiered restrictions.
| Plan | Price | Geocodes | Features |
|---|---|---|---|
| 45-Day Pass | $250 | Included | Full access |
| Individual Annual | $1,250/year | Up to 400K/month | Full access |
| Team Annual | $2,500/year | Up to 1M/month | Full access + collaboration |
Enterprise Clients
Organizations across government, healthcare, retail, finance, manufacturing, and technology sectors use Maptive for territory management, route optimization, and spatial analysis operations.
Representative Organizations
The following organizations rely on Maptive for their mapping operations:
Documented Results
Organizations using Maptive report the following operational improvements: