Drive Time Polygon Tool
Need to know everywhere a driver can reach in 20 minutes from a hub address on your map? Open Drive Time Polygon, set the minutes, and the road-network area paints to scale.
Drive Time Reach From a Point
Add Drive Time Polygon: Type an address or click a marker, set hours and minutes, hit the button, and Maptive paints a polygon sized to road-network reach from that hub.
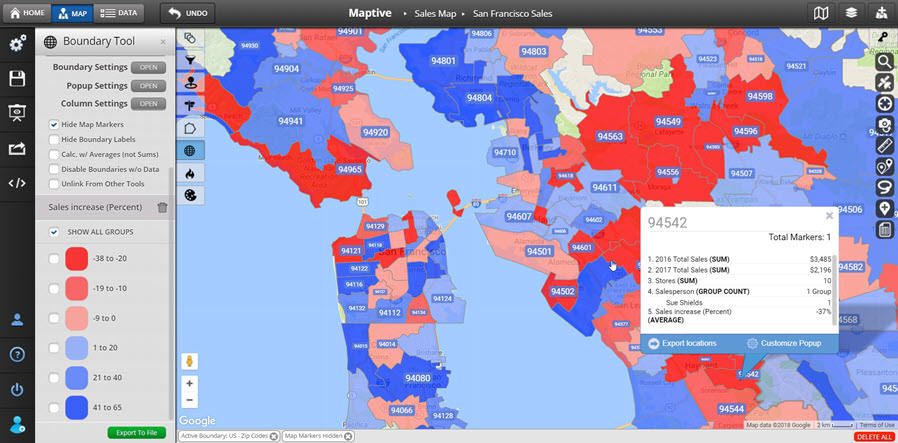
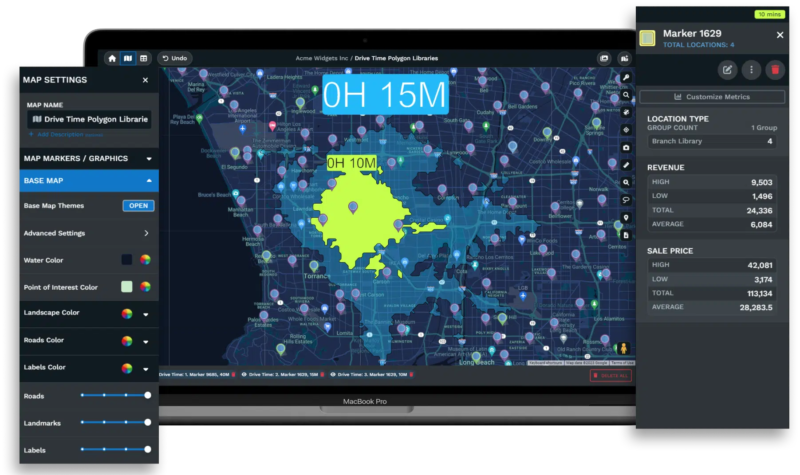
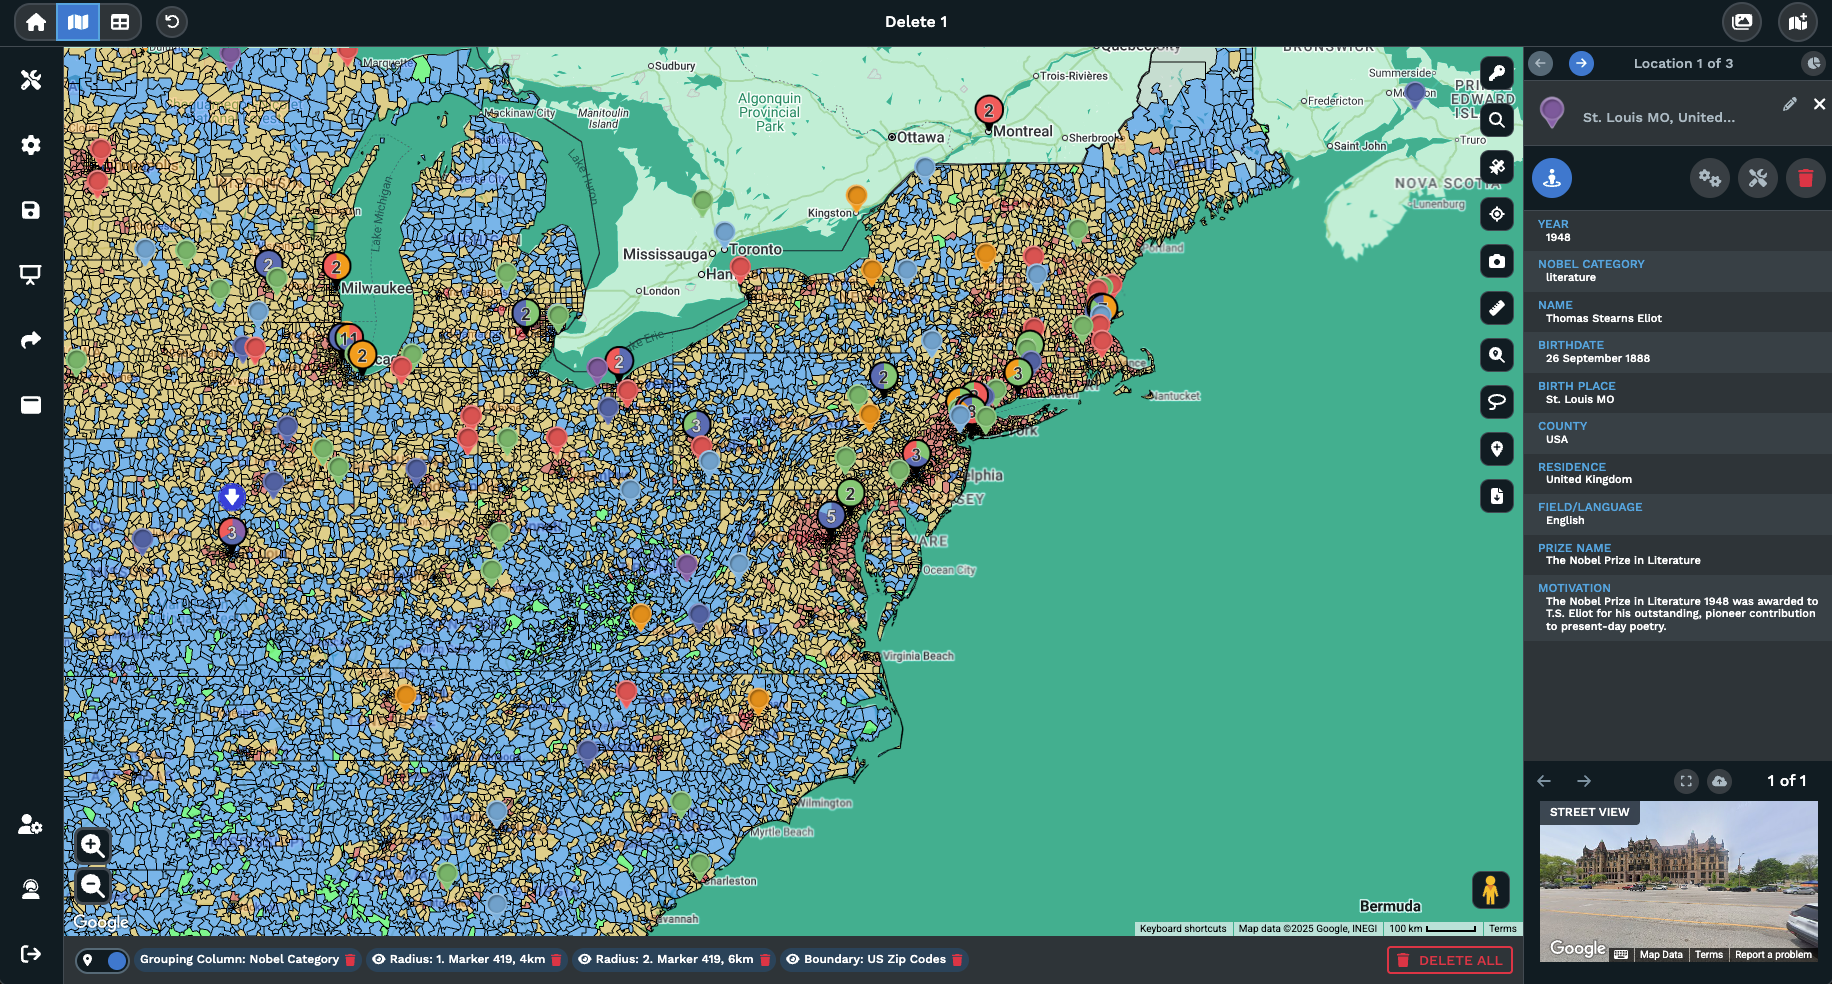
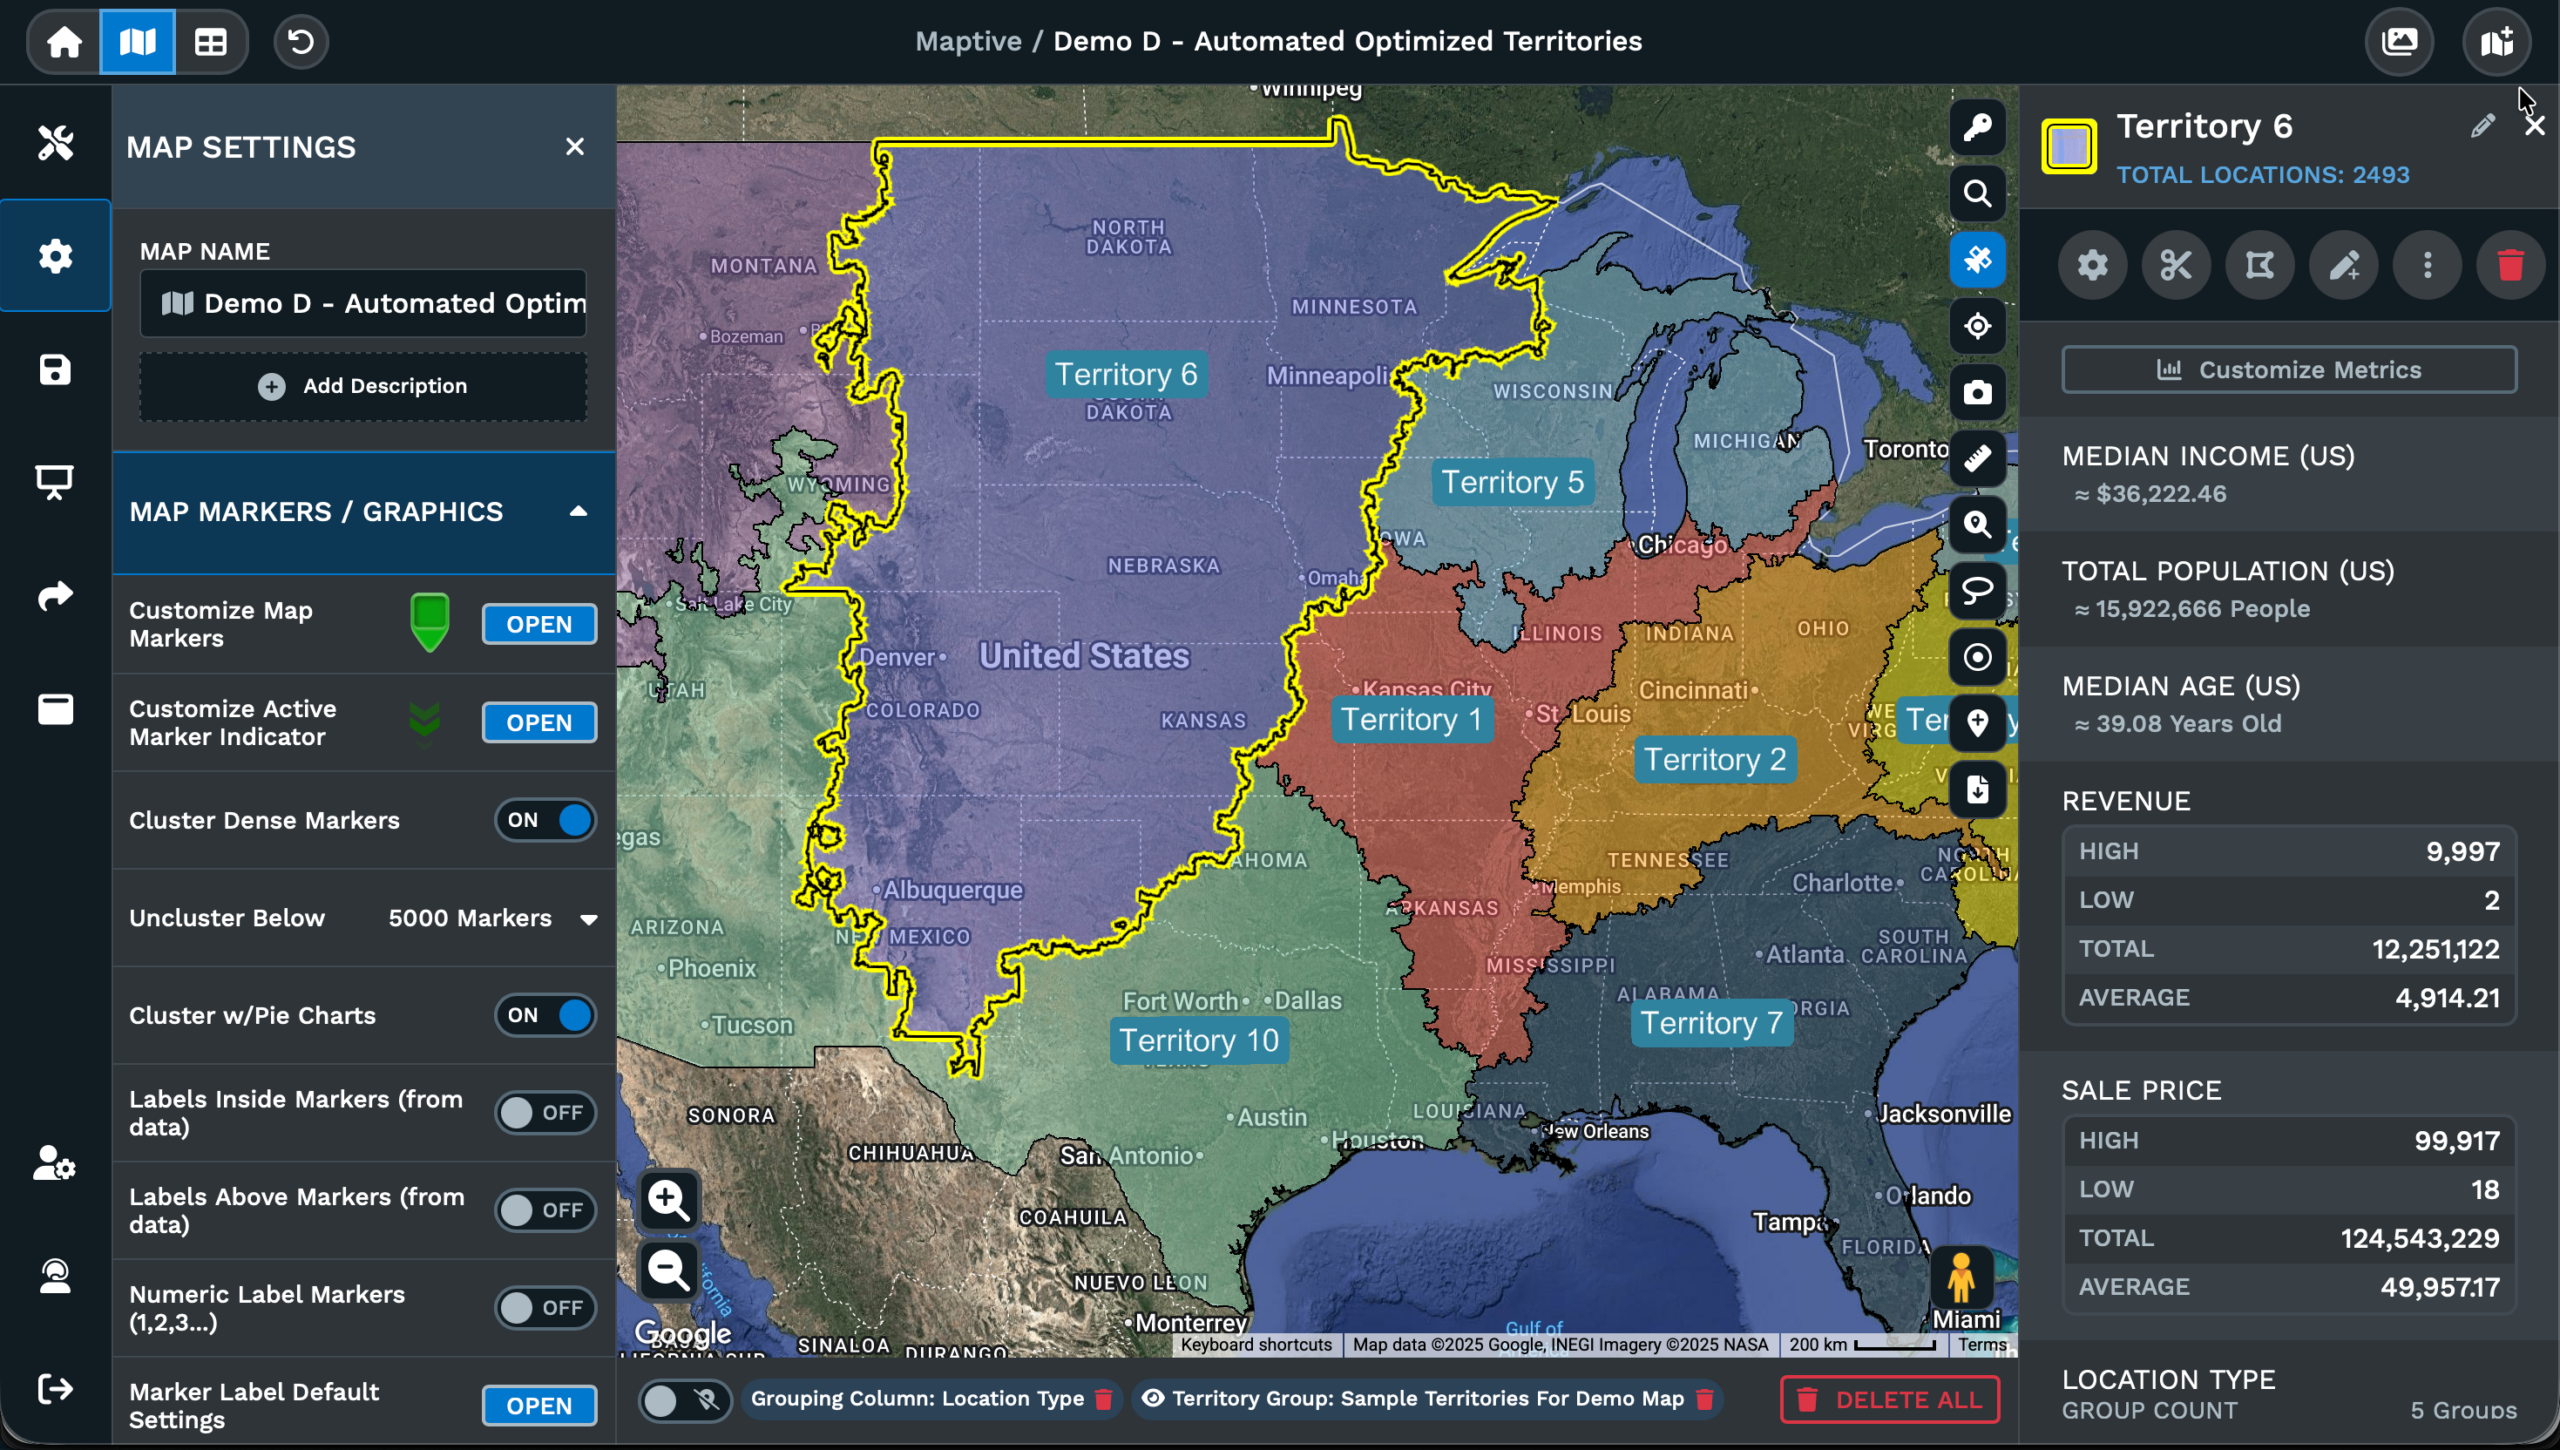
Right Side Panel: Click any polygon to open the panel listing the starting address, count of locations inside, and the aggregated totals across markers within the area.
Customize Metrics: Open Customize Metrics in the panel to pick which spreadsheet columns aggregate inside the polygon, so the totals match the variables your team uses.
Edit Proximity: Open the 3 dot menu, pick Edit Proximity, and the popup lets you rename, change color, change opacity, or change travel time on the polygon before Save.
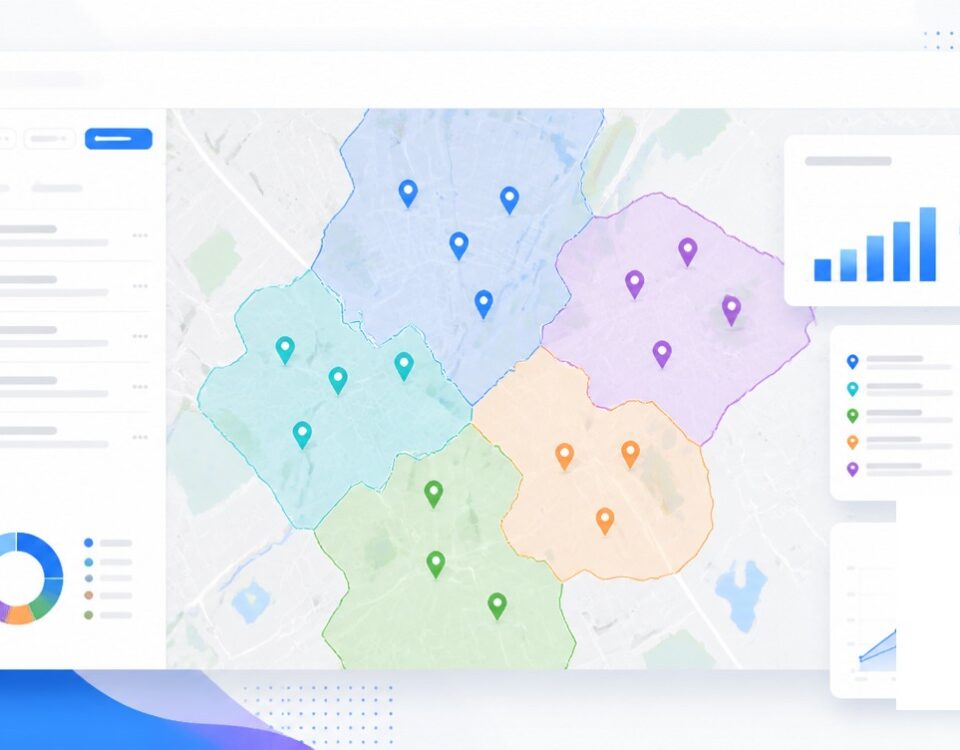
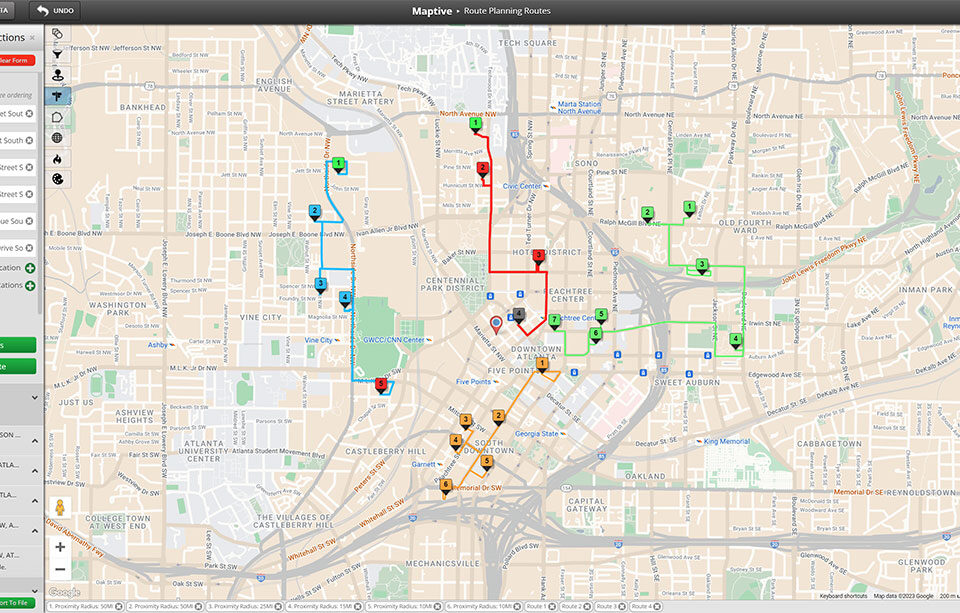
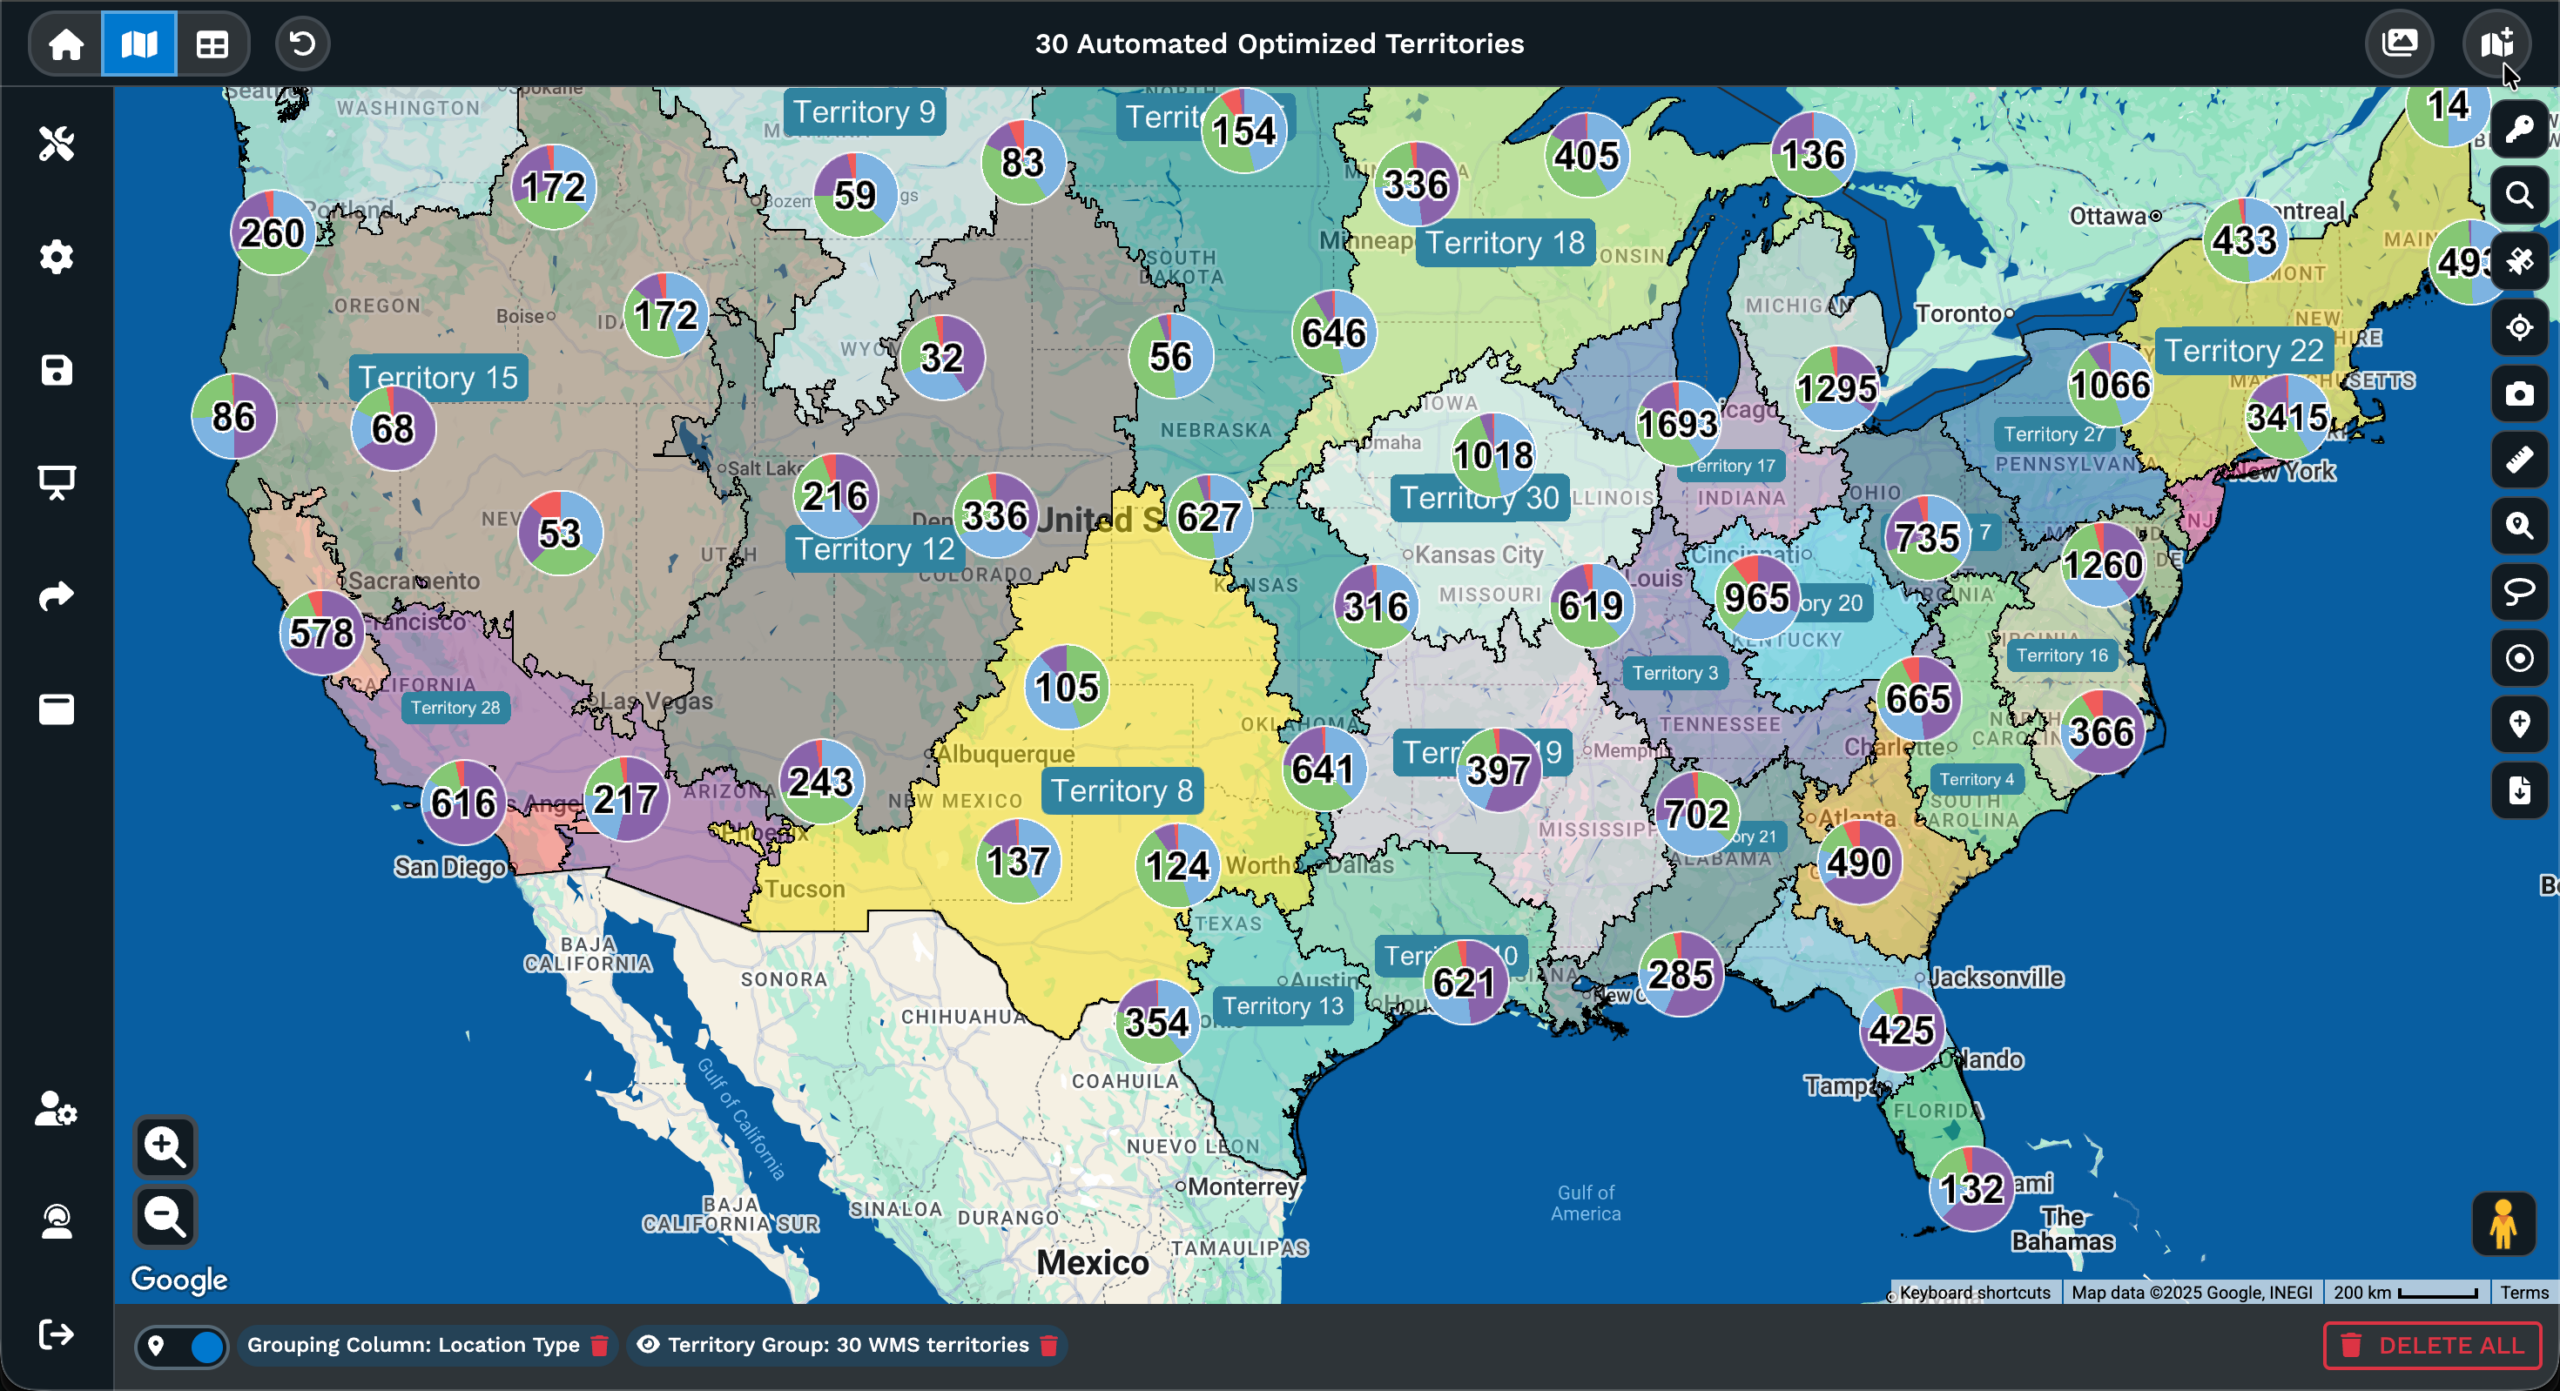
Multiple Polygons: Add a polygon for every site 1 at a time, and the map holds all of them so you can read overlap, count gaps, and check coverage side by side on a map.
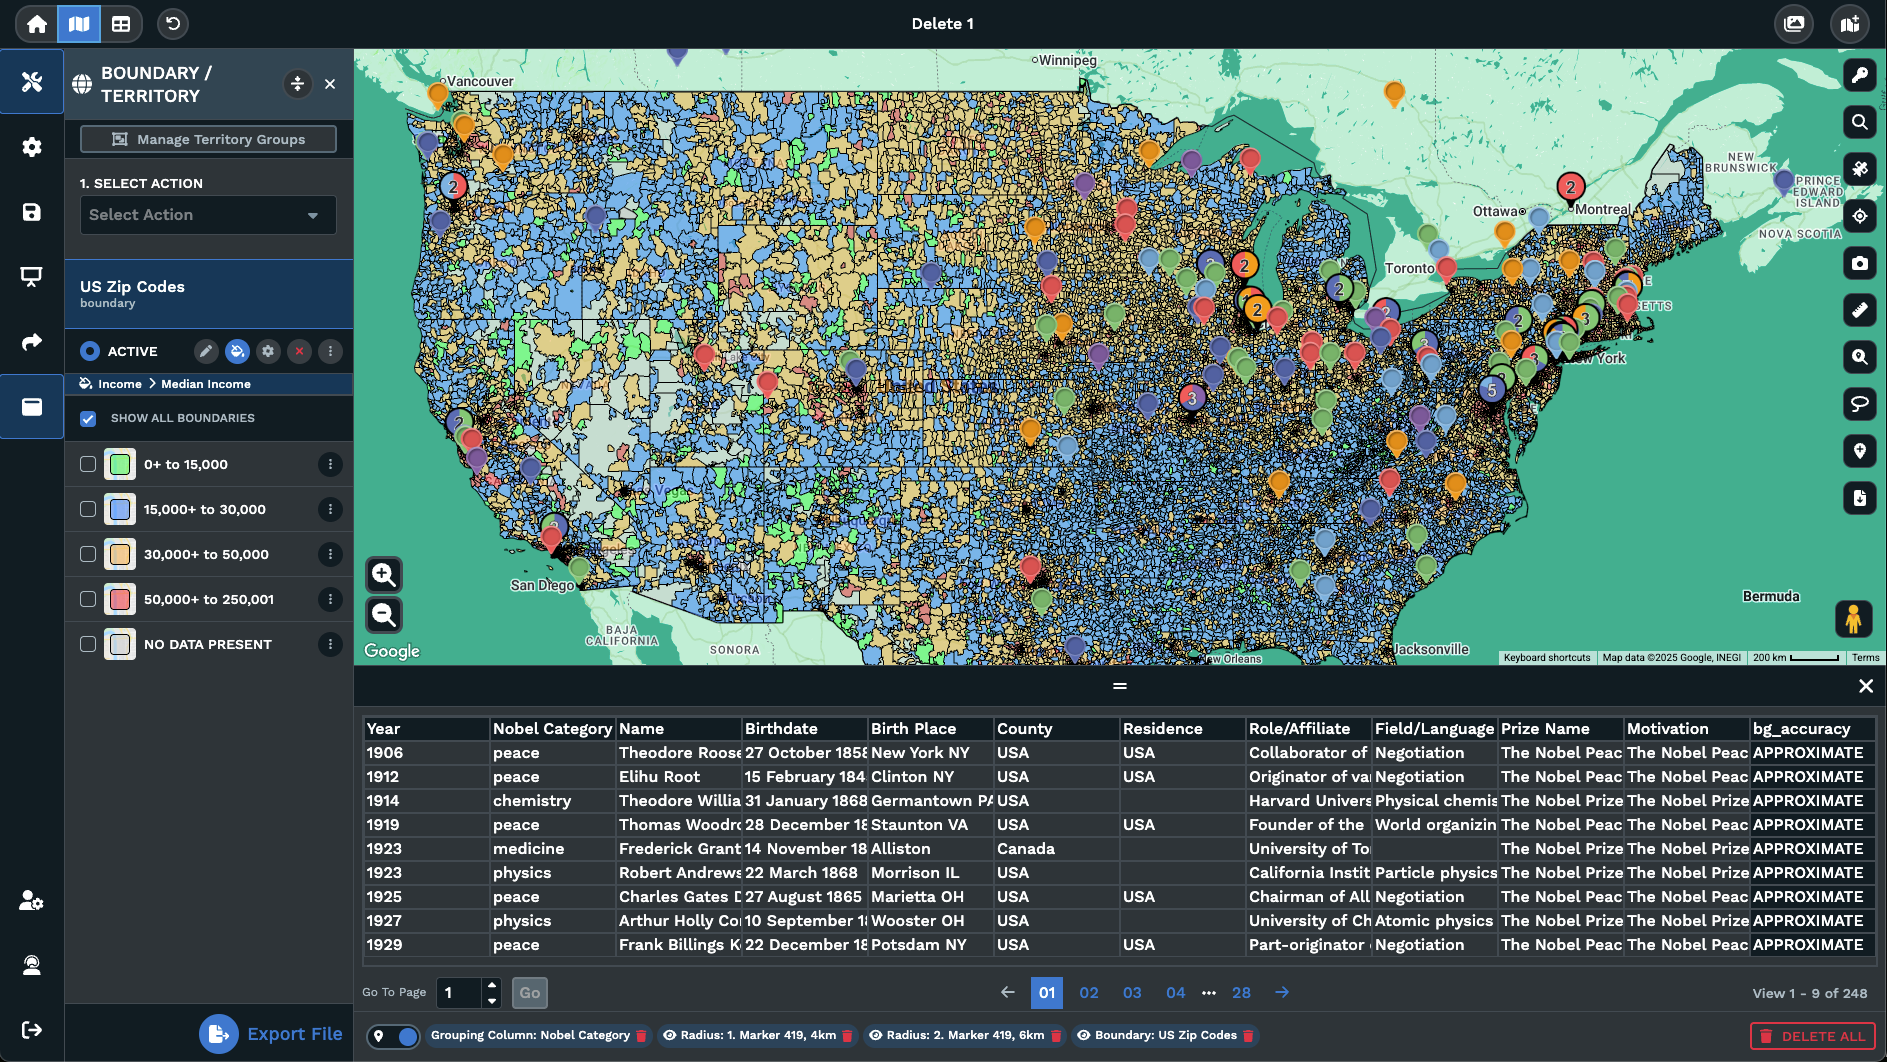
Export Locations: Open the 3 dot menu, pick Export Locations, and Maptive returns the rows from your dataset that fall inside the polygon for handoff to ops or sales.
Drive Time Polygons in 3 Steps
1
Open
Open Map Tools on your map, pick the Drive Time Polygon Tool, and the form to enter your starting point opens on screen.
2
Configure
Type an address or click a marker on the map, fill in hours and minutes, then click Add Drive Time Polygon to draw it.
3
View
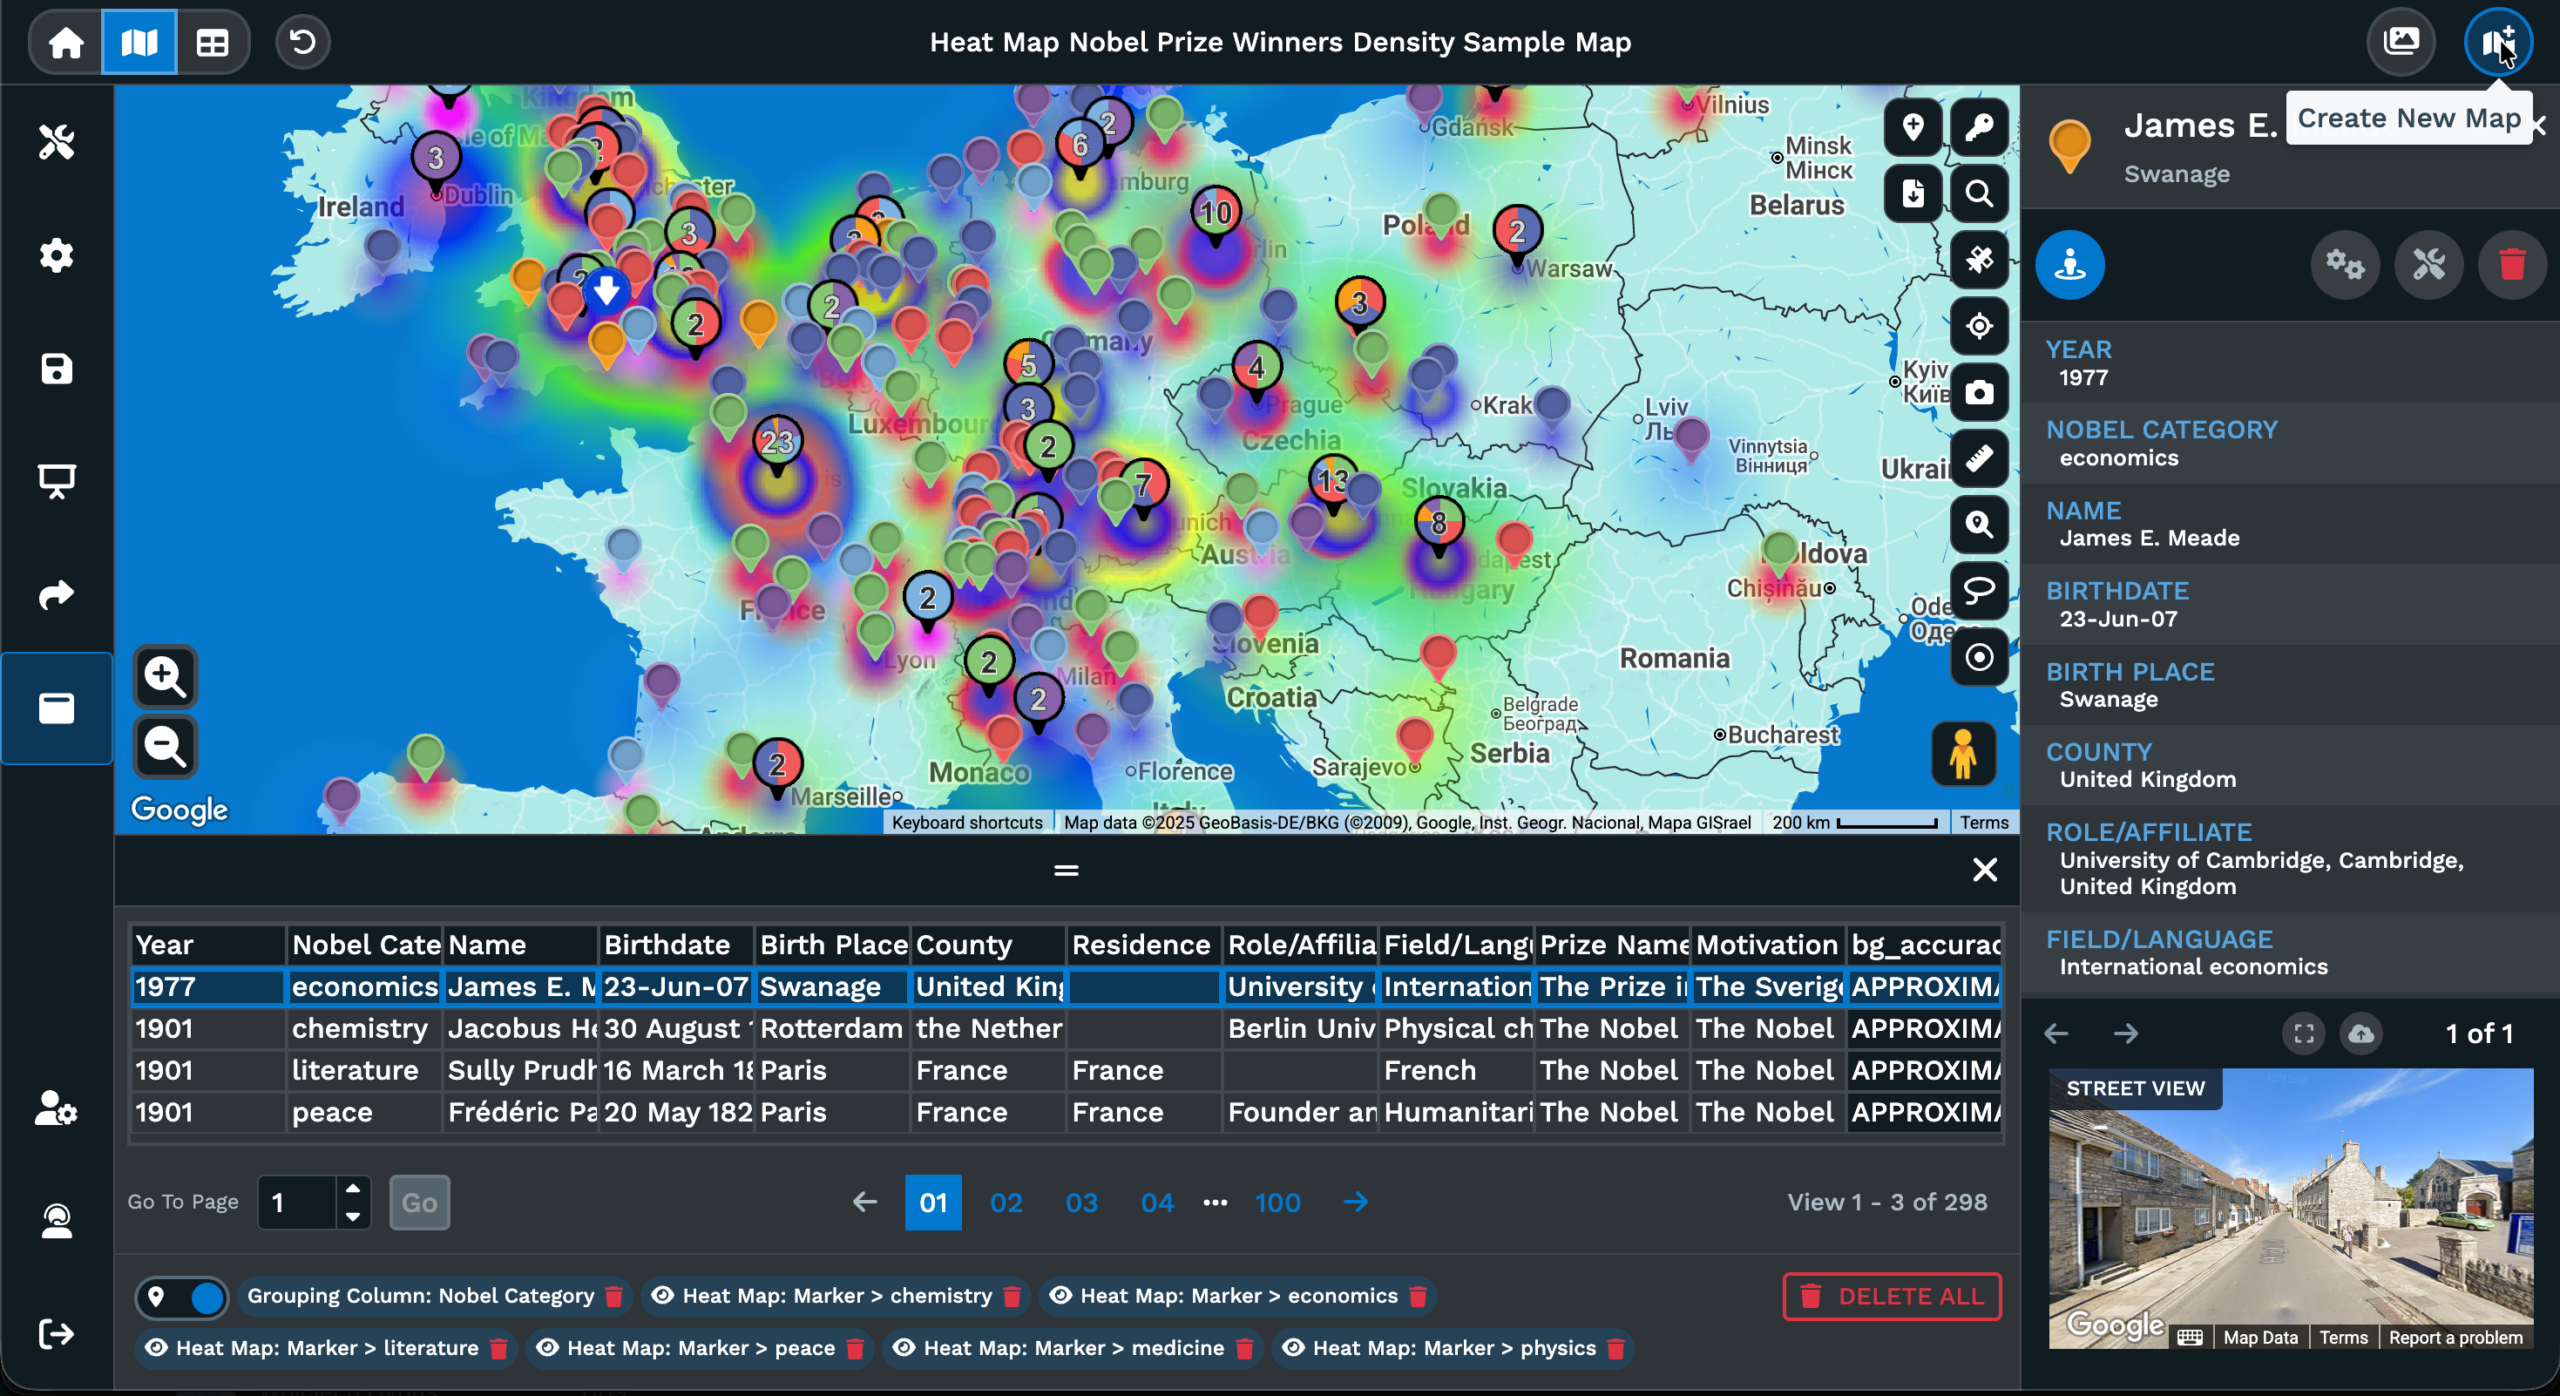
A ranked list of nearest matches arrives in the side panel, where you can zoom, route, or save as .xlsx, .tsv, or .csv.
Real Reach Area
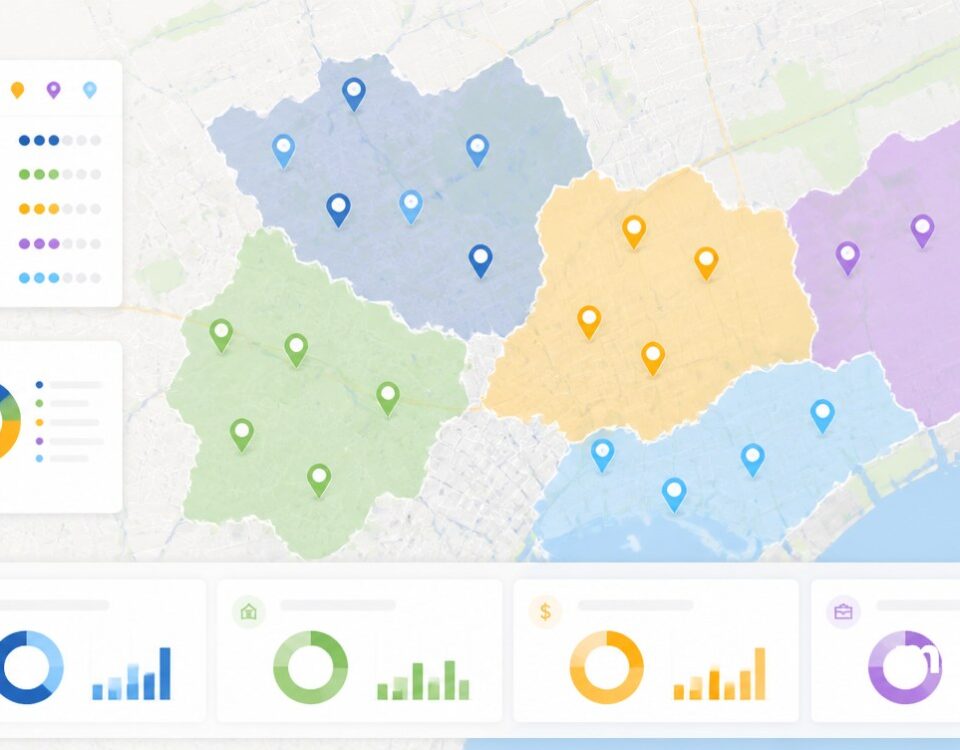
Compare Coverage Zones
Filter Locations Inside
Aggregated Marker Totals
Service Window Audit
Boundary List Output
Drive Time Reach vs Distance
Why Road-Network Reach
A radius circle around a point answers a different question than the question most location plans actually ask. The circle measures distance as the bird flies. Real driving rarely follows that line, because rivers, highways, 1-way grids, and speed limits all push the actual reach in directions a circle cannot describe. A 5-mile circle around an urban hub can leave out neighborhoods a driver can reach in 8 minutes, and pick up areas that a driver cannot reach in 20 minutes.
A drive time polygon answers the question the plan was after, which is everywhere a driver can reach from a point inside a time budget. The Drive Time Polygon Tool in Maptive renders that area to scale on the map for you. Type a starting address or click a marker, set hours and minutes, and the road-network footprint paints across the map for the team to act on.
The output behaves like a real area on the map. Locations inside the polygon count up in the right side panel. Aggregated totals across the markers inside roll up through Customize Metrics on the panel. Boundaries that fall fully or partially inside the polygon can be returned through the boundary export, so the road-network area becomes a postal-code list.
Building the Polygon
The Drive Time Polygon Tool sits inside Map Tools on your Maptive map. Open it from there, and a form opens for the starting point. Type the address you want the polygon centered on, or click a marker on the map and the address fills in from the right side menu. Set the time budget as hours and minutes for the polygon. Click Add Drive Time Polygon, and Maptive paints the road-network area a driver can cover in that time.
The polygon arrives in a list of selected proximities, with the eye icon to hide it from view, and a 3 dot menu for actions. Open the menu for Edit Proximity for renaming, color, opacity, and travel time, plus Delete Polygon with a confirmation popup before removal. Edit Proximity changes write back the moment you click Save, so a 15-minute polygon resizes to 30 minutes the same way a fresh polygon would.
Several polygons can sit on the map together, added 1 by 1 from the form. The map holds them all, so coverage from a hub network reads in a single view, with overlap and gaps visible. The Maptive docs note that drive time is based on perfect driving conditions and does not take historical or current traffic into account, which is worth keeping in mind for planning work.
Polygon vs Radius Read
Maptive maps support both circles and polygons because each answers a different question. The Distance Radius Tool draws a circle at set mileage around a point, the right pick when the question is purely distance from a hub. A 5-mile delivery radius, 20-mile branch area, or 100-mile rep range. The metric is direct, the math is symmetric, the circle treats every direction the same way around the hub.
A drive time polygon answers a different question. The starting point is the same, the export options are the same, and Customize Metrics works the same on the right side panel. The difference is the area on the map. The polygon follows roads, so a city with a river running through it produces a polygon with a notch where the river is, and grid layouts bend the area in directions a circle would never go.
A circle and a polygon can sit on the same map for a head-to-head read. Add a 5-mile circle from the Distance Radius Tool, then a 15-minute polygon from the Drive Time Polygon Tool centered on the same address. The map renders both. Export File on the polygon ships data for all polygons and radii on the map together, so a head-to-head view of distance versus drive-time reach is a single export.
FAQs
What is a drive time polygon?
A drive time polygon is the area a driver can reach from a starting point inside a set time budget, drawn to road-network scale on the map. The Drive Time Polygon Tool in Maptive paints this area for you. Type an address or click a marker, fill in hours and minutes, and click Add Drive Time Polygon. The polygon arrives sized to the road-network reach, with the count of locations inside, the boundaries it touches, and your aggregated marker data on the right side panel.
How is a drive time polygon different from a radius?
A radius circle measures pure distance from a point, equal in every direction around the hub. A drive time polygon measures the road-network area a driver can actually cover in a set number of minutes, so rivers, highways, and grid layouts bend the area into a real footprint. Maptive offers both. The Distance Radius Tool draws the circle, the Drive Time Polygon Tool draws the polygon. Add either or both on the same map for a head-to-head read on the same hub.
How do I create a drive time polygon in Maptive?
Open Map Tools, pick the Drive Time Polygon Tool, and the entry form opens on screen. Type the address you want the polygon centered on, or click a marker on the map and the address fills in from the right side menu. Add the number of hours and minutes you want the polygon to represent. Click Add Drive Time Polygon, and Maptive paints the road-network area to scale on the map. The output is a polygon you can click for stats, export, or edit later.
Does the drive time polygon account for traffic?
No. The Maptive docs state directly that drive time is based on perfect driving conditions and does not take historical or current traffic into account. The polygon represents the road-network footprint a driver could cover in the time you set under ideal conditions, with no rush-hour or weather drag built in. Keep this in mind when you size your time budget. A 30-minute polygon during off-peak hours is closer to reality than the same polygon read against a 5pm commute on a busy artery.
Can I add more than 1 polygon to my map?
Yes. The Drive Time Polygon Tool adds polygons 1 at a time from the form, and the map holds all of them together. Add 1 polygon for every site of interest at the same minute setting and the map renders overlap and gaps side by side. Each polygon has its own entry in the selected proximities list with an eye icon to hide it from view and a 3 dot menu for actions. Export File from any polygon menu ships data for all polygons and radii on the map together.
How do I export the markers inside a polygon?
Click the polygon on the map to highlight it, open the 3 dot menu on that polygon, and pick Export Locations. Maptive returns the rows from your dataset that fall inside the polygon area. The output covers only the markers within the polygon footprint, not your full dataset. To export the data across every polygon and radius on the map together, pick Export File from the same menu instead. Both options are accessed from the 3 dot menu attached to the polygon.
Can I get the zip codes inside a drive time polygon?
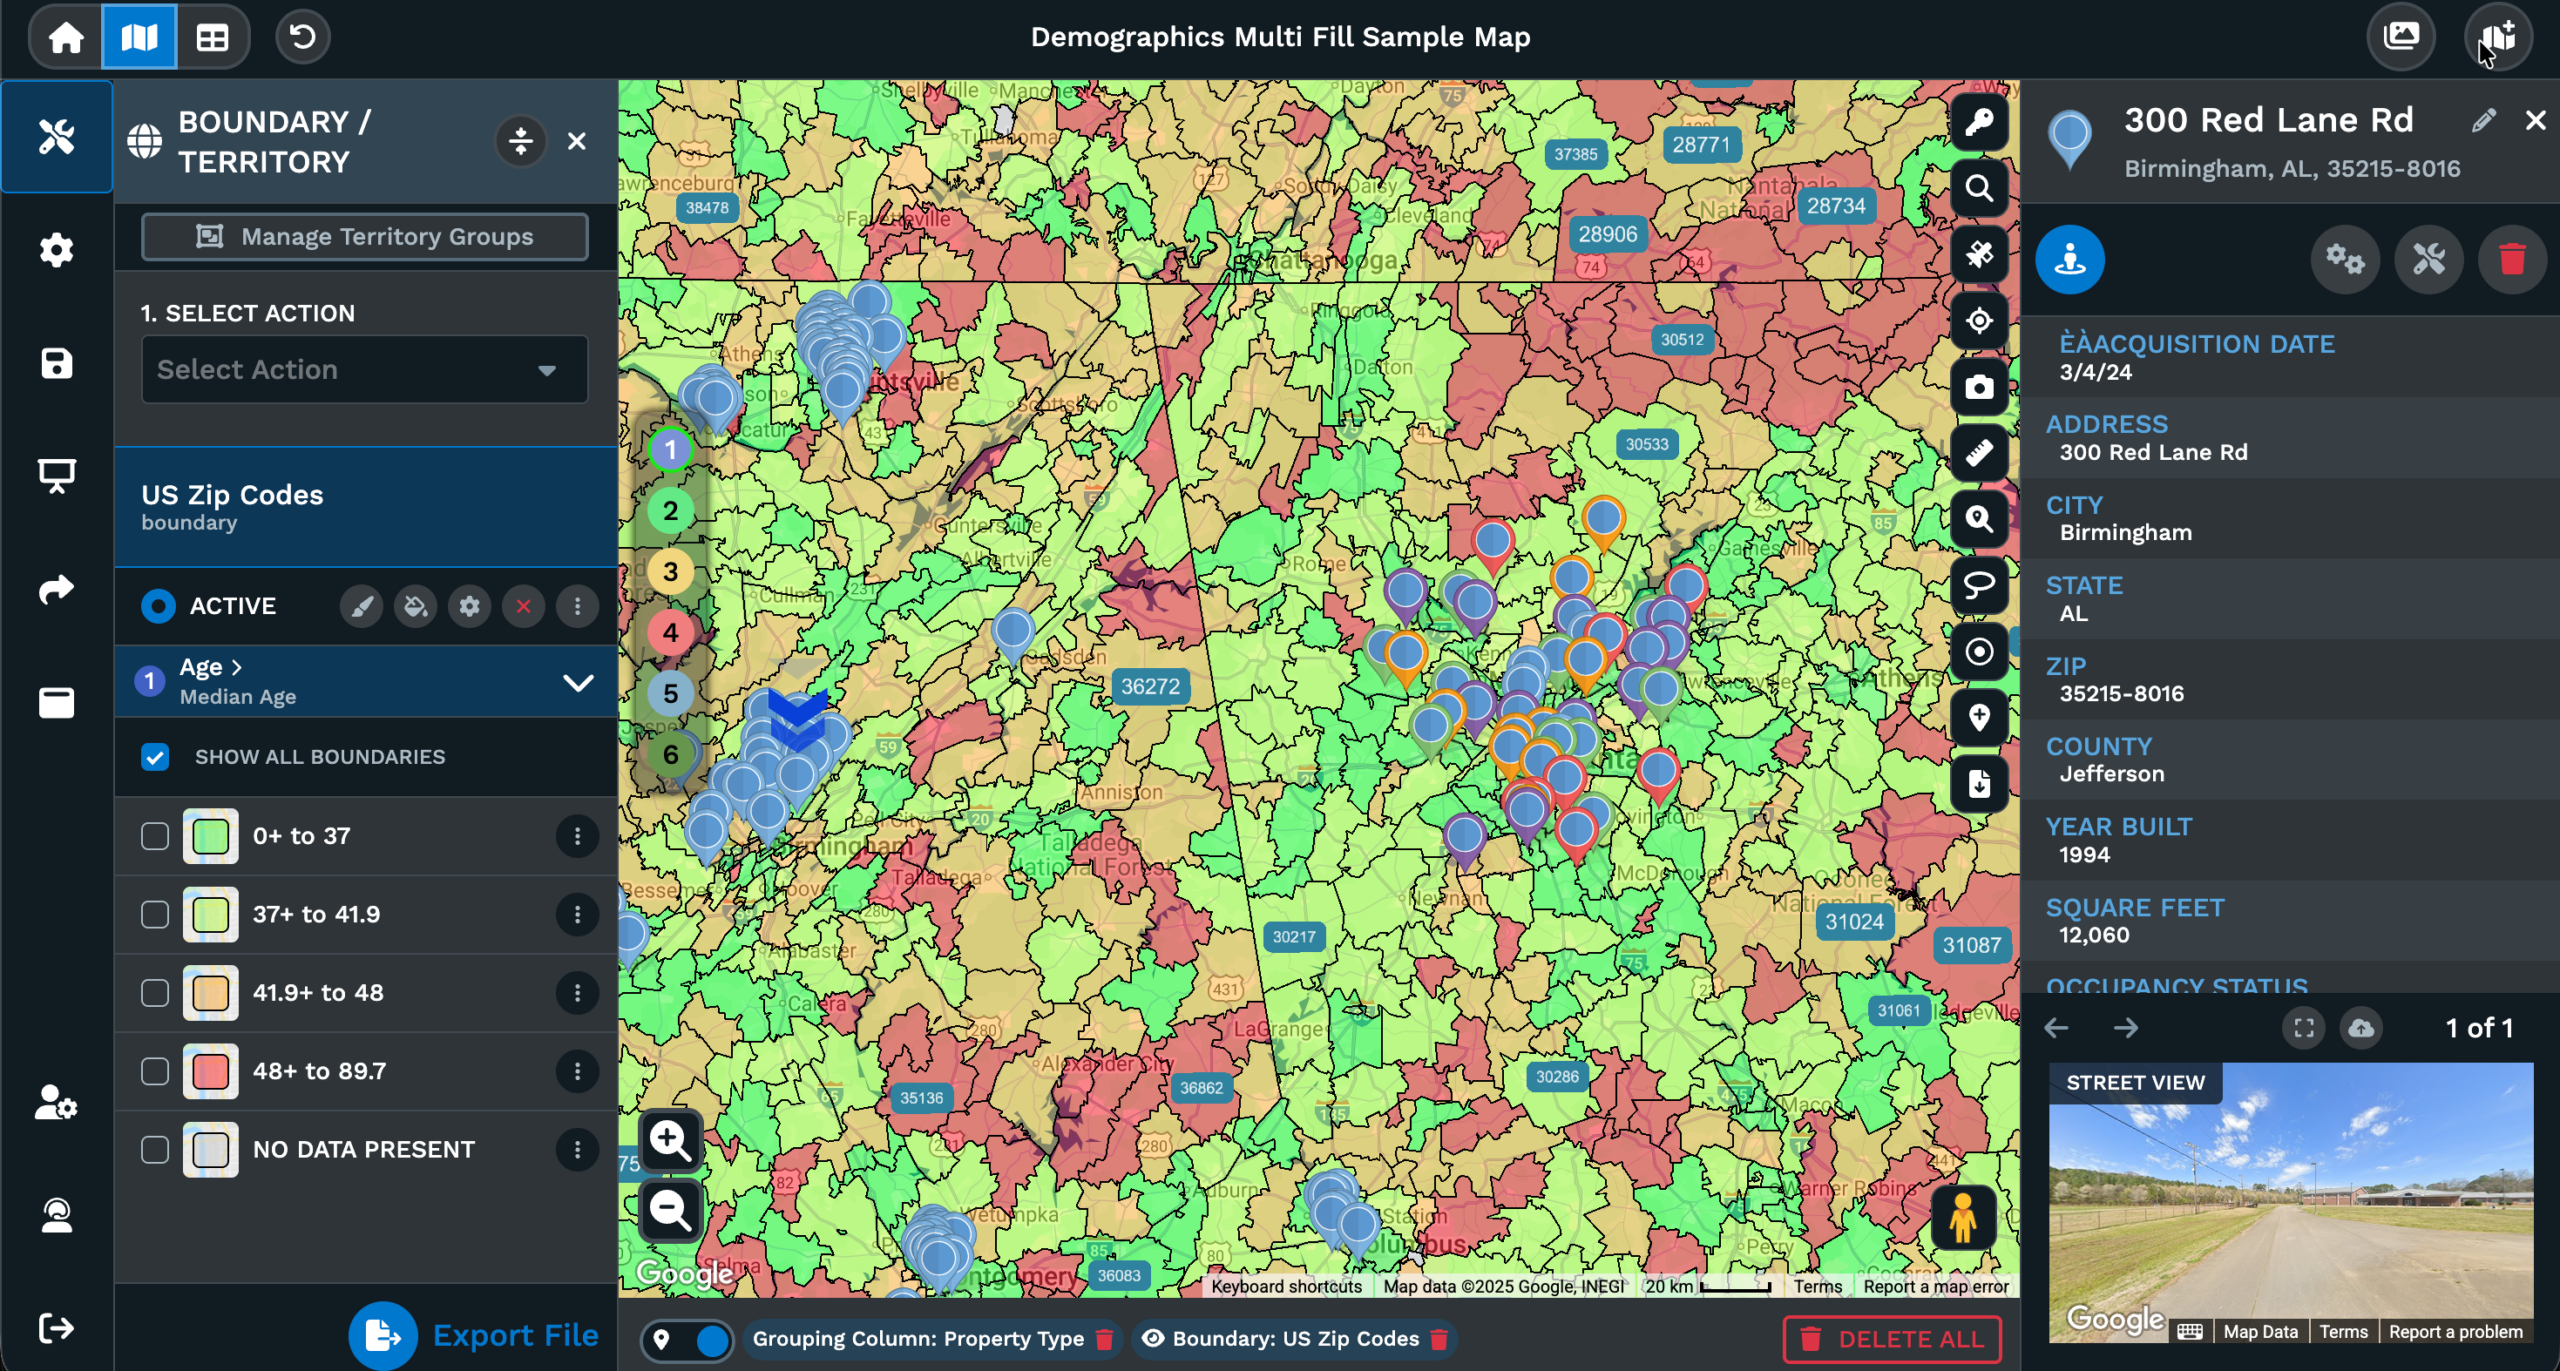
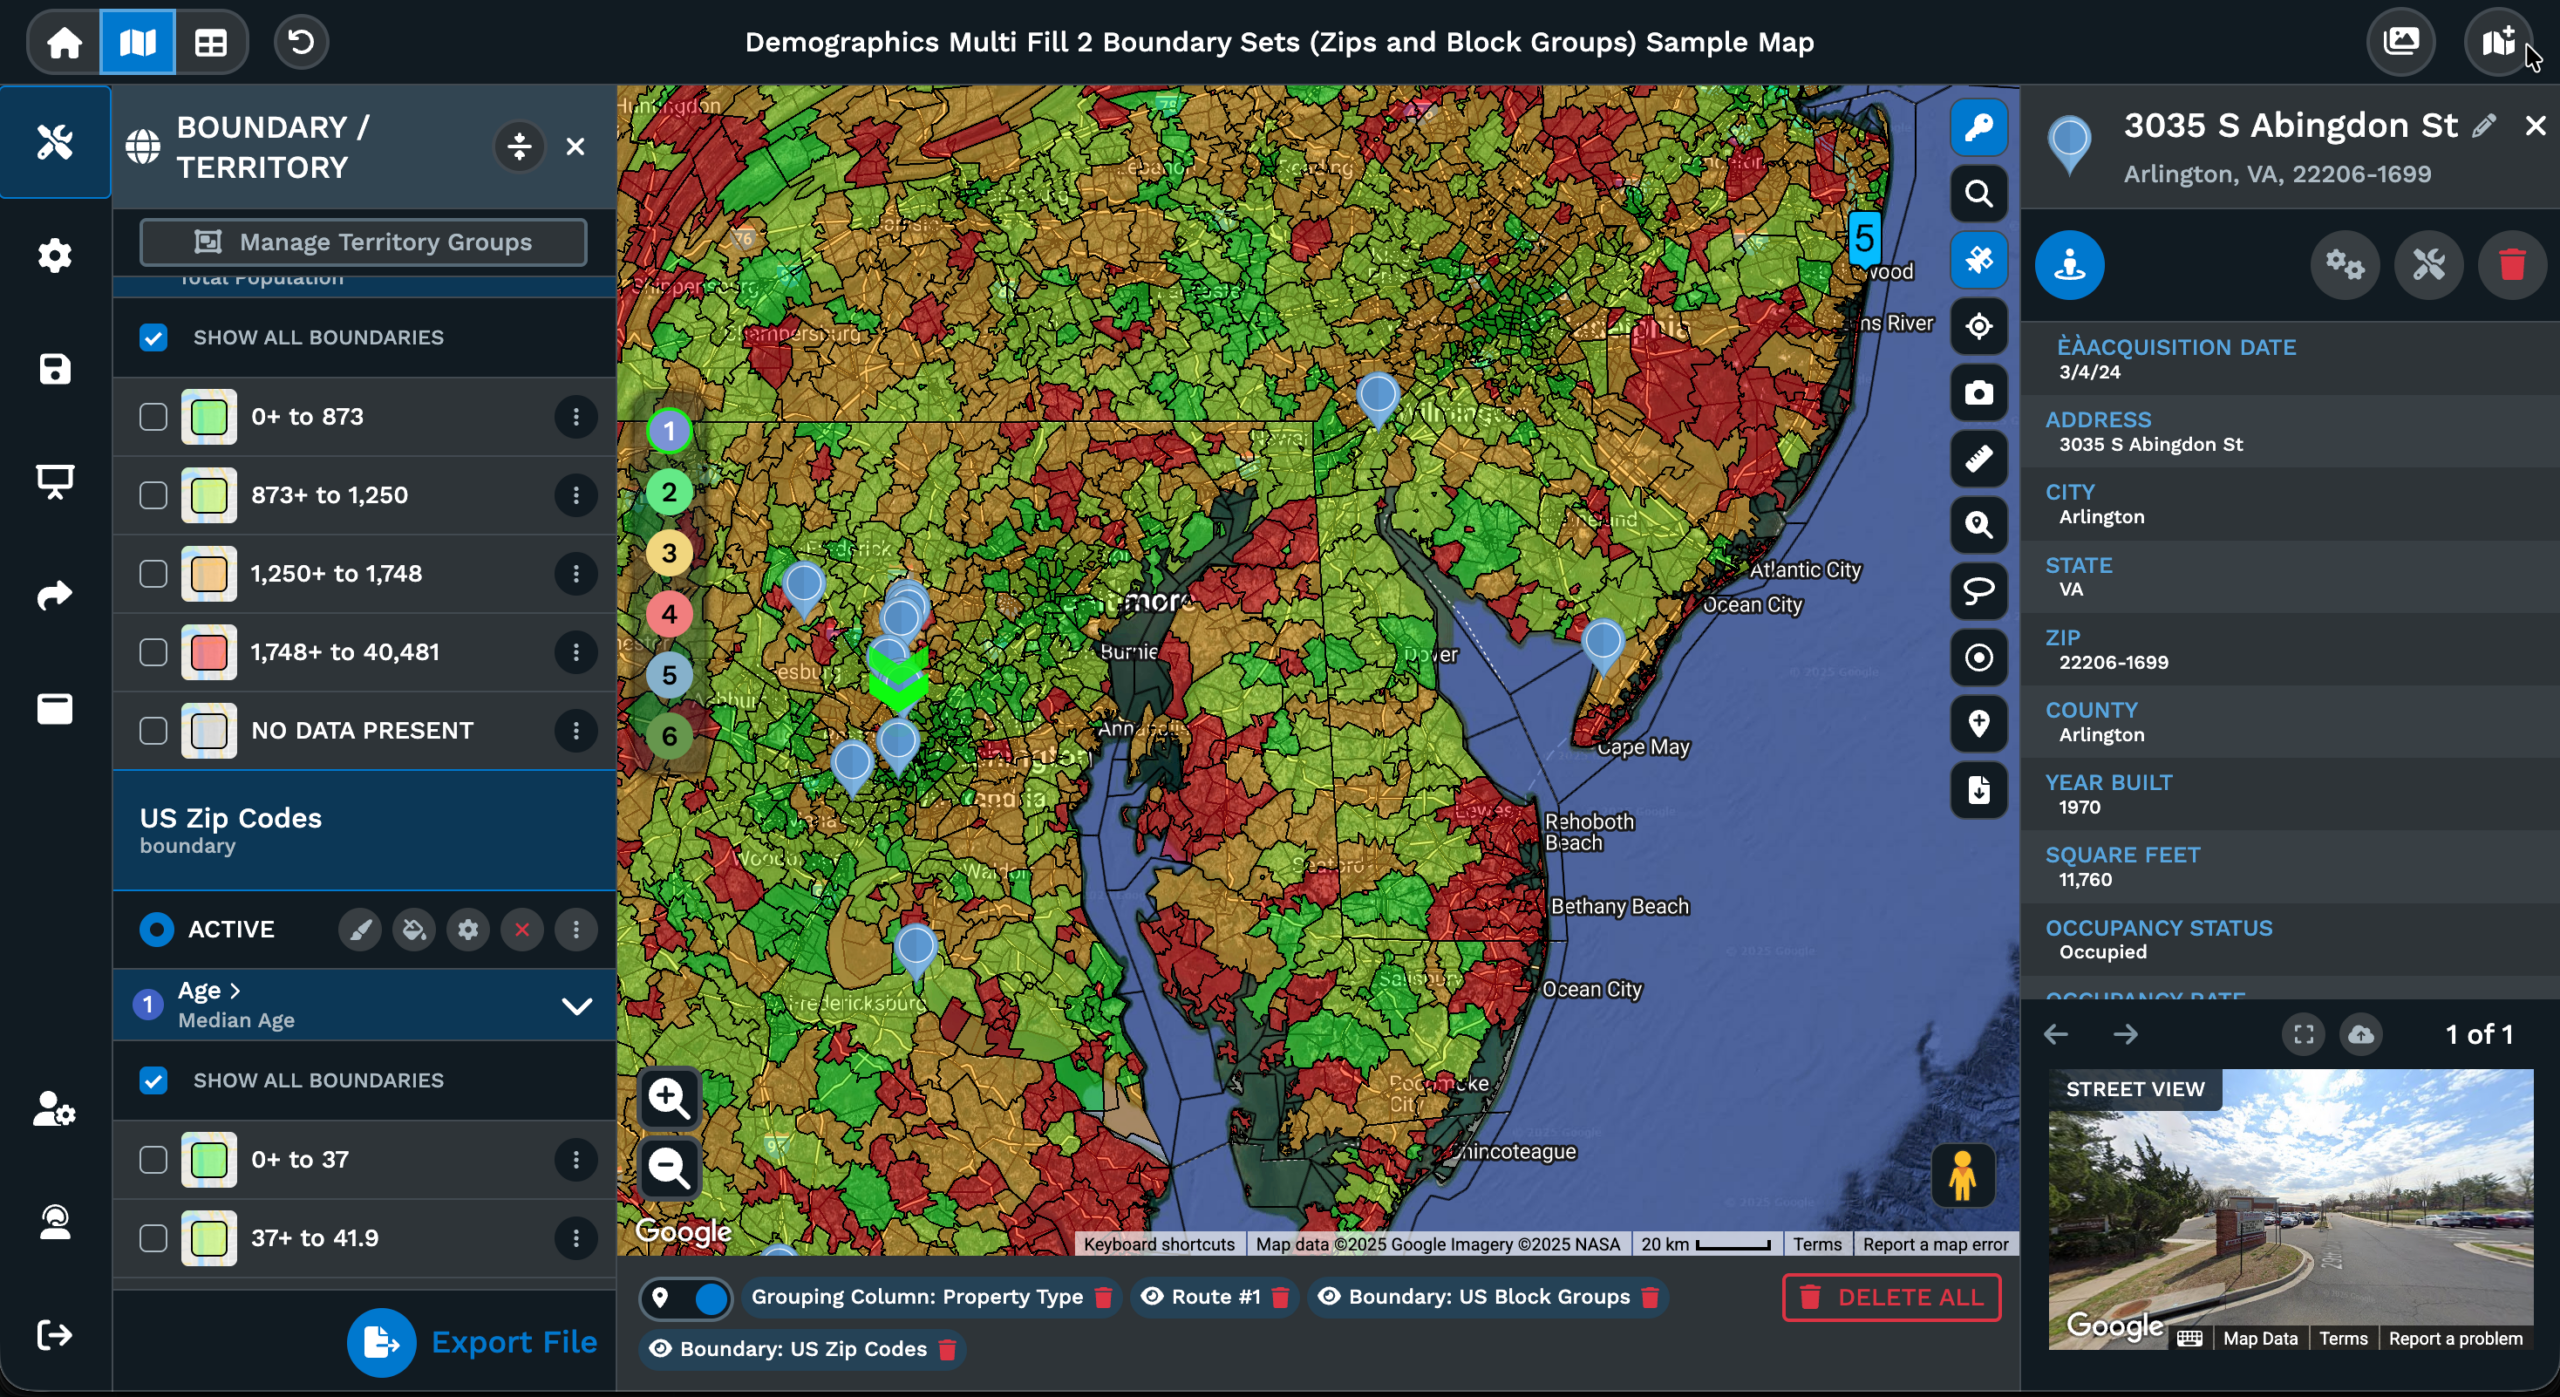
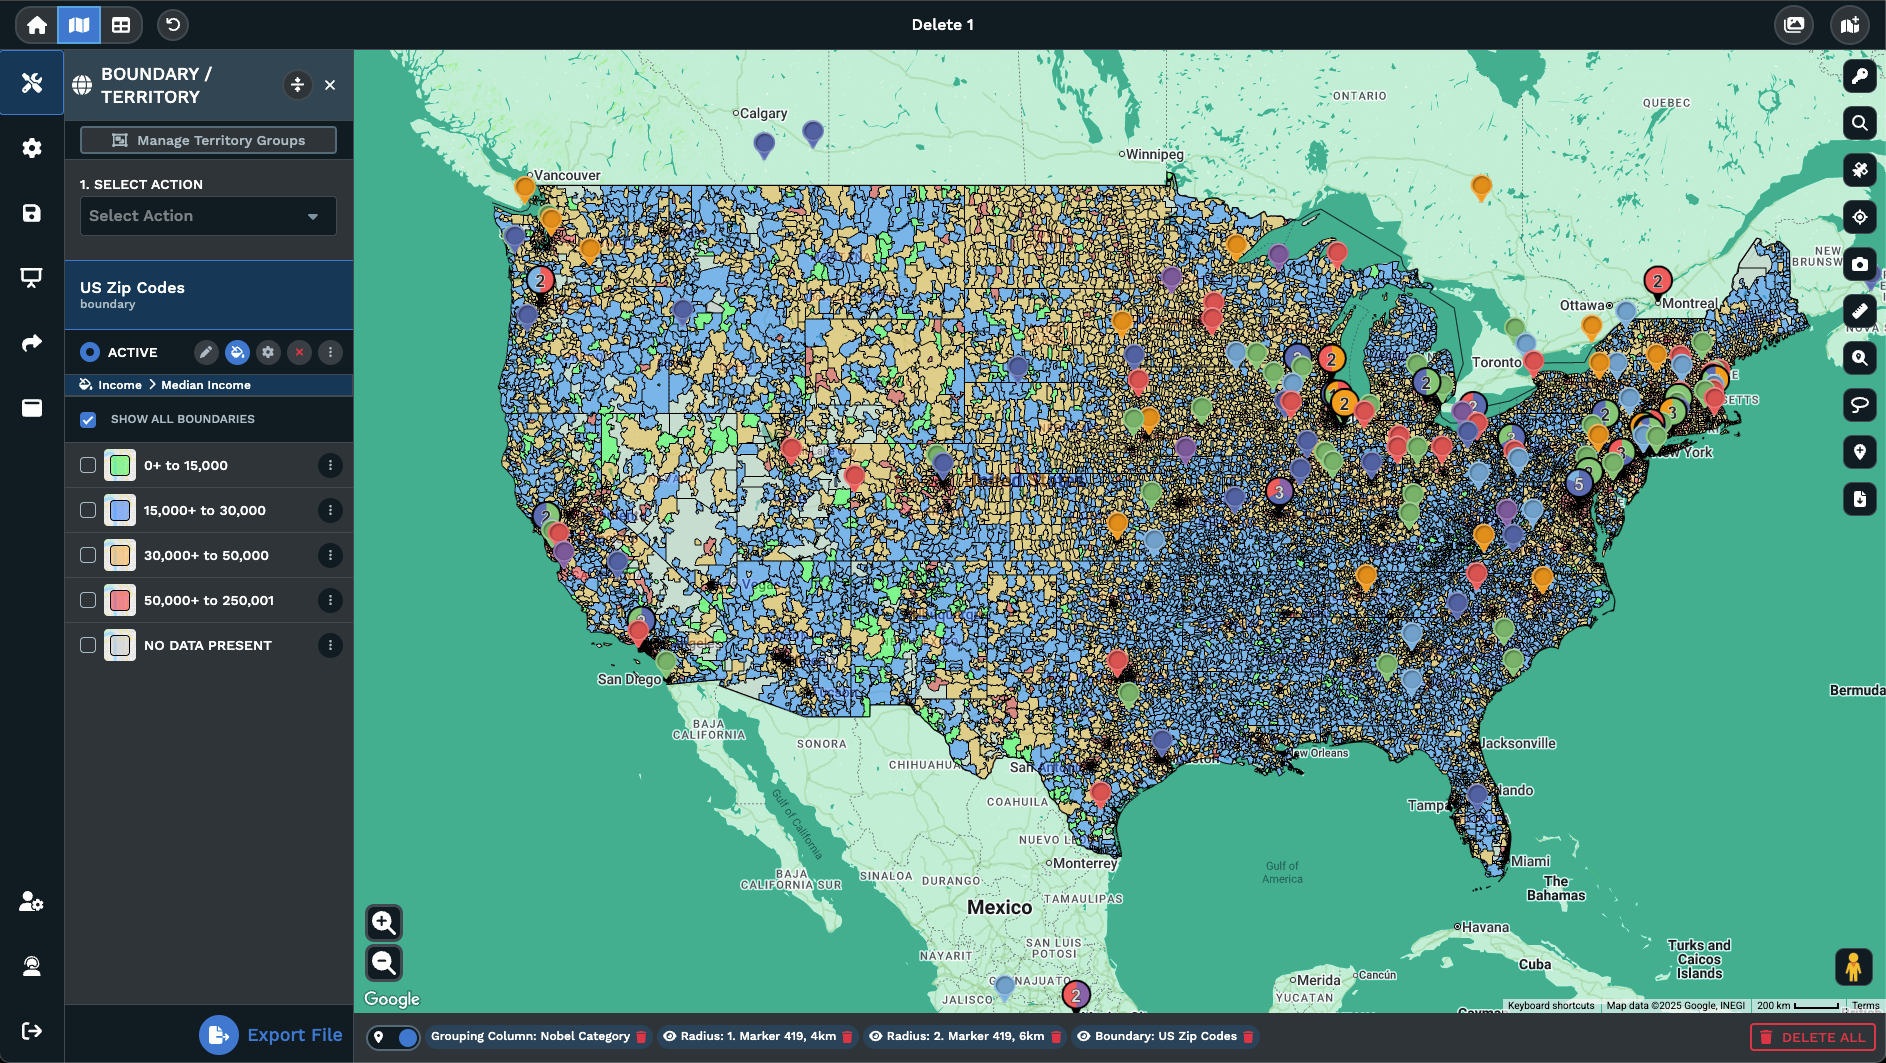
Yes. The Drive Time Polygon Tool supports a boundary export that returns a list of boundaries inside the polygon, including zip codes and counties. The export includes boundaries that fall fully inside the polygon and ones that fall at least partially inside. The Maptive docs link out to a separate help article for the boundary export workflow. The output is a postal-area list grounded in real road reach, ready for a coverage rule, a territory definition, or any tool that reads a postal area list.
How do I edit a polygon after I add it?
Open the 3 dot menu on the polygon and pick Edit Proximity. A popup opens with fields for the polygon name, color, opacity, and travel time. Type a new minute count to resize the polygon, change the color or opacity to ease the read against other layers, or rename the polygon to match your work. Click Save to apply the changes, or click the X to discard. The polygon updates the moment you Save, so the area, marker count, and aggregated totals all refresh on the map.
How do I customize the data shown for a polygon?
Click any polygon to open the right side panel. The panel lists the starting address, the count of locations inside the polygon, and aggregated data across markers inside. Pick Customize Metrics from the panel to choose which spreadsheet columns roll up across the markers within the polygon. Pick a sum, average, or count style aggregate per column. The aggregated totals match the variables your team works with, so the right side panel reads as a real report on the area you drew.
How do I delete a drive time polygon?
Open the 3 dot menu on the polygon and pick Delete Polygon. A confirmation popup opens to make sure you want to remove the area from your map. Confirm, and Maptive removes the polygon from the map and from the selected proximities list. To hide the polygon from view without deleting it, click the eye icon next to the entry on the selected proximities list or the Bottom Active Tools Bar. Click the eye icon a second time to bring the polygon back to view on the map.