

Demographics alone do not score a franchise territory. They score a customer profile against a territory, and most operators skip the customer-profile step. The result is a market scored on variables the actual buyer does not share.
The procedural inversion is the cause of most franchise scoring failures. Operators pull demographic data for a candidate market first, generate a long composite index second, and only afterward ask if the index reflects the brand’s existing buyer. The customer profile of the top-performing units has to come first, the variables that match that profile second, and the composite index third. Validate against held-out existing units before any candidate score is acted on.
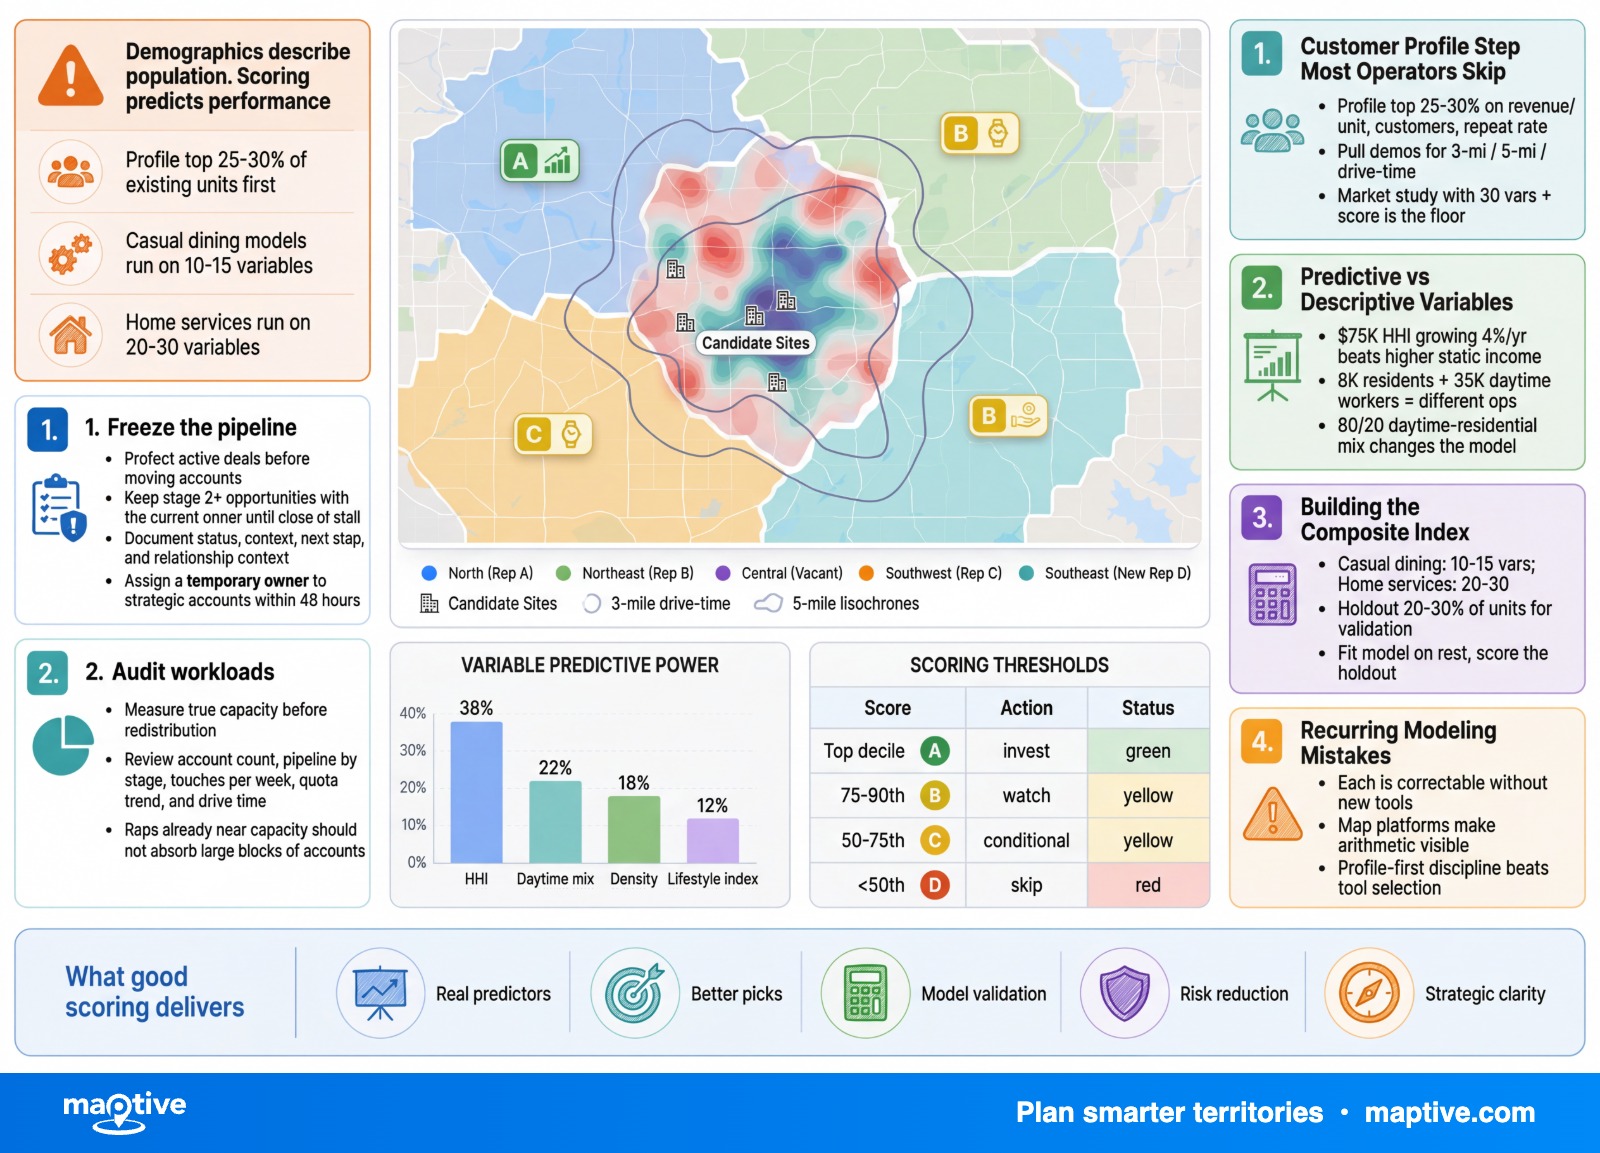
The Customer Profile Step Most Operators Skip
A territory score is a comparison. The candidate market is being compared against the franchisor’s actual customer base, represented through the demographics of trade areas around top-performing units. Without that baseline, the model defaults to generic notions of “good demographics” that may have nothing to do with the brand.
The honest pipeline runs in six steps. Profile the top-performing 25 to 30% of existing units on revenue per unit, customer count, and repeat rate. Pull demographic data for the trade areas around those units at a consistent geometry (3-mile radius, 5-mile radius, or drive-time isochrone). Identify the variables correlated with performance. Weight them. Apply the weights to candidate territories and rank.
The variables that distinguish a top performer from a bottom performer are the inputs the model needs. Everything else is decorative. A value-tier fitness brand whose strongest units sit in median-income suburbs would score affluent urban-core territories at the top of any model that weighted income alone. The buyer the brand actually reaches lives in a different ZIP code than the buyer the unfiltered data points toward.
The inversion is visible inside most franchise development files. The market study pulls 30 variables, builds a score, and arrives at the development meeting alongside a pre-selected candidate. The profile of the existing buyer enters late, as a sanity check rather than as the model’s spine. By that point the score has already done its work.
The greenfield case is the legitimate exception. A franchisor with three open units does not have a population of top performers large enough to build a profile against. The substitute is a hypothesis profile drawn from competitor visit data, brand archetype, and franchisee psychographic targeting. A score against a hypothesis profile is a candidate-ranking heuristic, not a forecast, and the first 10 open units become the calibration set that revises the hypothesis.
Variables That Predict Performance Versus Variables That Merely Describe Population
A franchise scoring model has room for roughly 8 to 15 variables before the weighting math becomes guesswork. Selecting those 8 to 15 is the modeling decision, and three families of variable carry most of the predictive load for consumer franchises. Composition describes the households in the trade area. Workforce describes who is present during business hours. Trajectory describes where the area is going. Raw population belongs in the denominator of most ratios, not in the score itself.
Composition is the family most operators reach for first and the family most likely to be used poorly. Median household income, age cohort distribution, household composition (married with children, single-person, retiree), educational attainment, owner-versus-renter share, and household size each carry a different signal. Two trade areas with identical total population can differ by a factor of three on under-5 households, the variable a childcare franchise lives on. The US has 18.5 million children under 5 and 62% of families are dual-income, but those averages are useless until they are resolved to the ZCTA or block group where the candidate site sits. A childcare model that scores on total population is scoring the wrong thing.
Workforce variables come from the Census Bureau’s LEHD LODES program. Workplace Area Characteristics files publish daytime population, jobs by NAICS sector, and wage tier at the census-block level. A trade area with 8,000 residents and 35,000 daytime workers is a different opportunity from the reverse, even at the same total. Lunch QSR, coffee, sandwich, dry cleaning, banking, and urgent care all lean daytime. Dinner restaurants, fitness, childcare, salons, home services, and automotive lean residential. Hybrid concepts need both, and the ratio matters. A site with an 80% daytime to 20% residential mix is operationally different from a 50/50 site even when total trade-area population is identical.
Trajectory is the family franchisors most often omit, and the omission is expensive. A territory at $75,000 median household income growing 4% per year beats a territory at $85,000 shrinking 1% per year on any 7-year franchise horizon. Millennials, now roughly 74 million Americans, became majority-homeowners in 2024 and now account for the majority of parents with children under 18. Roughly 4 million Americans turn 65 each year through 2030. A scoring model that uses only current-year demographics is scoring against a snapshot that will not describe the trade area for most of the franchise term.
Behavioral and lifestyle segmentation systems function as overlays on demographics rather than substitutes. PRIZM Premier and Mosaic USA each classify US neighborhoods into 60 to 71 household types, organized into a smaller number of LifeMode or social groups, and publish counts at block-group resolution. The practical use for franchise scoring is to identify the top segments that index high among the brand’s existing CRM file, then count households in those segments within the trade area of each candidate site. The output is a segment-match score that travels alongside the demographic composite, not a replacement for it.
The plumbing matters. American Community Survey 5-year estimates publish at block group, the working unit for tight drive-time isochrones. ACS 1-year estimates publish only for areas with 65,000 or more population and are the right input for state-level or large-metro tracking, not small-area trade-area work. ZCTAs do not match USPS ZIP codes exactly, a gotcha that produces silent errors when an analyst joins ACS data to a ZIP-based site list.
Building the Composite Index
A composite index is the way variables on different units and different scales get combined into a single rank. The mechanics have been documented for decades. The OECD’s handbook on composite indicators is the standard reference, and the methodological choices that decide model quality are normalization method, weighting source, and validation procedure. Equal weighting is the most common choice and the most defensible-sounding wrong answer.
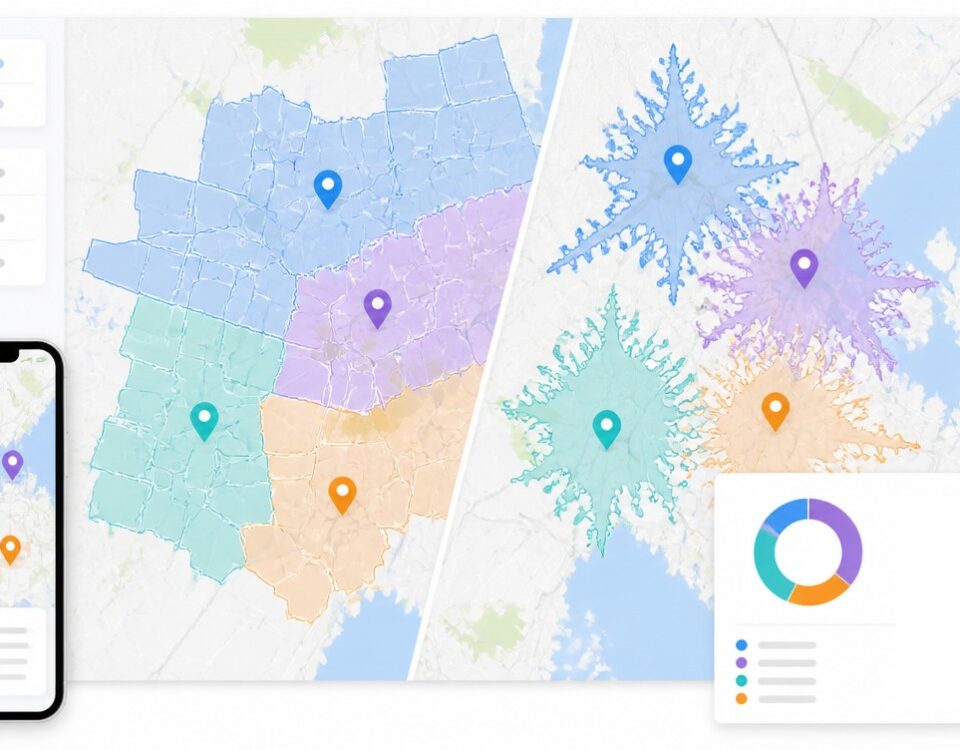
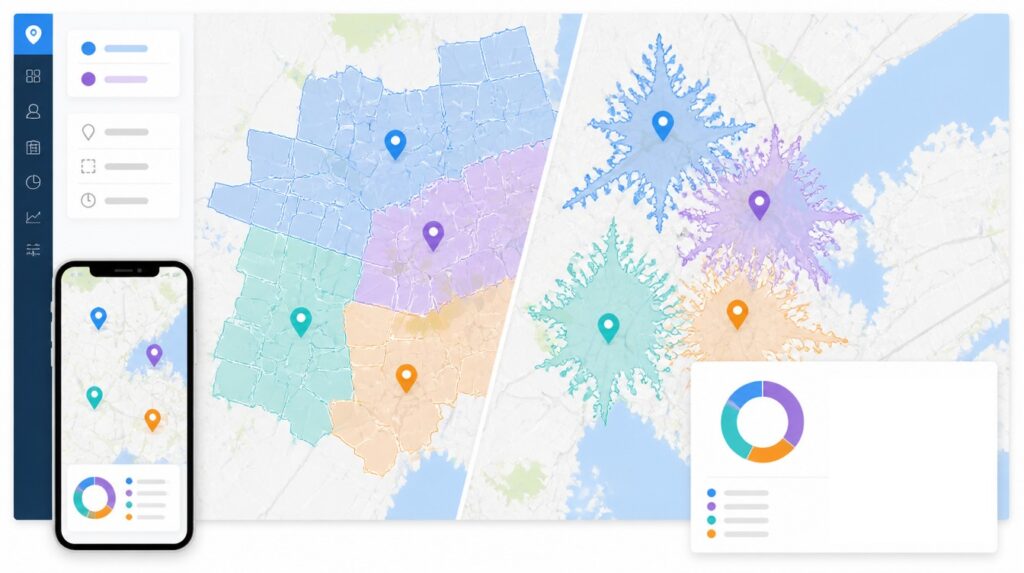
The first decision is the trade area geometry. A 3-mile radius captures roughly the same area as a 6-minute drive in a suburban grid and roughly the same area as a 40-minute drive in dense urban traffic. The geometry decides what data can be pulled, what comparison is meaningful, and how closely the score reflects the way a customer actually reaches the unit. A QSR scoring model should run on a 5 to 7 minute isochrone. A casual dining model runs on 10 to 15. Home services run on 20 to 30 because the truck does the driving. The radius shortcut survives because it is computationally cheap, not because it produces a defensible trade area.
Each variable is then normalized. A z-score against a benchmark works when the benchmark is stable. A 0-to-100 rescaling against the system’s existing units works when the existing-unit set is large enough to span the range. The choice of benchmark matters more than the choice of normalization method, because the benchmark is what the candidate is being scored against. A national-population benchmark produces one ranking, and a system-top-quartile benchmark produces another.
Weights come from a regression of demographic variables against an outcome that matters at existing units. AUV, customer count, and repeat rate are the standard outcomes. The regression coefficients become the weights, normalized so they sum to 1. A franchisor with 25 open units has enough degrees of freedom to fit a defensible regression on five to eight variables. A franchisor with 100 open units can fit more. The model fails when the variable count exceeds what the unit count supports, which is the structural reason equal weighting persists.
Validation is the step most often dropped. Hold out 20 to 30% of existing units, fit the model on the rest, and score the held-out units. The top-quartile held-out units should land in the top quartile of the model’s output. If they do not, the model is wrong and no candidate score it produces is reliable. Validation is the cheapest part of the pipeline and the discipline that distinguishes a defensible score from a confident assertion.
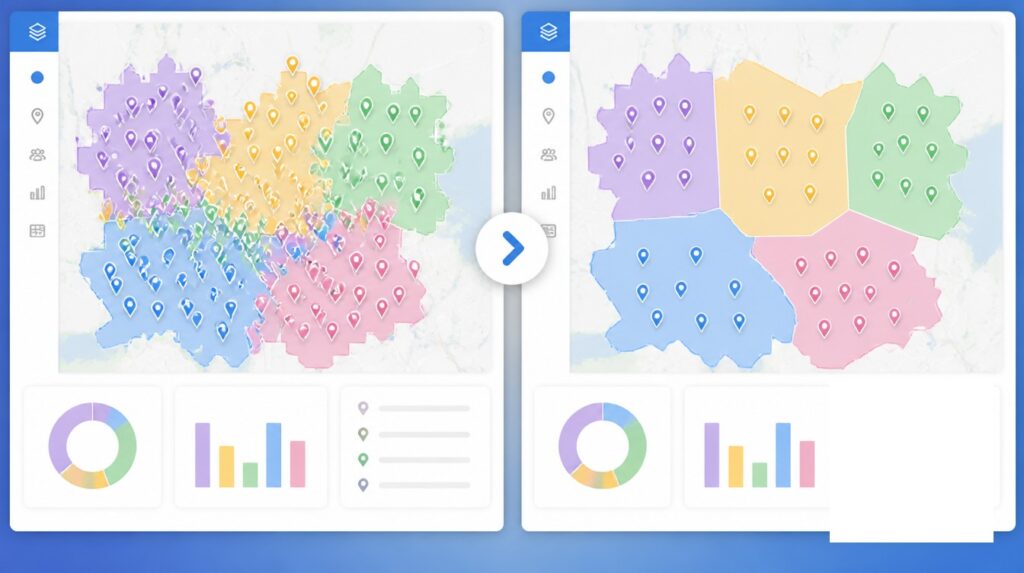
Thresholds make the score actionable. The approve band sits at the score that captures the top quartile of existing units. The investigate band sits at the median. Anything below the bottom quartile gets rejected. A separate use case, balancing territories for fairness across a system rather than ranking candidates, runs on different math entirely and converges on a ±10% tolerance around target population and income per territory.
Recurring Modeling Mistakes
Most franchise scoring failures repeat the same handful of methodological errors. Each is correctable without new tooling. They persist because they are easier to ship than the alternative, not because they are defensible.
Equal Weighting
Averaging 10 variables with no weighting assumes each variable matters equally to unit performance, which is almost never true. The OECD composite-indicator handbook has been saying this since 2008 and the practice continues. The fix is regression weights from existing-unit performance. The regression does not need to be sophisticated. A simple ordinary least-squares fit of AUV against five composition variables produces weights that beat equal weighting in nearly every validation test, and the math runs in a spreadsheet.
Confusing Residential and Daytime Population
A lunch QSR lives on LEHD LODES Workplace Area Characteristics. A dinner restaurant lives on ACS household composition. A hybrid concept lives on both, and the ratio between them decides which input weighs more. Drive-through transactions accounted for roughly 45% of QSR service operations globally in 2024, and that revenue is daytime-weighted on the lunch side and residential on the dinner side. A scoring model pulling only ACS residential population for a hybrid concept is reading half the day.
Scoring Snapshots Without Trajectory
A territory at $75,000 median household income growing 4% per year beats a territory at $85,000 shrinking 1% per year on a 7-year horizon. Current-year demographics are a photograph. The 5-year forecasts published alongside PRIZM Premier and Mosaic USA datasets are the trend line. A franchise term covers 10 to 20 years. A model that scores the photo and ignores the trend line is timing its decision against the wrong window.
Skipping Validation Against Existing Units
A model that has never been tested against known good and known bad units is an assertion, not a model. The validation step is procedurally identical to the train-test split used in any predictive modeling. The methodological label is analog modeling, and SiteSeer’s Retail Match approach makes the comparison explicit. A franchise system with 25 or more open units has no excuse for omitting validation, and the development file should include the validation report alongside the candidate scores.
Drive-Time Math Replaced by ZIP Math
A 3-mile radius can be 6 minutes in a suburb or 40 minutes in a dense urban grid. A ZIP-bundle trade area is administratively convenient and behaviorally meaningless. The scoring math should run on a drive-time isochrone that matches the vertical’s primary trade area. The legal contract artifact, including the FDD Item 12 exhibit, can still list ZIPs. The scoring math should not be downgraded to match the contract format.
The discipline these five corrections describe is procedural, not technical. A franchisor that starts with the existing-unit baseline, weights variables against measured performance, validates against held-out units, and runs the geometry on drive time will not produce the 25-page market study that ranks the wrong markets at the top. The score is only as good as the customer profile it is scoring against, and the customer profile is the step most operators skip. Mapping platforms make the arithmetic visible. The profile-first discipline is a decision rule, not a tool selection.
Frequently Asked Questions
What demographics matter most for franchise territory selection?
Age, income, and household composition are the variables that predict franchise success more reliably than any others. Population density, educational attainment, employment by industry, and daytime population matter heavily for specific verticals. The right weight on each variable depends on the brand’s customer profile. A childcare franchise lives on under-5 household density. A fitness franchise lives on 25-to-54 cohort share and median income. The variables are universal; the weights are brand-specific.
How do you score a franchise market?
Build a composite index. Pull demographic variables for the trade area, normalize each variable on a 0-to-100 scale or as a z-score against a benchmark, apply weights derived from how well each variable predicts performance at existing units, sum the weighted values, and rank candidate territories. Validate the model by holding out 20 to 30% of existing units and checking that the held-out top performers score in the top quartile.
What population size do most franchise territories need?
Most franchisors assign exclusive territories between 50,000 and 300,000 households, averaging around 160,000. Service franchises generally need at least 25,000 people within 10 miles. Retail franchises usually need 50,000 or more within the trade area for unit-level profitability.
What is the difference between demographic and psychographic data?
Demographics describe who a customer is, including age, income, education, household composition, and location. Psychographics describe why they buy, including values, lifestyle, interests, opinions, and personality. Demographics are census-grounded and stable. Psychographics are modeled and inferred. For franchise scoring, demographics form the foundation and psychographics refine the match.
What is the difference between psychographic and behavioral data?
Psychographic data captures attitudes, beliefs, and lifestyles. Behavioral data captures actual actions including visits, purchases, dwell time, mobile location signals, and online searches. Psychographic data is usually modeled. Behavioral data is measured. The strongest segmentation stacks combine all three.
What is the difference between ACS 1-year and 5-year estimates?
ACS 1-year estimates use 12 months of data and are published only for areas with 65,000 or more population. ACS 5-year estimates pool 60 months of data and are published for every geography down to census block group and ZCTA. Use 5-year estimates for franchise trade-area work. Use 1-year estimates for state-level or large-metro tracking when freshness matters more than granularity.
What is daytime population and why does it matter for site selection?
Daytime population is the number of people present in a trade area during business hours, including workers who commute in, shoppers, and visitors. It is published through Census LEHD LODES Workplace Area Characteristics files. Lunch QSRs, coffee, banking, dry cleaning, and urgent care depend on daytime workforce density rather than residential household count. A trade area with 8,000 residents and 35,000 daytime workers is a different opportunity from the reverse at the same total.
What is LEHD LODES data?
Longitudinal Employer-Household Dynamics Origin-Destination Employment Statistics, published by the US Census Bureau. LODES files come in three types at census-block resolution: Origin-Destination, Residence Area Characteristics, and Workplace Area Characteristics. Version 8 was enumerated on 2020 census blocks. LODES is the standard source for daytime population, workforce by industry, and commuting flow analysis.
What demographics matter for a childcare franchise?
Density of households with children under 5, share of dual-income households, median household income, supply of existing childcare in the trade area, and population growth. The US has 18.5 million children under 5 and 62% of families are dual-income, but these averages vary heavily by ZIP code, which is why density and dual-income share matter more than total population.
What demographics matter for an urgent care franchise?
The classic urgent care patient is a working adult aged 25 to 54, married with school-age children, suburban homeowner with private insurance. Scoring prioritizes 25-to-54 cohort share, married-with-children household share, owner-occupied housing percentage, household income above the area median, and traffic patterns. Utilization decreases as age increases.
What is analog modeling in franchise site selection?
Analog modeling compares a candidate site to existing stores, particularly top performers, to estimate likely performance. The model builds a profile of what top units share including demographics, traffic, psychographic segments, and competitive density, then scores candidate sites by how closely they match that profile. Markets that resemble top-quartile existing units are prioritized in the pipeline.


