Commercial Real Estate Mapping Software
Maptive maps your properties, your tenants, and the demographics around every parcel. Evaluate a site, build a pitch with market data, and show clients the trade area behind a deal.
No credit card required
- Map properties, comps & listings
- Demographics around any address
- Drive-time & radius trade areas
- Branded maps for pitch decks
- Layer traffic & market data
- Share live maps with clients
- Map properties, comps & listings
- Demographics around any address
- Drive-time & radius trade areas
- Branded maps for pitch decks
- Layer traffic & market data
- Share live maps with clients
Trusted by teams at


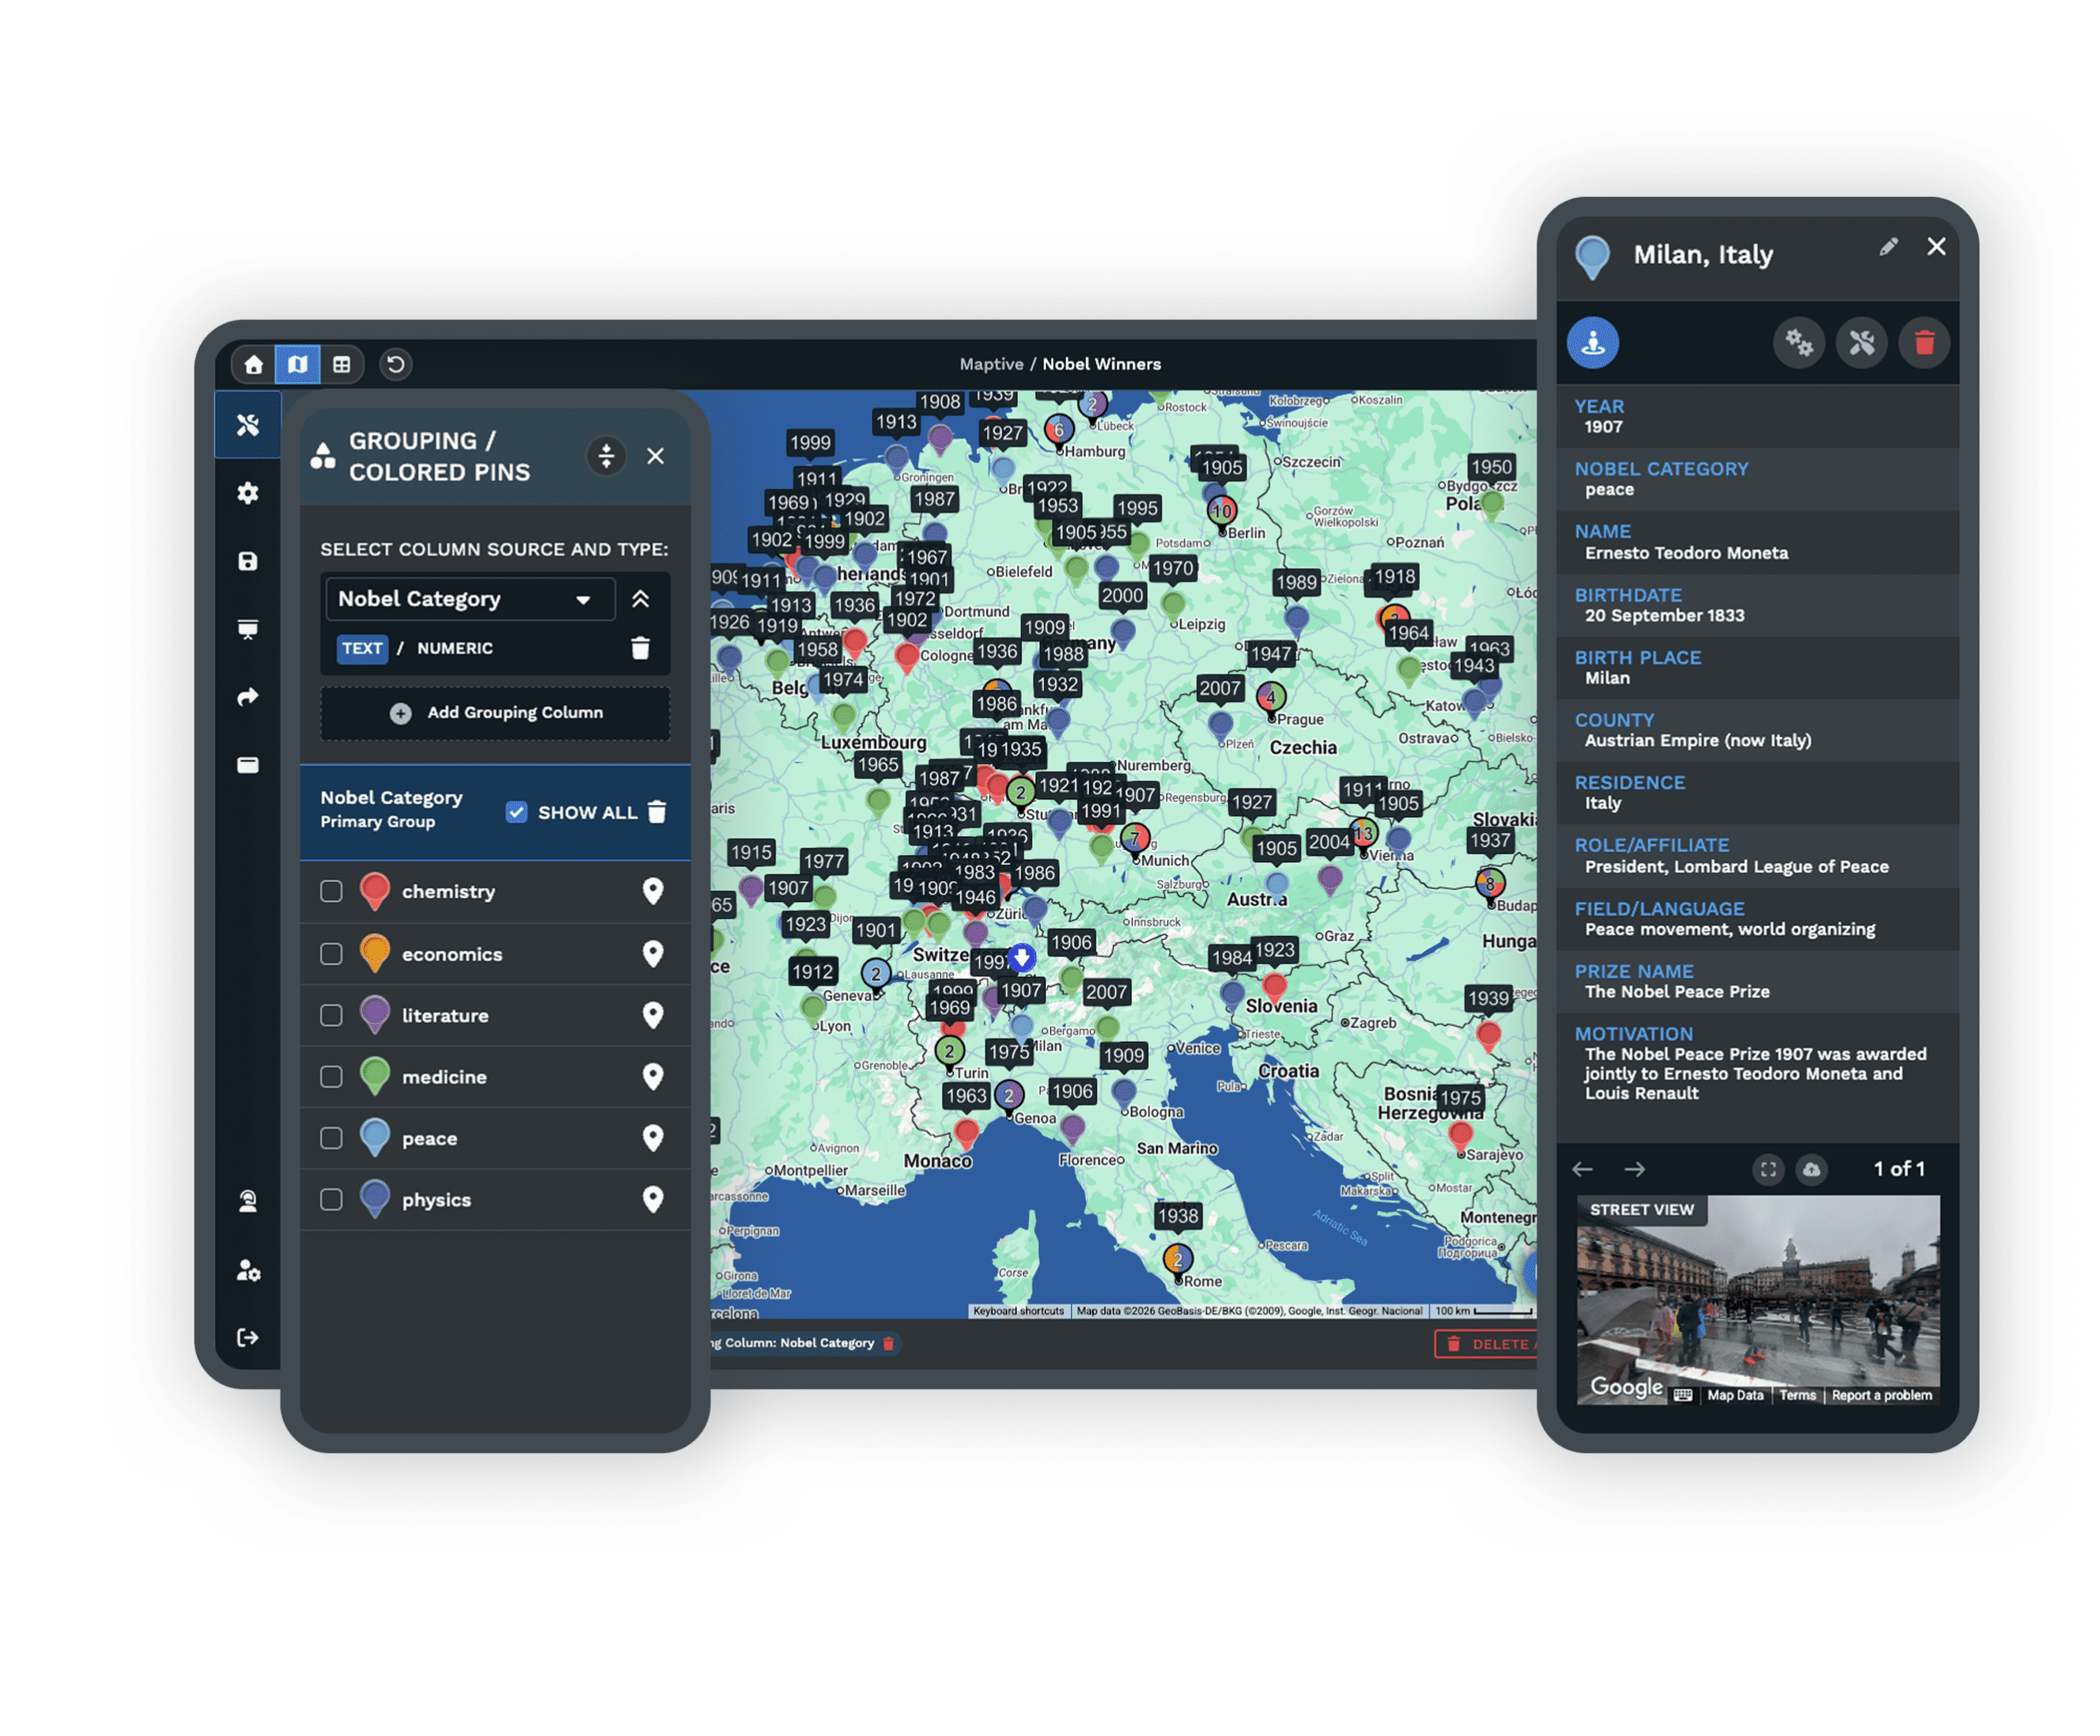
A Deal Team's View on One Map
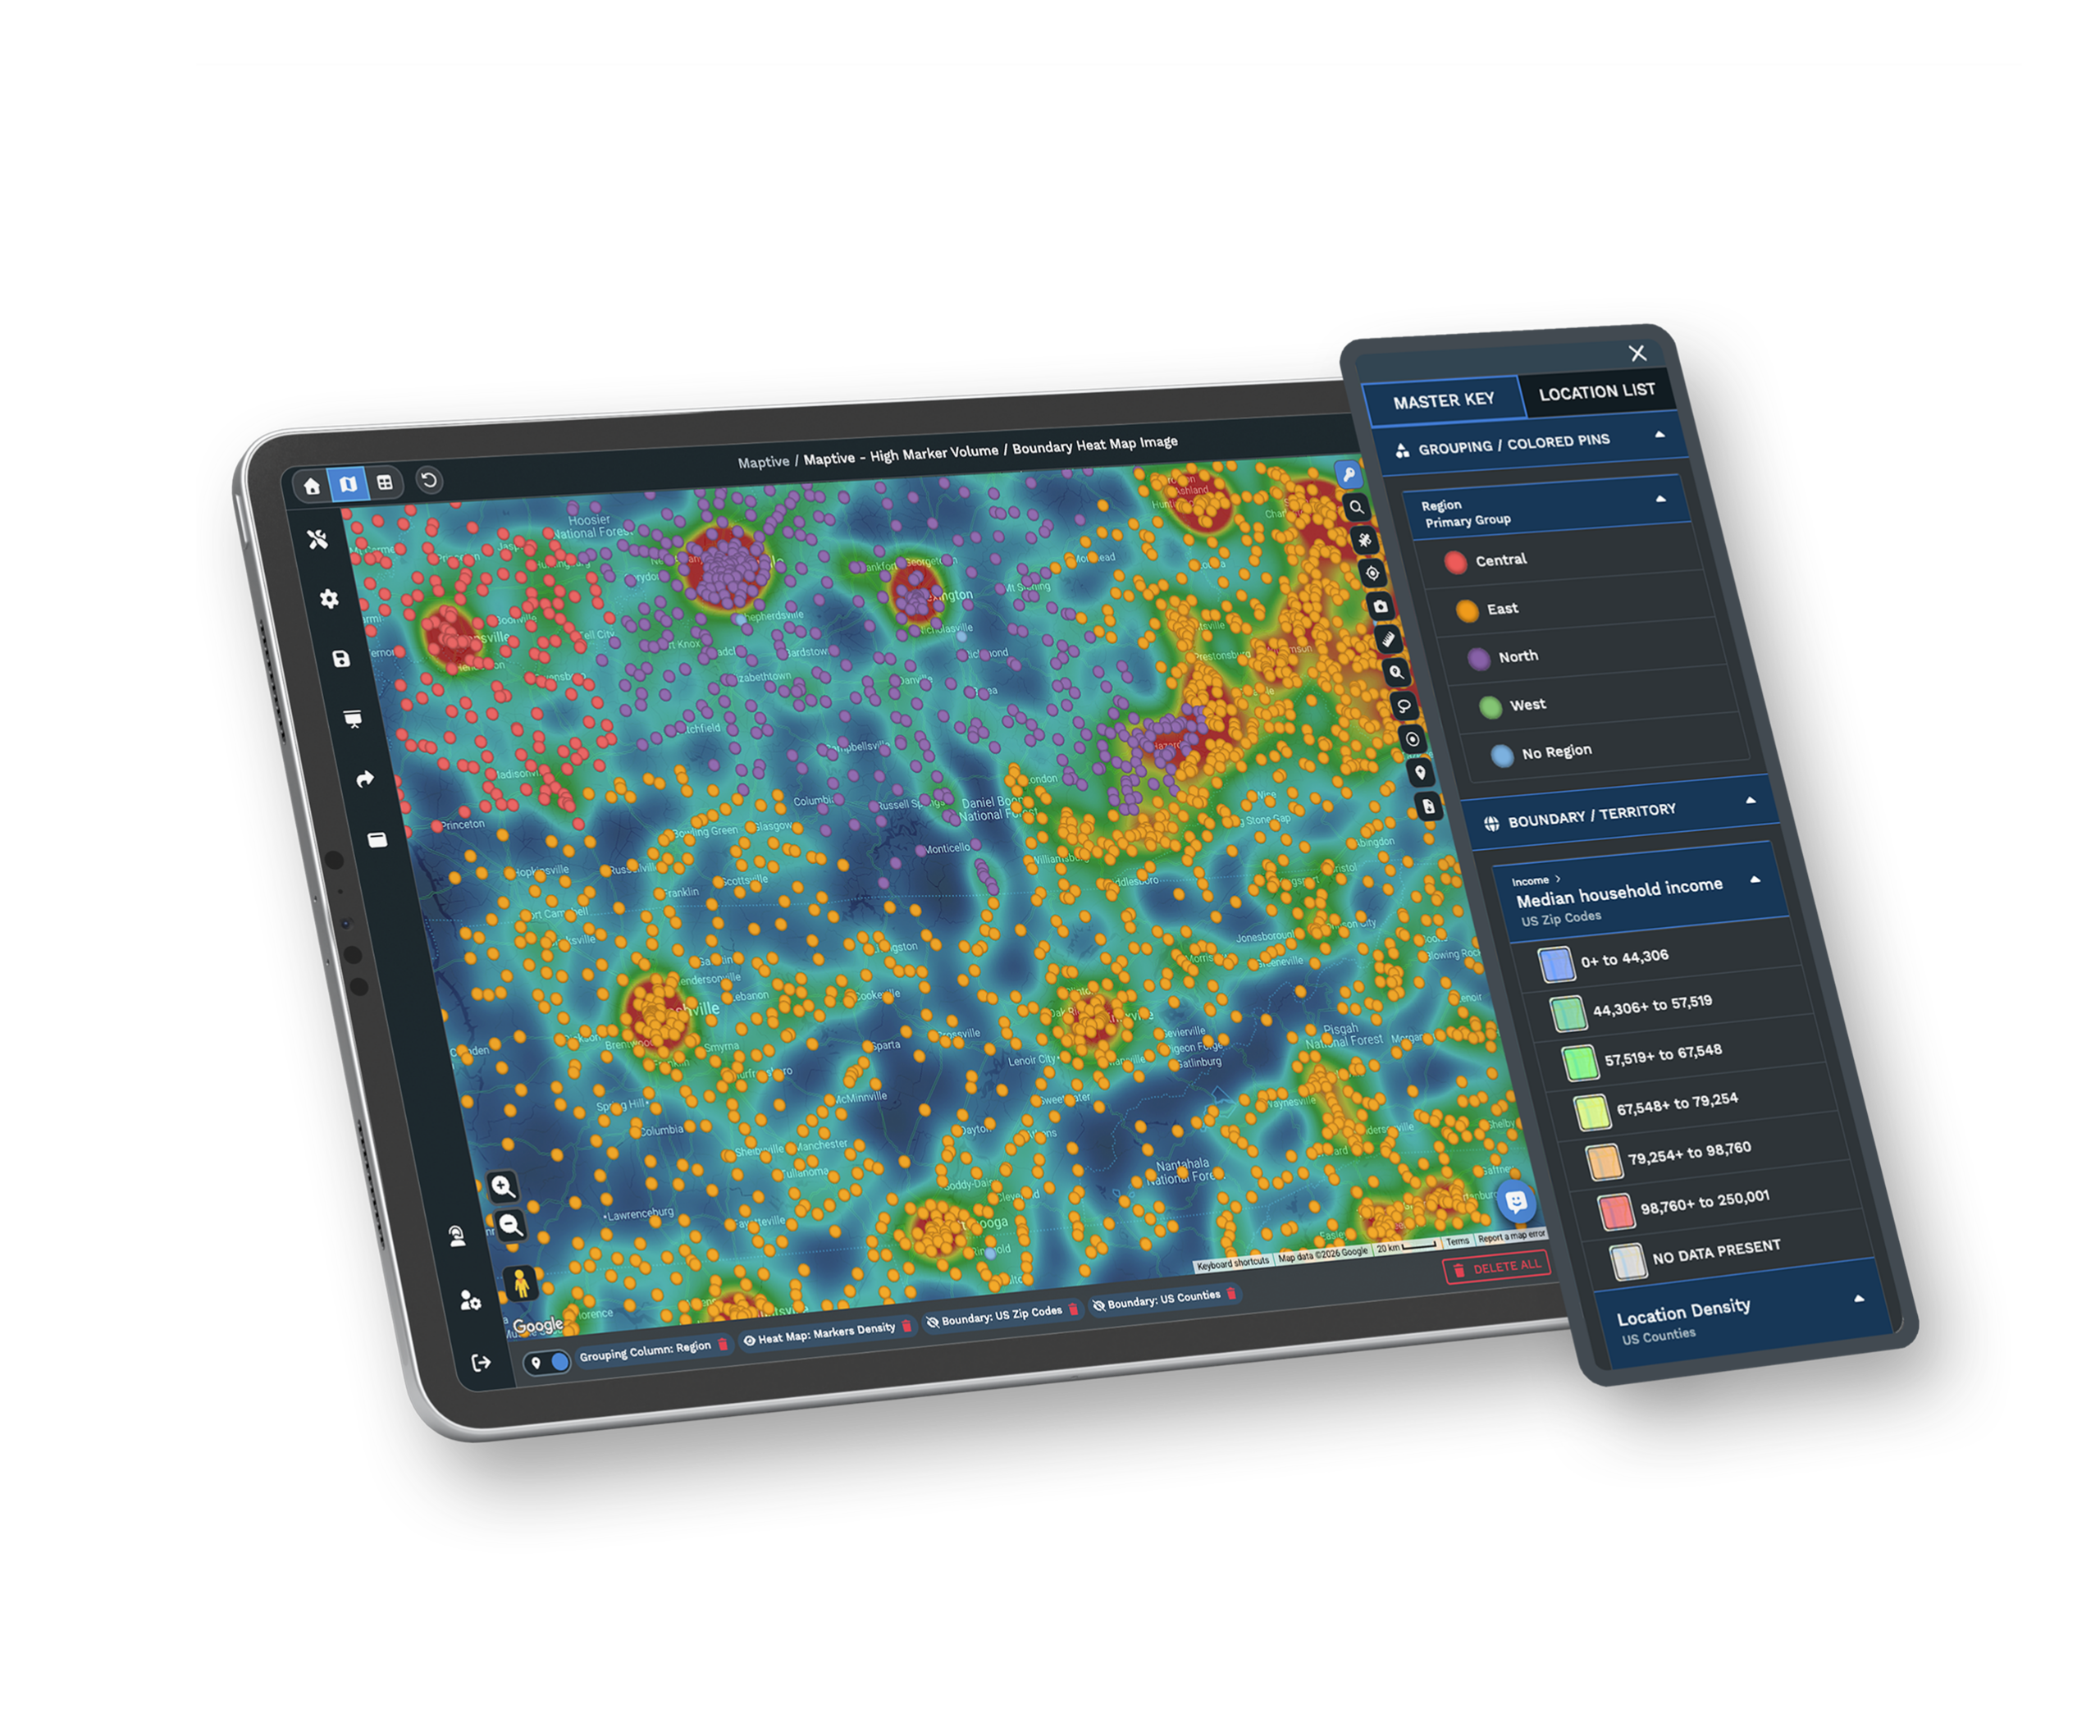
WebGL rendering holds an entire portfolio on one screen, color-coded by asset class, occupancy, or value.
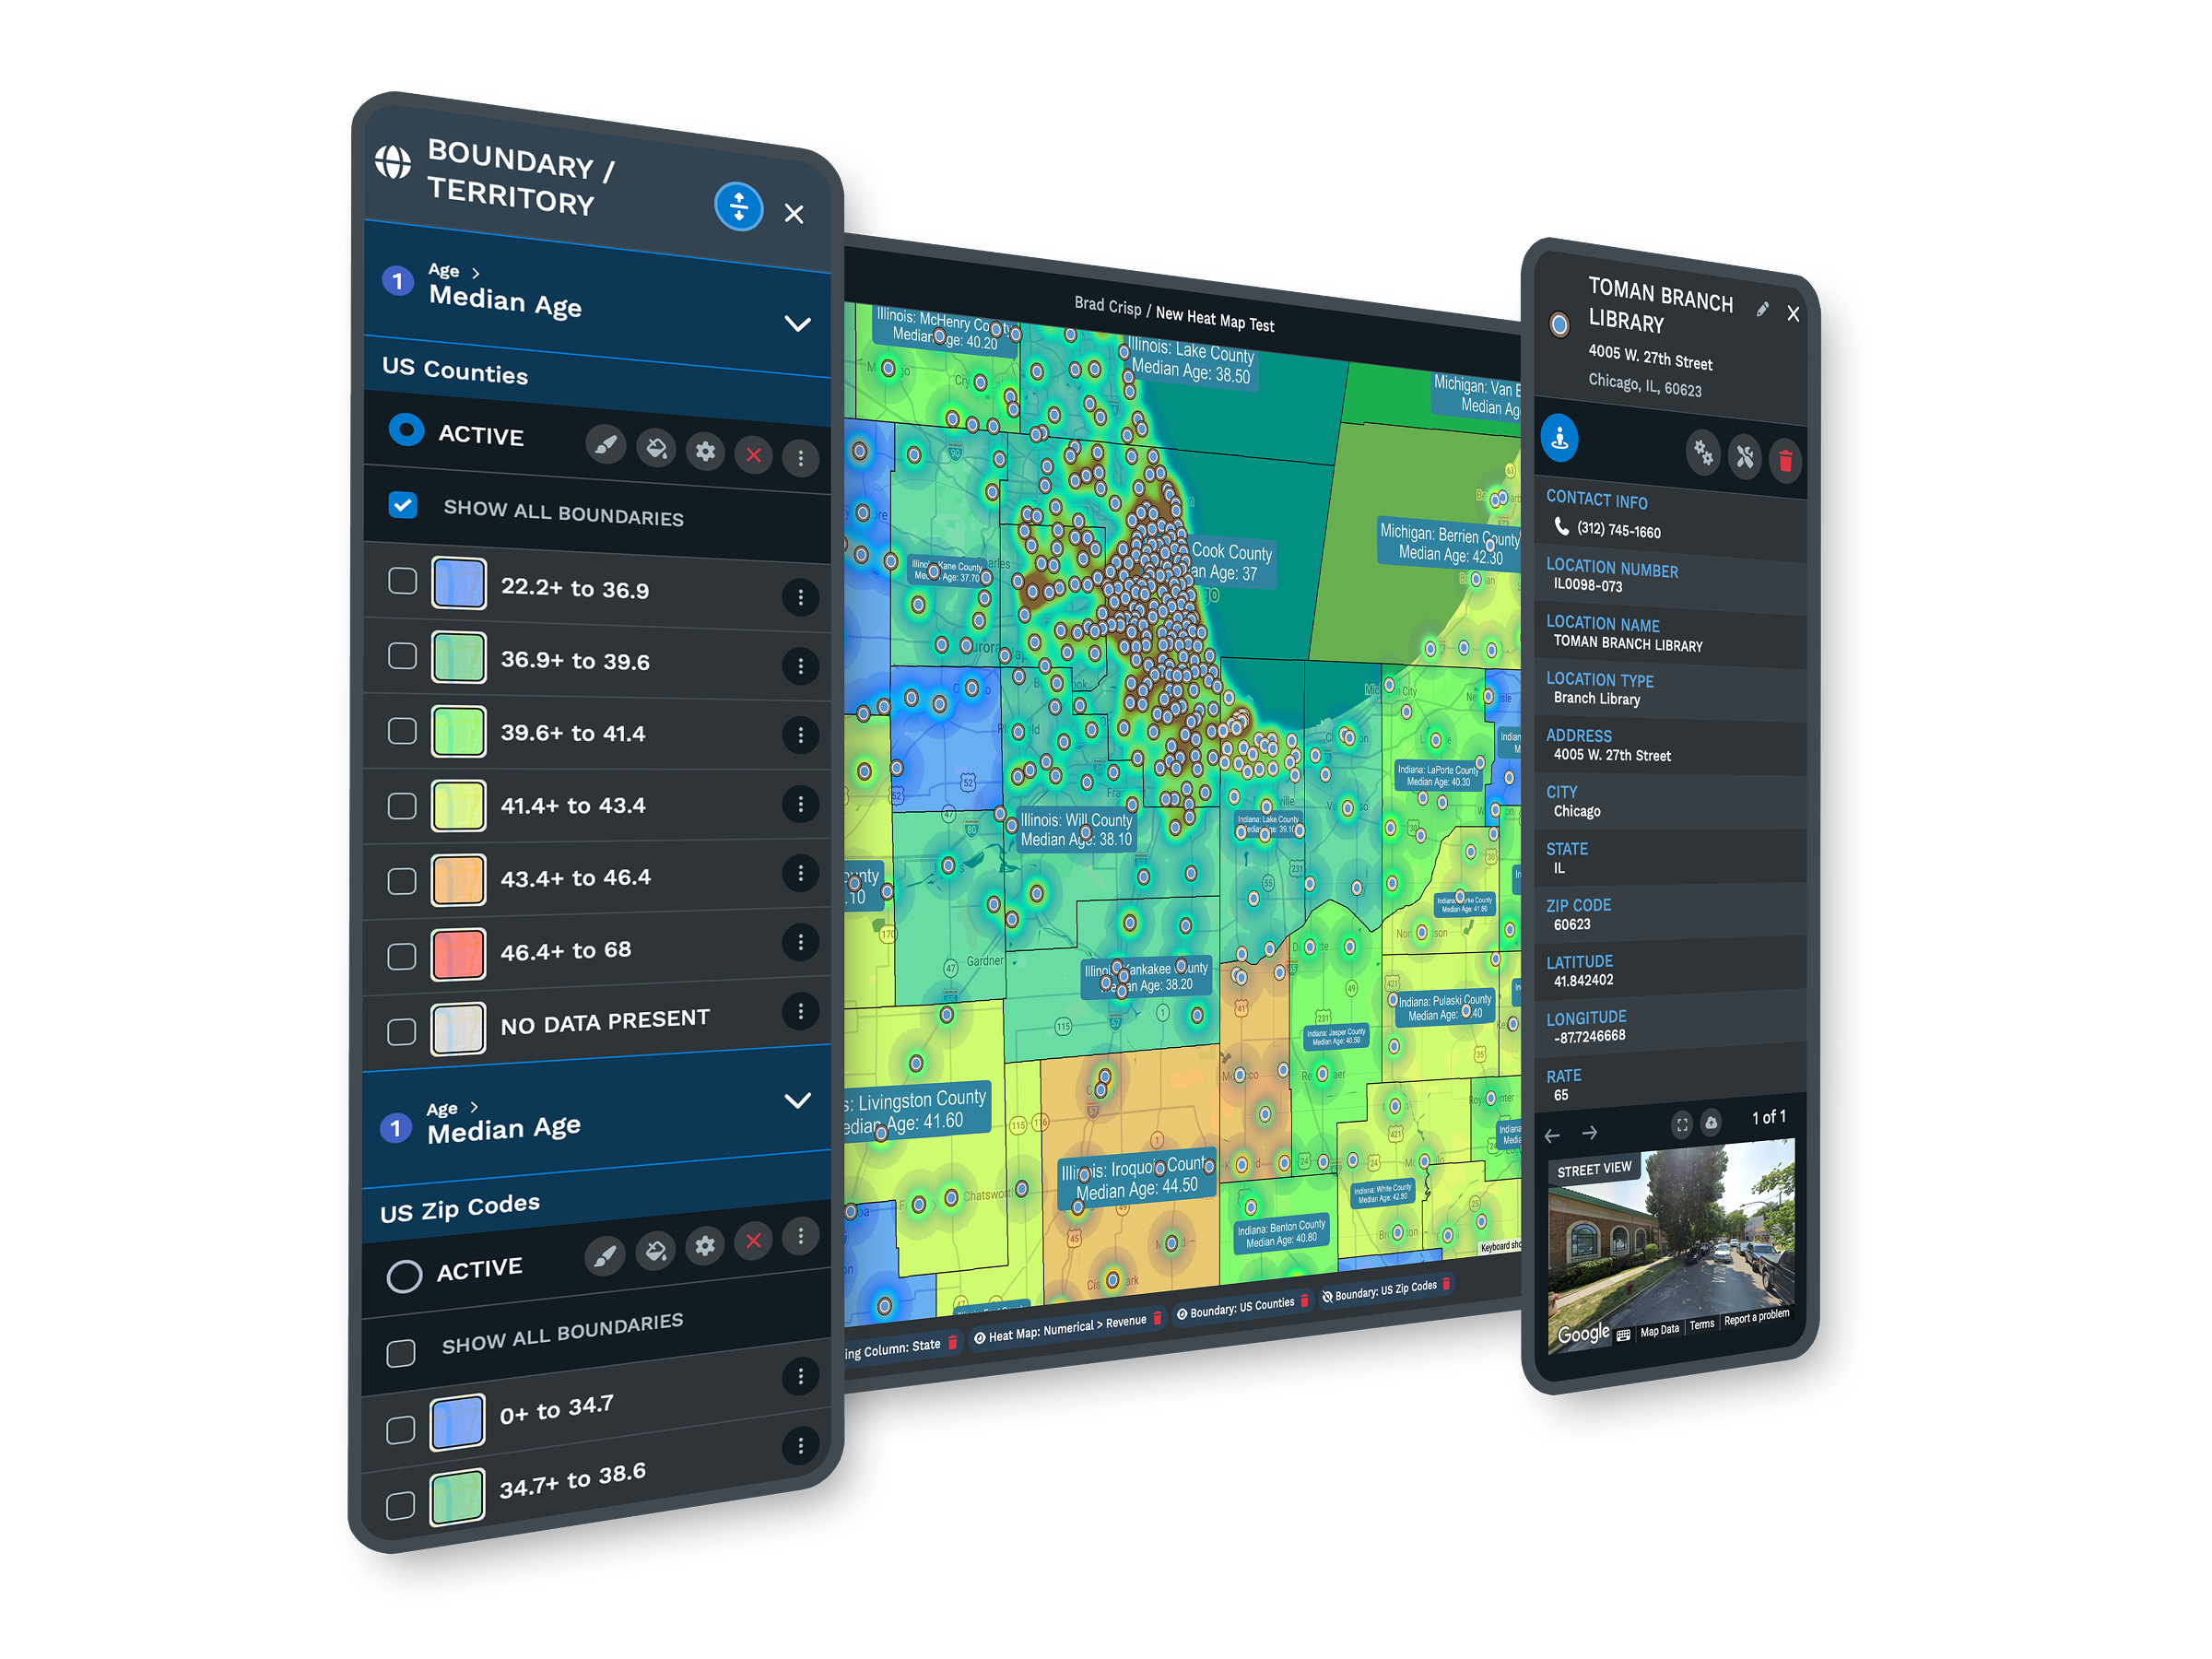
Income, density, age, and household detail at five geographic levels measure the demand around every parcel.
A US and Canada team answers in under 15 minutes and helps configure your first map.
The Deal Analyst's Toolkit
| 01 | Parcel Trade-Area AnalysisDrop an address and draw a drive-time polygon around it on real road networks. Layer demographic and market data inside the boundary to judge the parcel on the demand it can reach. |
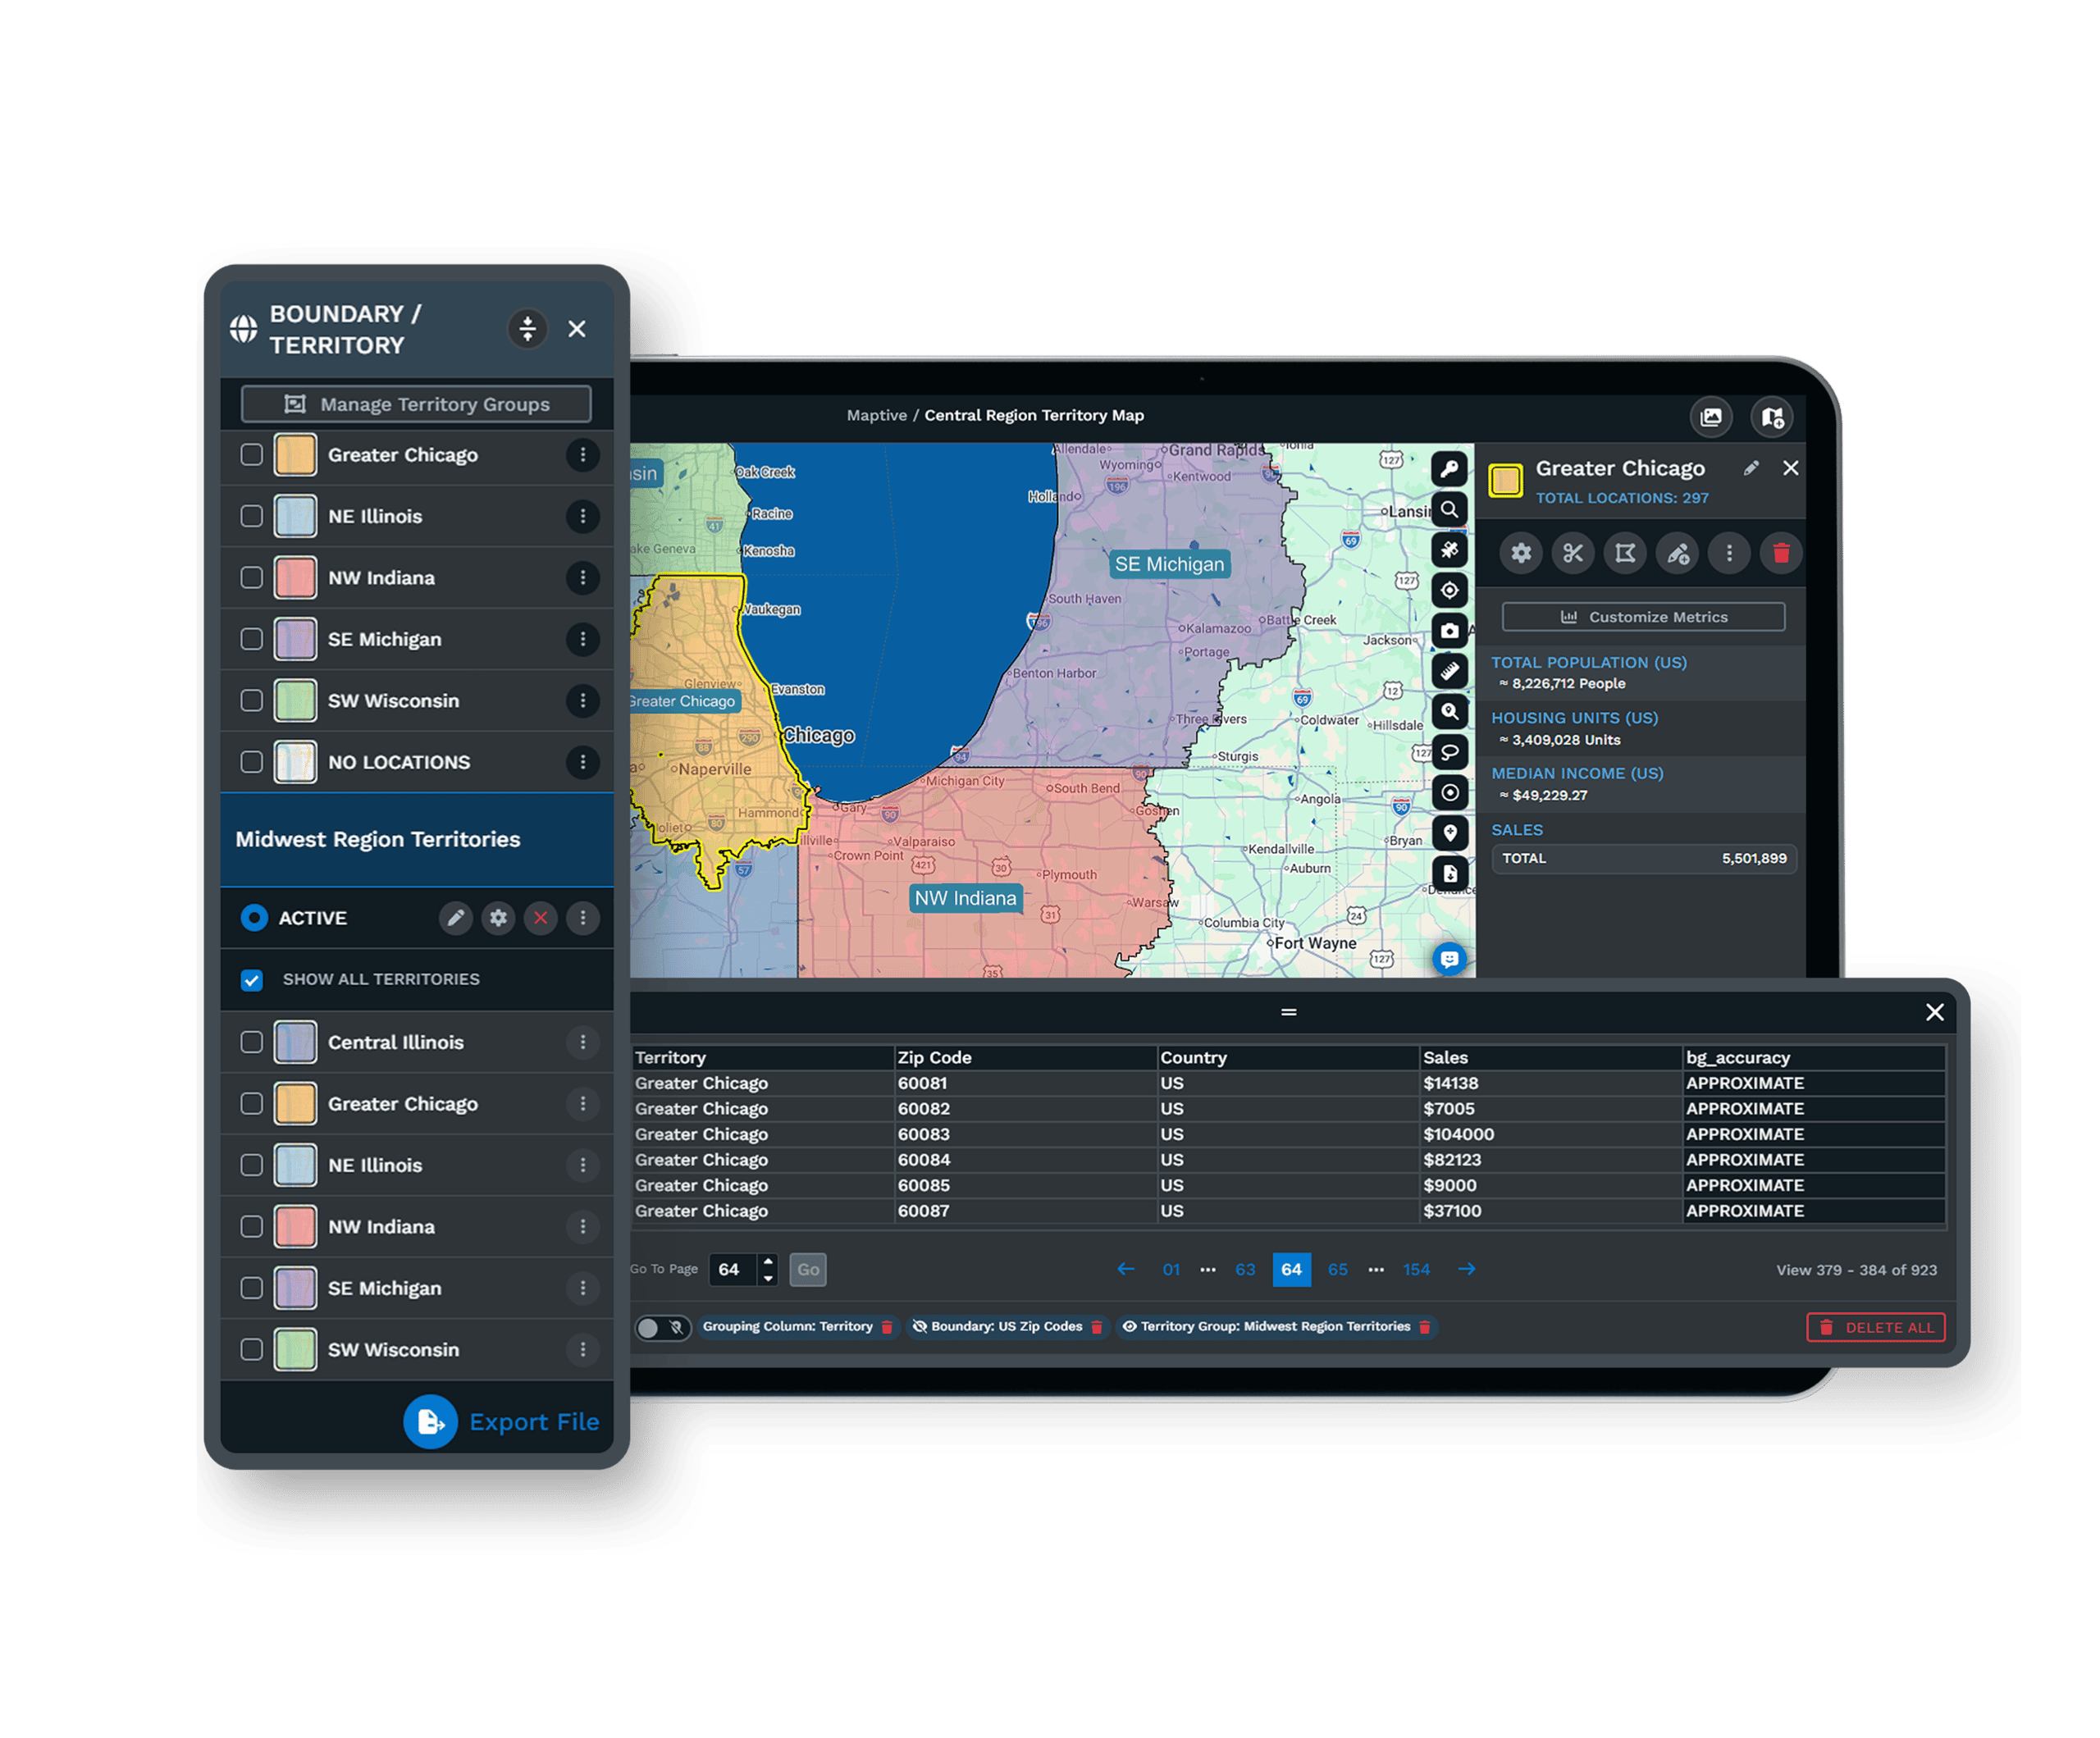
| 02 | Portfolio Mapping at ScalePlot every property, lease, and prospect together, up to 200,000 markers. Color-code by asset class, occupancy, or value, and the whole book reads at a glance. |
| 03 | Demographic and Market OverlaysMore than 50 census variables sit under each parcel, with a growing library of 580+ real-estate data categories alongside them. A property reads against the market around it, not the listing sheet alone. |
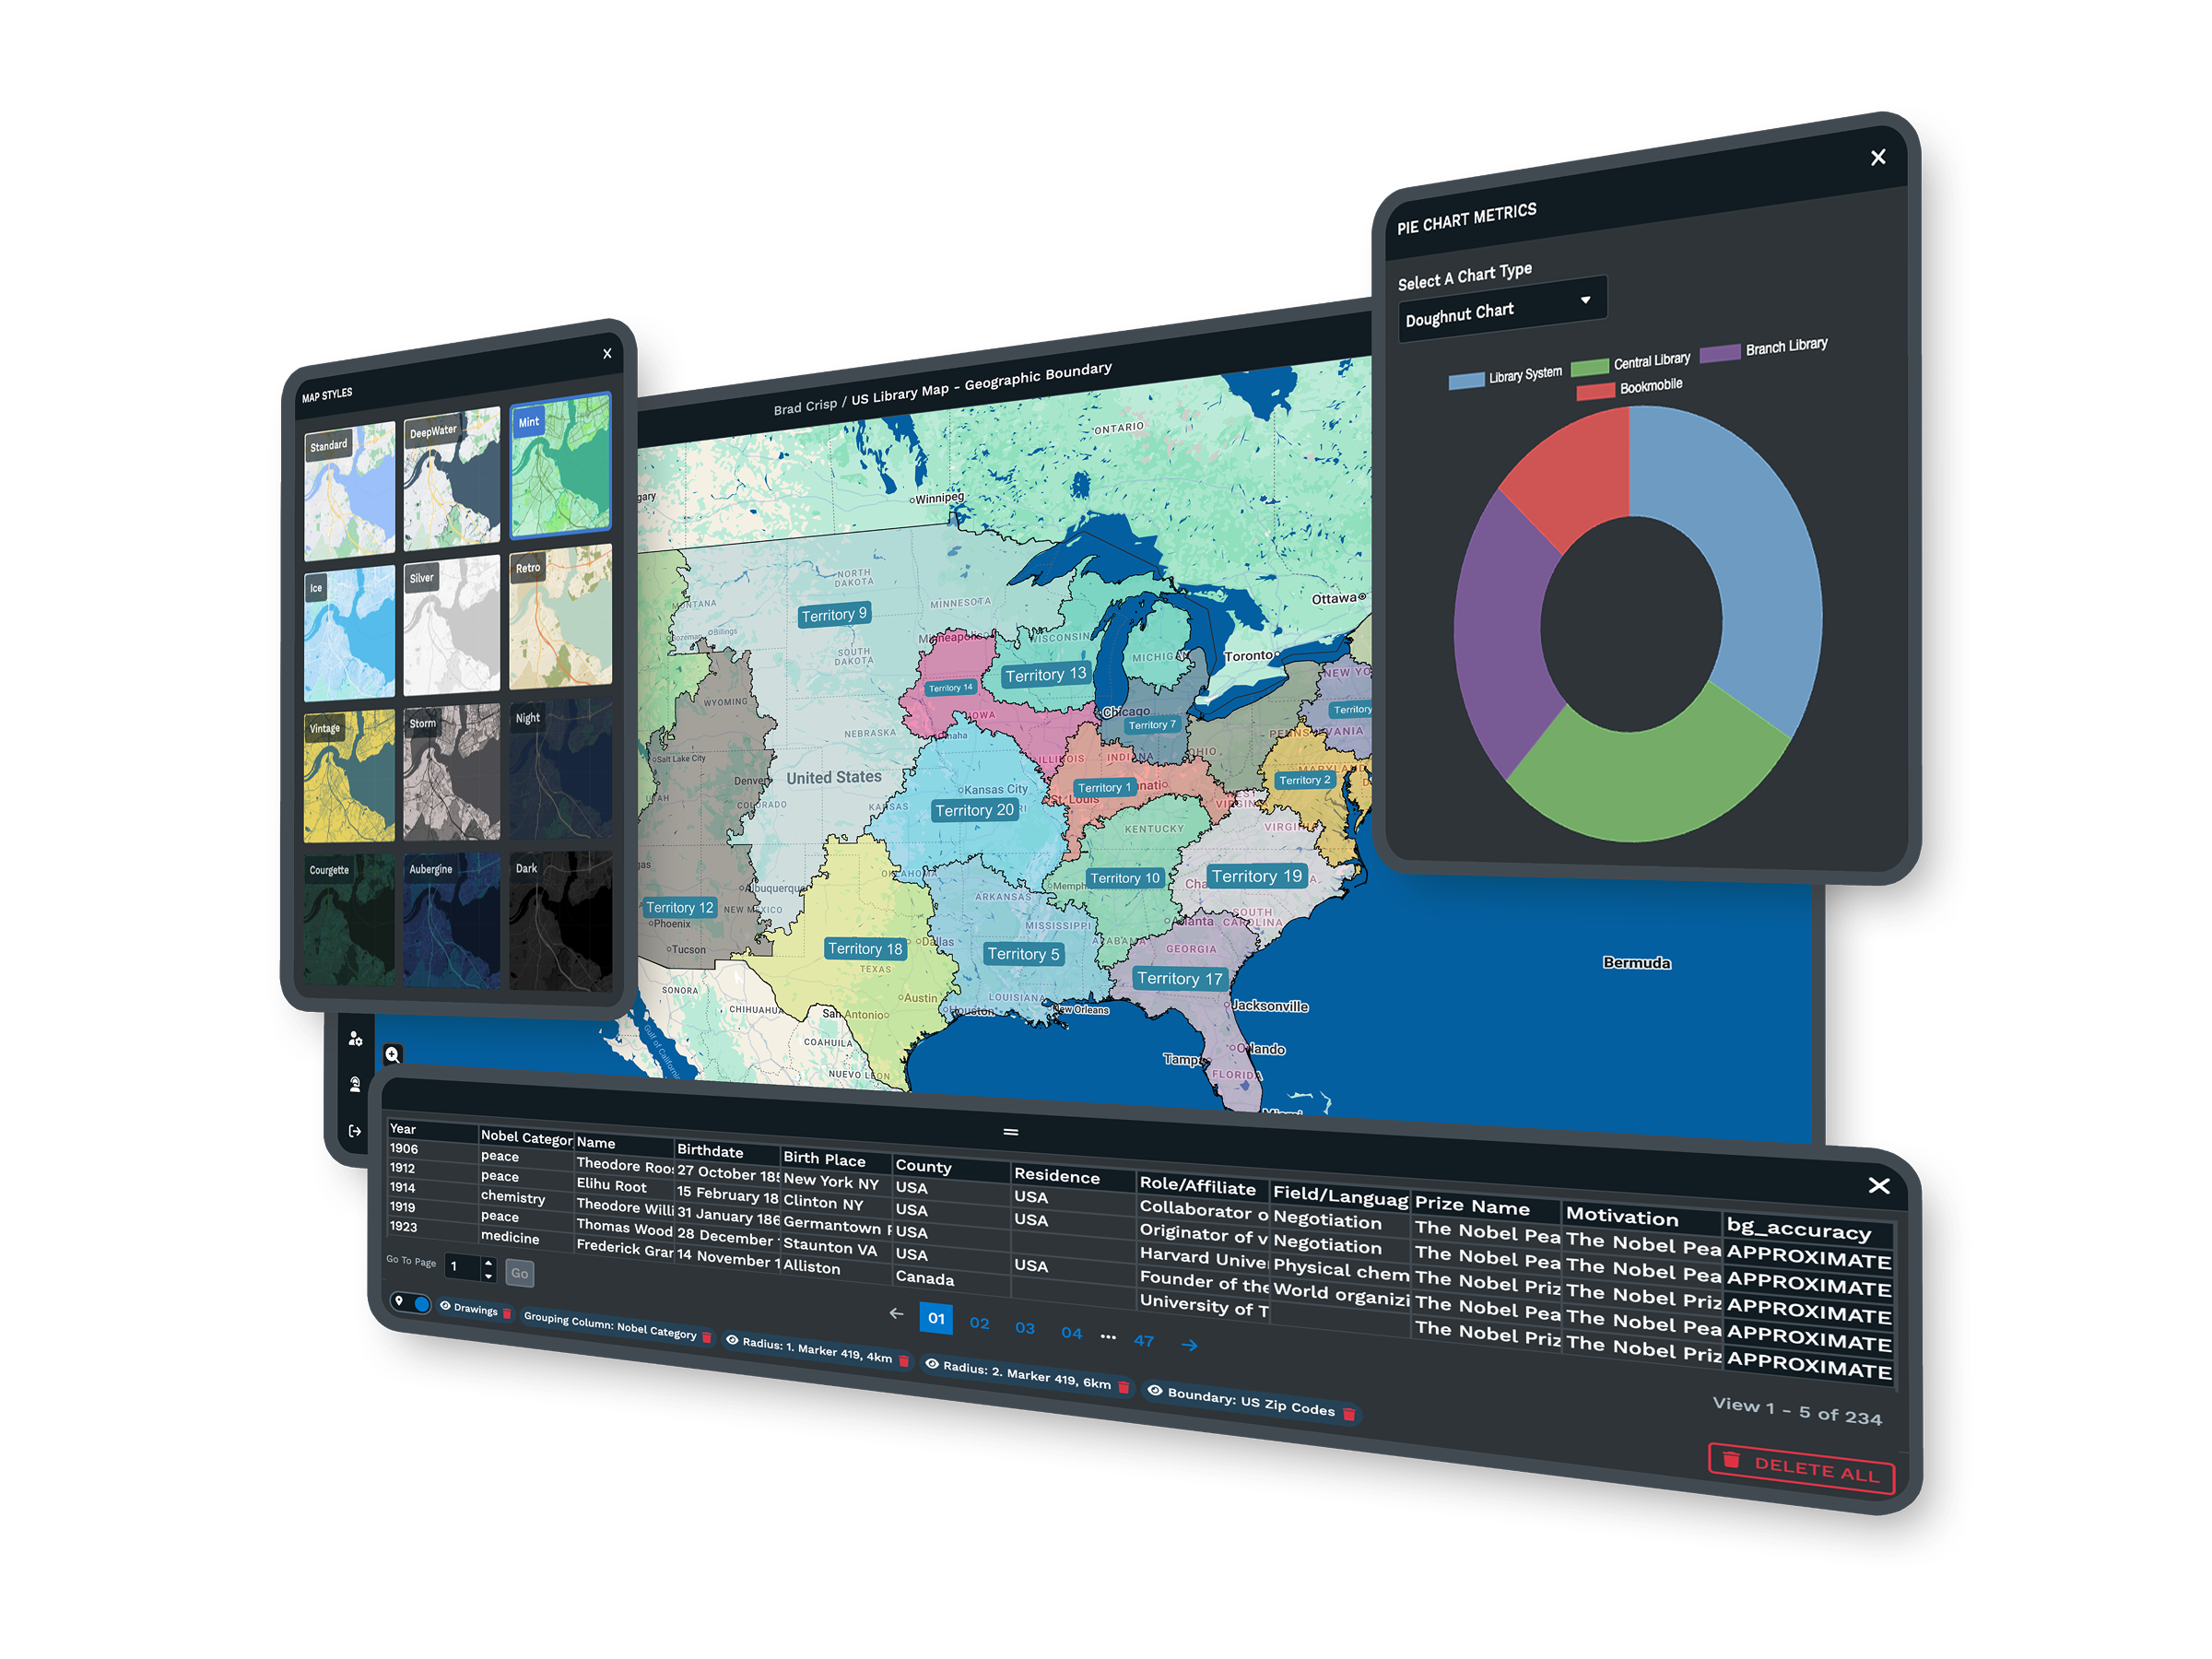
| 04 | Client-Ready Map ExportsExport poster-quality maps and demographic summaries straight into an offering memorandum or investor deck. A trade-area map makes a recommendation more convincing than a paragraph of description. |
| 05 | Password-Protected SharingShare a single property analysis through a link with the tools and columns you choose to expose. The client reviews the trade area without a login and without seeing the rest of your book. |
Working a Deal End to End
Sizing Up a Parcel by Its Market
The numbers on a listing describe the building. They say little about the demand that will fill it. Picture two retail parcels at the same price. The first sits in a trade area where income, density, and spending support a national tenant comfortably. The second reaches the same population, but the spending data shows the category is already saturated within a five-minute drive. On a listing they read alike. On a map with demographic overlays, one is a deal and the other is a vacancy risk the data already shows.
Turning Analysis Into a Pitch
Analysis that stays on your screen does not win a mandate. Maptive keeps the analysis and the deliverable in one workspace, so the trade-area map you build to evaluate a parcel is the same one you export into a pitch. Poster-quality exports drop into an offering memorandum without a separate design pass, and a password-protected link lets a client review the live map rather than a static export that goes stale partway through a long deal cycle. The path from running the numbers to presenting them stays short.
Built for Brokerages and Investors
Brokerages and Investors on Maptive
CBRE and other enterprise teams run location work on the platform, each after its own security review. A boutique brokerage and a national investment team use the same tools, with no analysis locked behind a higher tier.
Security IT and Compliance Approve
Maptive includes 256-bit SSL encryption, two-factor authentication, single sign-on, role-based access, and audit logging, with 99.9% uptime and a passed Salesforce AppExchange security review. It runs on Google Maps Platform infrastructure, so a national portfolio stays responsive on one map.
Support for Deal Teams
The US and Canada support team answers in under 15 minutes at a 9.7 out of 10 rating and helps configure your first map. The specialists understand how a deal team works, so onboarding fits the way brokers and analysts move.
Free trial, full platform, no credit card
Build a Deal Analysis Today
Take a ten-day free trial, no credit card needed. Plot a property, draw its trade area, and layer the demographic and market data that decides if the deal works. Every tool is unlocked from the first login, so you can build a real site analysis before you commit to anything.
Run a Live Deal With a Specialist
For brokerages and investment teams that want to see the platform on their own assets, a Maptive specialist will map a property or a portfolio and run the trade-area and export tools on it. This suits committee-driven evaluations and teams comparing platforms. Bring a live deal, and the session works through your parcel rather than a sample address.
Frequently Asked Questions
What is commercial real estate mapping software?
Commercial real estate mapping software plots properties on a map and layers the market data needed to judge them. Maptive lets brokers, investors, and developers map a parcel or a whole portfolio, draw a trade area around any address, and overlay income, density, and household data to measure demand. You can color-code by asset class or value, share a view with a client, and export maps into a pitch, all from data you upload rather than a fixed listing database.
How do I analyze a trade area for a commercial property?
Drop the property address on the map and draw a drive-time polygon around it, which follows real roads rather than a simple radius. Inside that boundary, layer census demographics, such as household income, density, and age, to measure the demand the site can reach. Comparing that demand against the rent or asking price tells you if the market supports the use. The whole analysis runs in one session, so you can size up several parcels in an afternoon.
What market data is included for evaluating a property?
Maptive includes more than 50 US Census variables at state, county, ZIP, tract, and block-group levels, covering income, density, age, household composition, and consumer spending, on every plan. A growing library of real-estate data categories adds further market detail alongside the census data. You map this against your own property and tenant data, so each parcel is read in the context of the people and demand around it rather than as an isolated line on a rent roll.
Can I map an entire portfolio at once?
Yes. A single Maptive map holds up to 200,000 markers, rendered with WebGL, so an entire portfolio loads on one screen rather than across separate files. Color-code properties by asset class, occupancy, value, or region, and the whole book reads at a glance. That overview makes it easy to spot concentration, compare assets against the demographics of their submarkets, and decide where to acquire, hold, or dispose without rebuilding a map for each analysis.
How do drive-time polygons help site analysis?
A drive-time polygon shows how far customers, tenants, or employees can travel to a property within a set number of minutes along real roads. For commercial real estate, that is a far more accurate trade area than a radius, because it follows how people move through a market. Maptive draws these polygons around any parcel and measures the demographics and demand inside them, turning a vague location into a measured catchment.
Can I share a property analysis with a client who is not a user?
Yes. Password-protected links share a single map with the exact tools and data columns you choose to expose. The client reviews the trade area and the analysis without a login, without editing rights, and without seeing the rest of your portfolio. Because the link shows the live map, it updates as the underlying data changes, so a client always sees the current version rather than a static export that goes stale partway through a long deal cycle.
Can I export maps for an offering memorandum or investor deck?
Yes. Maptive exports high-resolution maps, up to poster size, along with demographic summaries, so a trade-area map drops straight into an offering memorandum, a pitch, or an investor presentation. The export carries the analysis you ran, not a screenshot, which means the deliverable stays accurate and on-brand without a separate design pass. Keeping analysis and presentation in one workspace shortens the path from running the numbers to putting them in front of a decision-maker.
Does Maptive include property listings or parcel data?
Maptive maps the data you provide rather than a fixed listings database, so you upload your own properties, leases, and prospects and layer census and market data around them. That keeps the platform flexible across asset types and brokerages, since you are not limited to one provider's coverage. If you maintain property data in a spreadsheet or a CRM, you import it directly, and the geocoding engine plots each record and cleans the addresses as they load.
How current is the demographic data?
Maptive's census demographics come from official US and Canadian government sources and are refreshed on a regular schedule, so the income, density, and household figures you map show current published data rather than a one-time snapshot. The wider market-data library is updated through a long-standing data partnership. Because the data lives on the platform, every analysis you run pulls the current figures, and a map you share with a client shows those updates automatically.
Do I need GIS expertise to use Maptive?
No. Maptive is built for real estate professionals, not GIS specialists. You upload a spreadsheet of properties, the platform geocodes it, and the trade-area, demographic, and export tools work through a plain interface. Most brokers and analysts produce a usable property analysis in their first session, and the support team is on hand to set up the first map. The goal is to put market analysis directly in the hands of the deal team, without a technical specialist in between.

