Custom Color Coded Map
A color coded map in Maptive paints pin color, boundary fill color, and heat color from any column you pick in a single uploaded file, with a key for every color rule on view.
No credit card required
- Pin color by group
- Numeric pin buckets
- Boundary fill by data
- Manual boundary fills
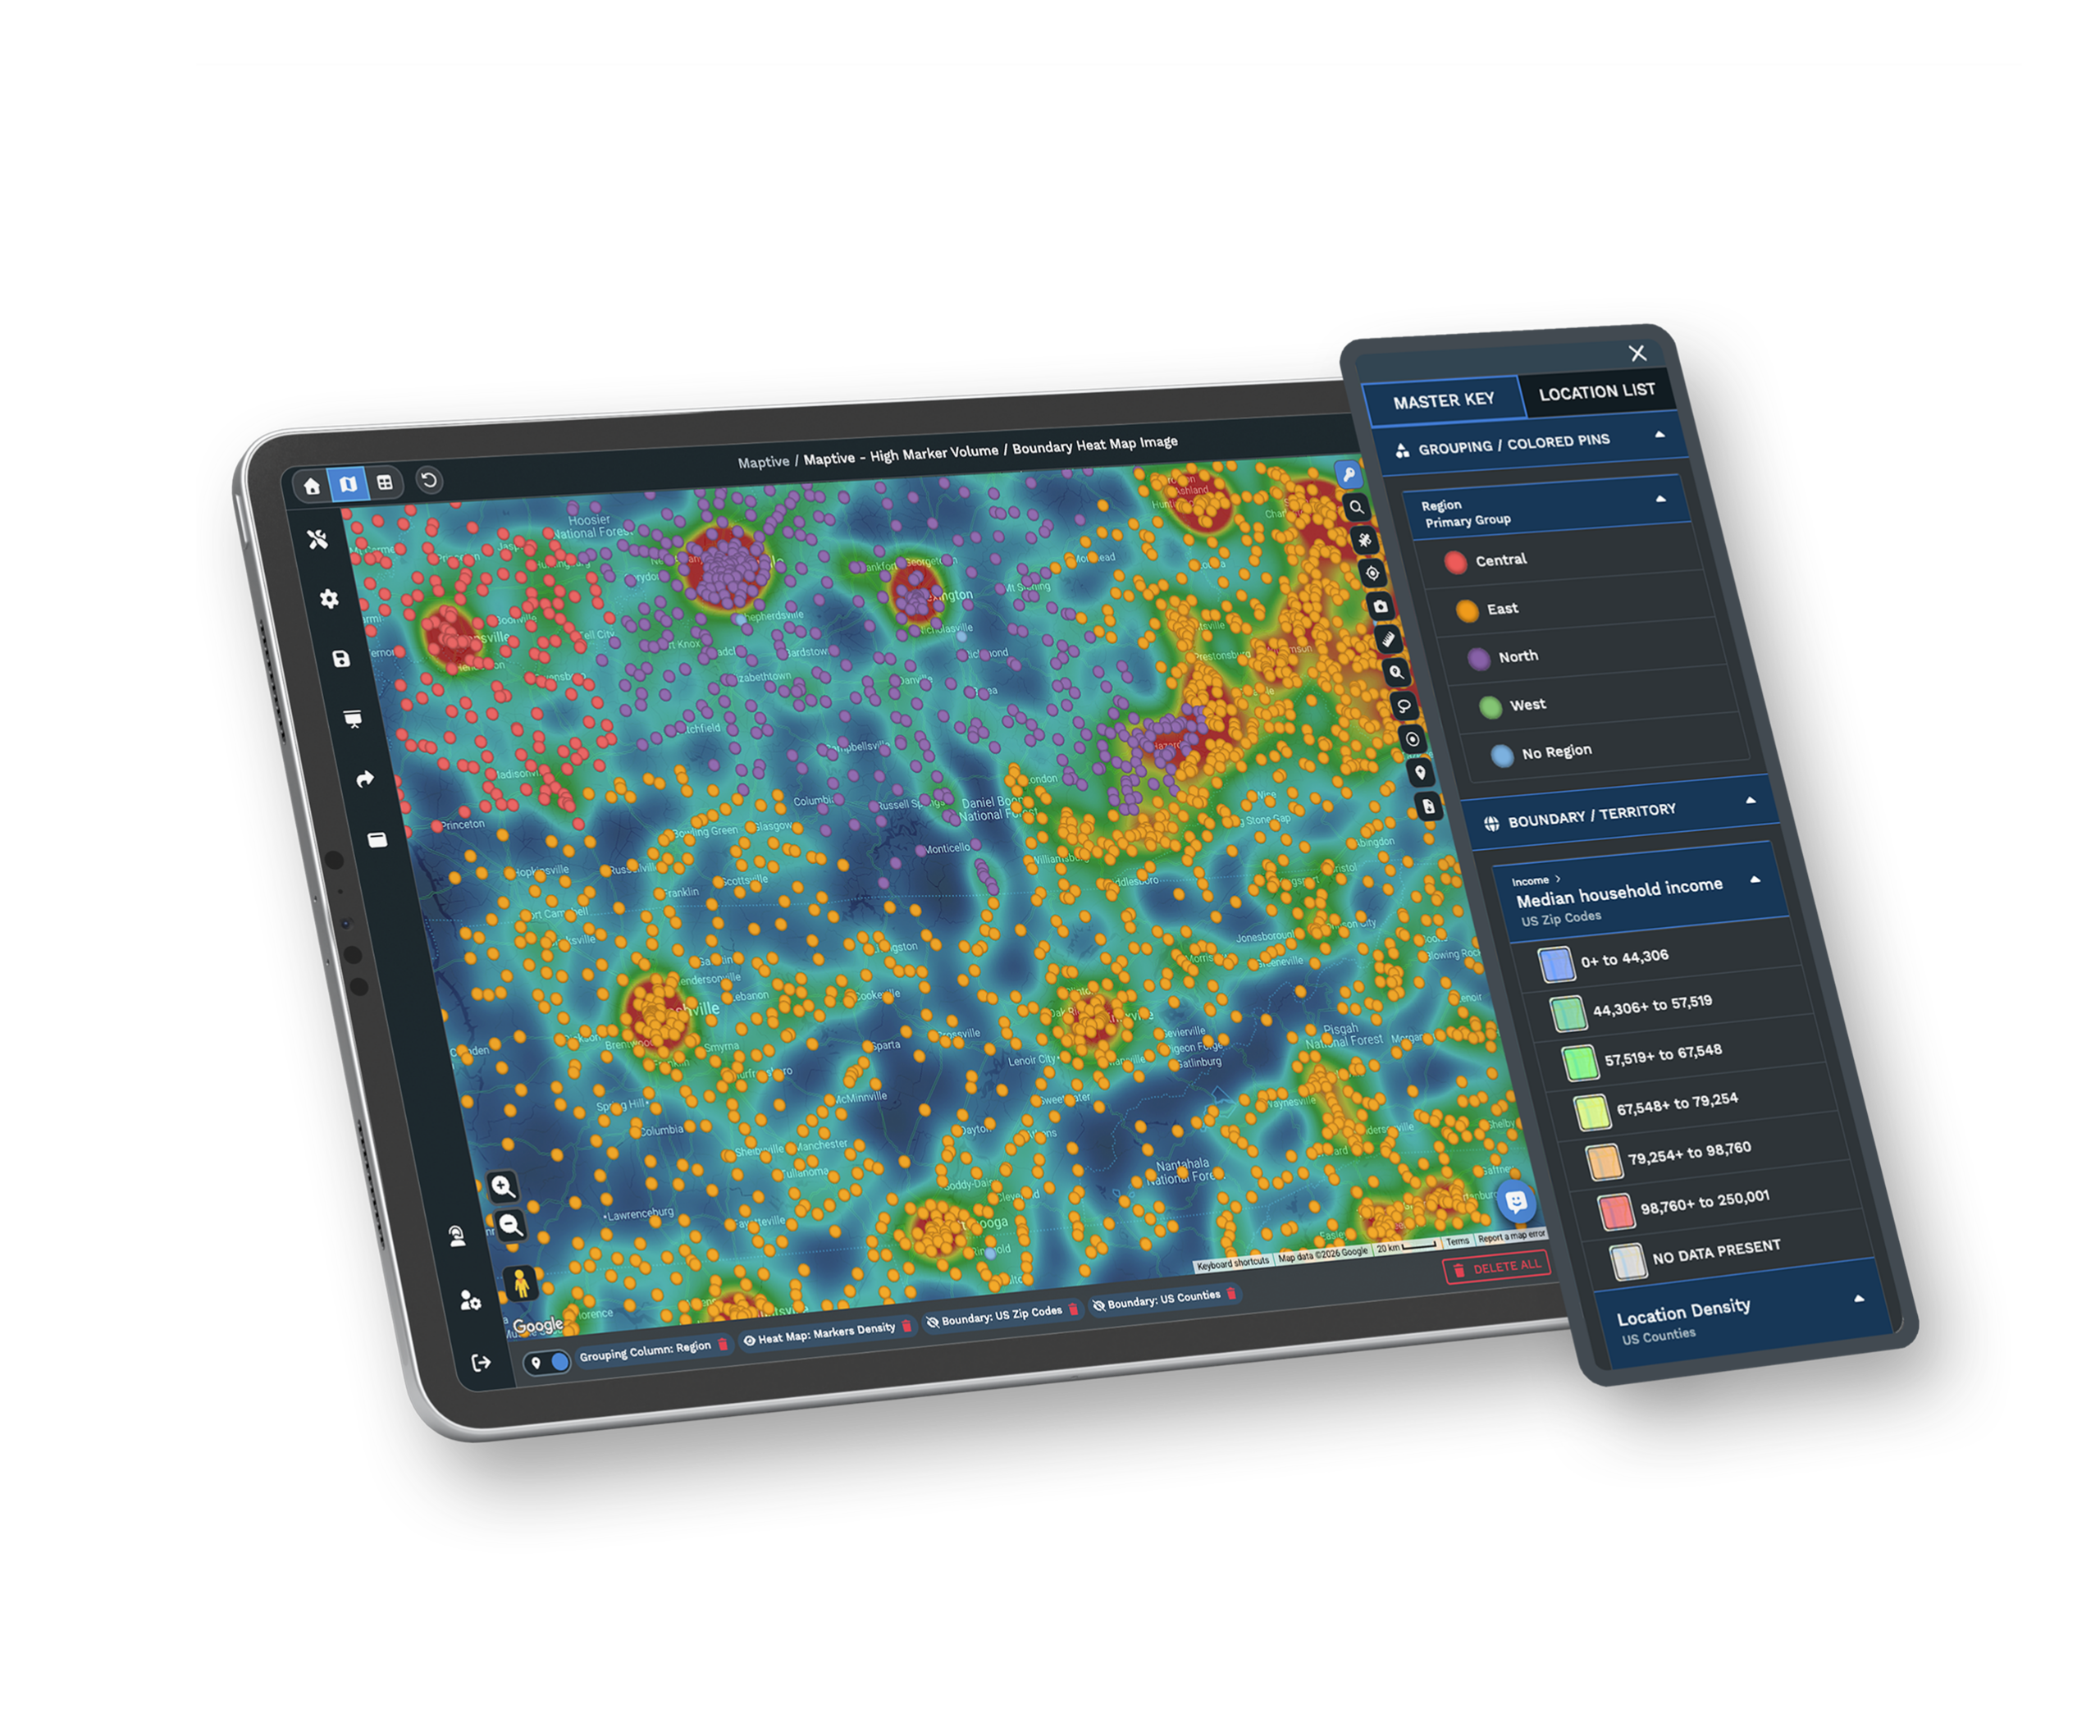
- Heat color palette
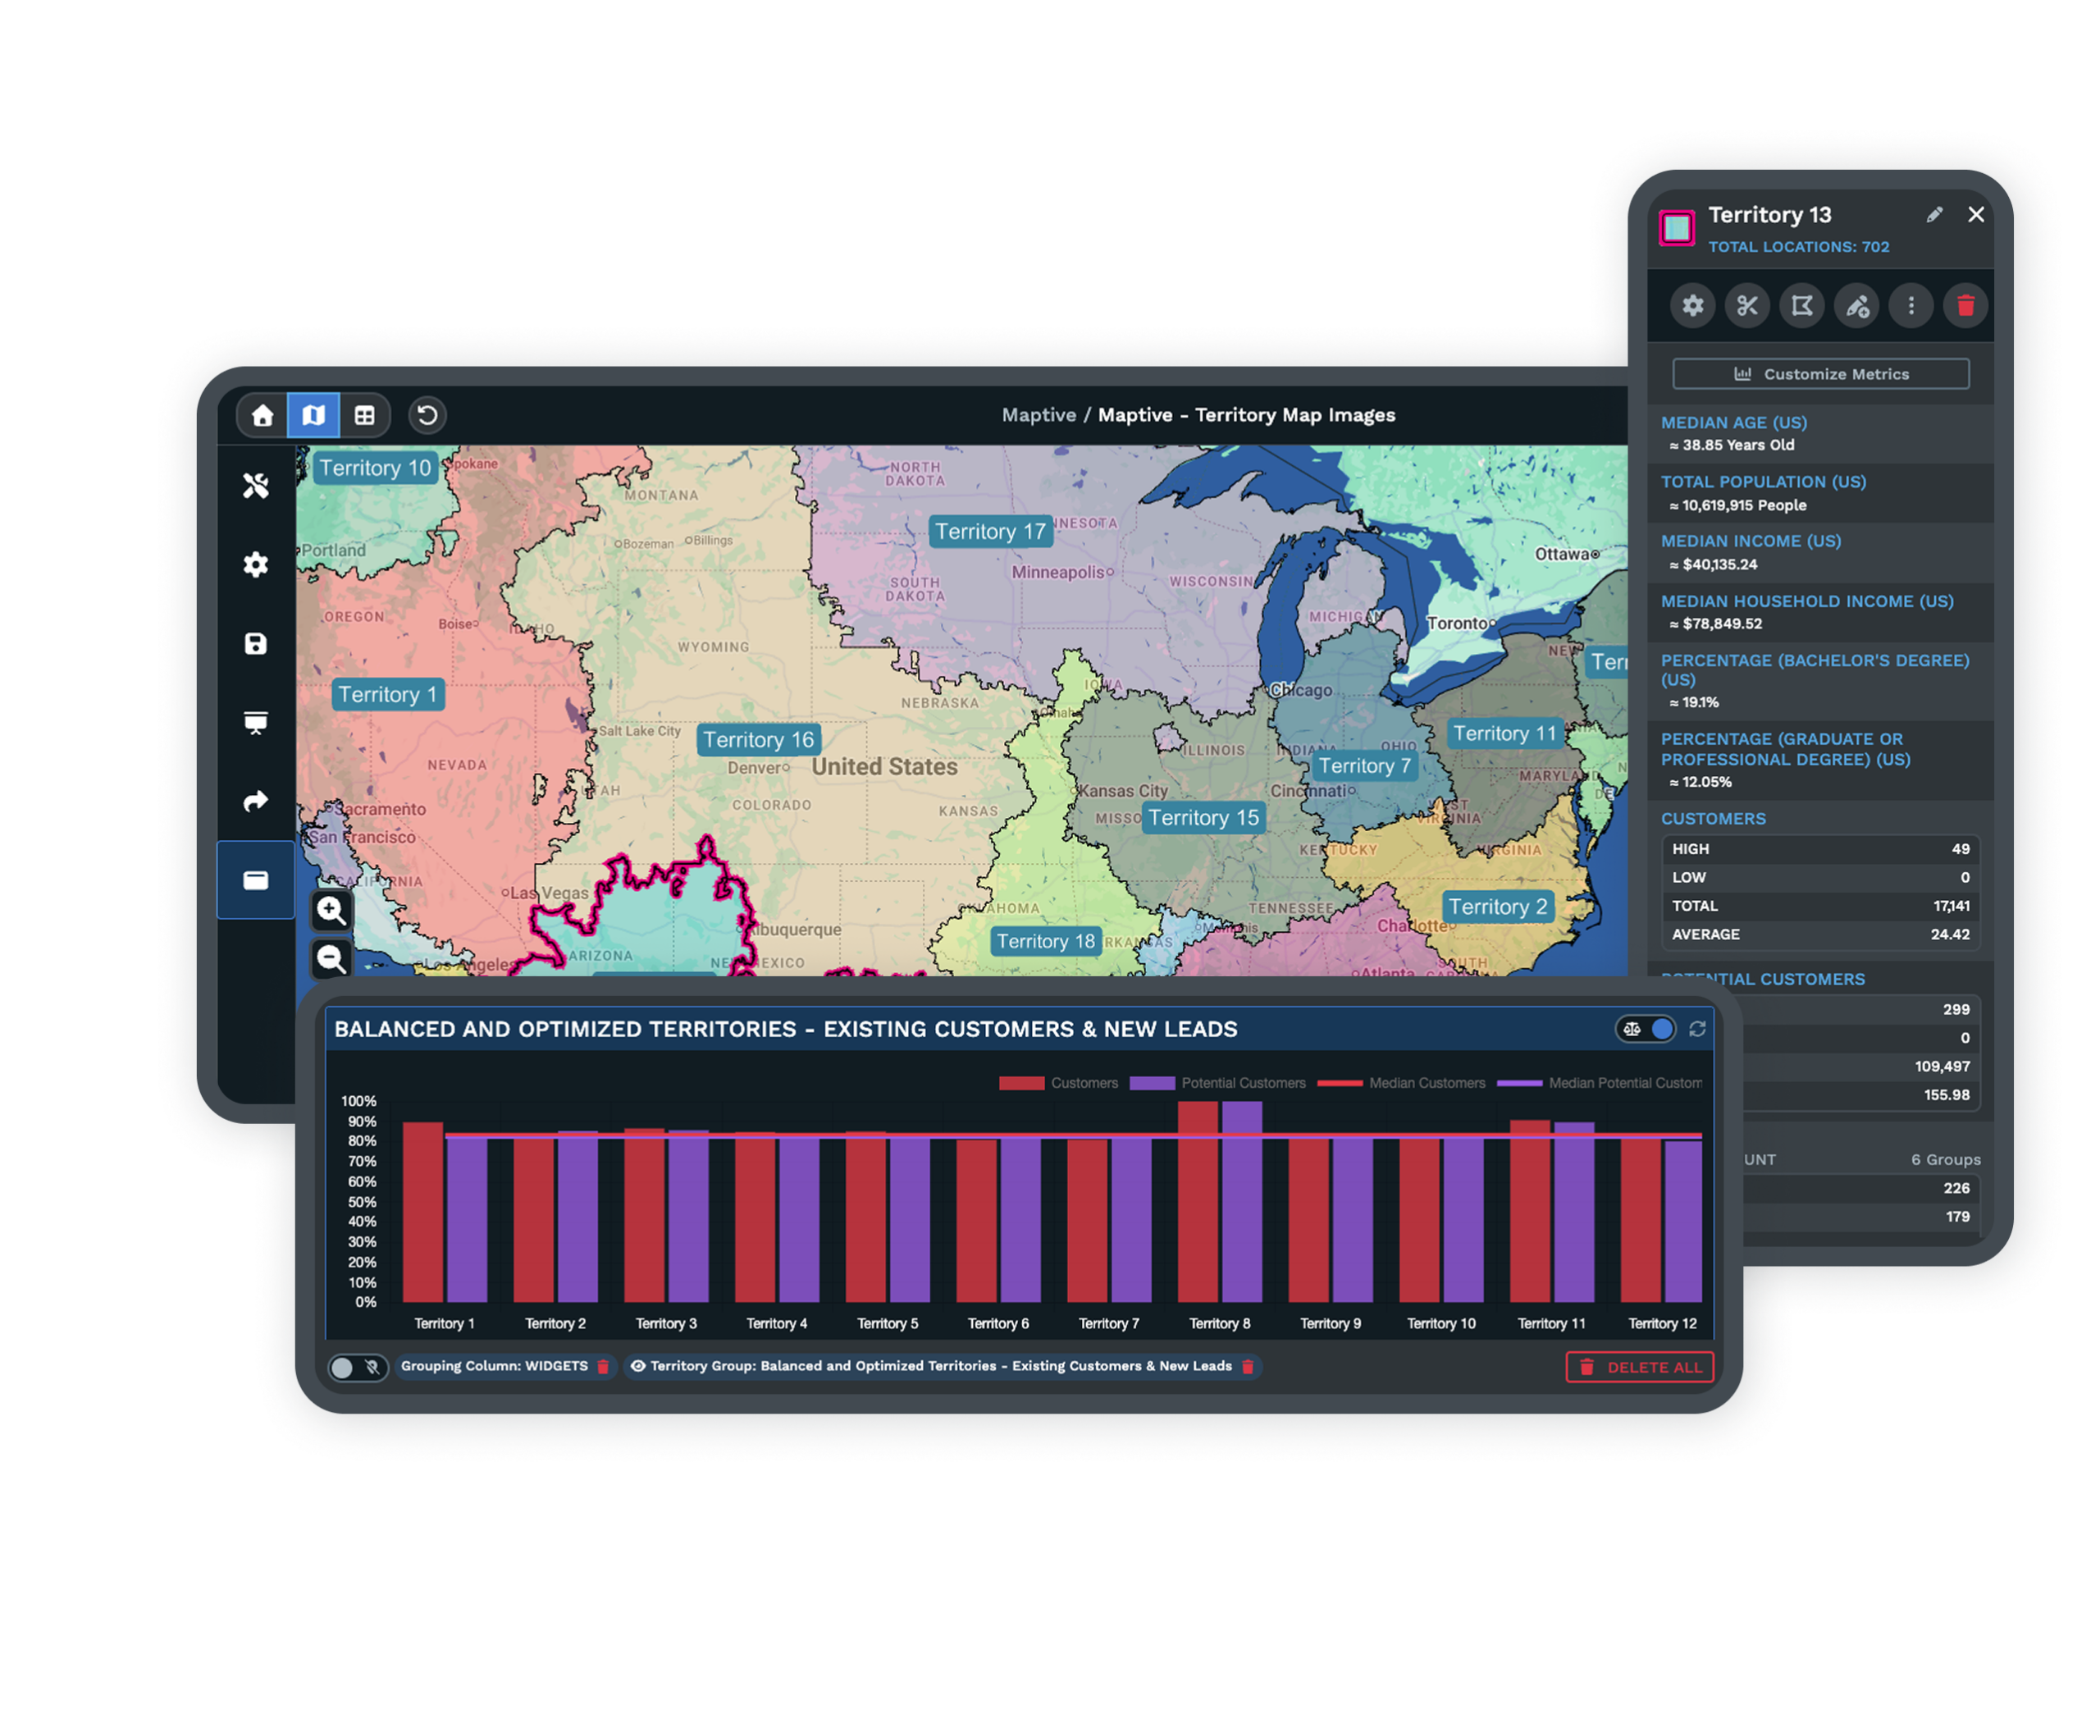
- Drawn territory color
Trusted by teams at


Color Coded Maps Built Several Ways
Color code your map across 6 paths in Maptive. Pin color, numeric pin buckets, boundary fills by data, manual boundary picks, heat color, and drawn territory color sit on the same map.
Marker color by group
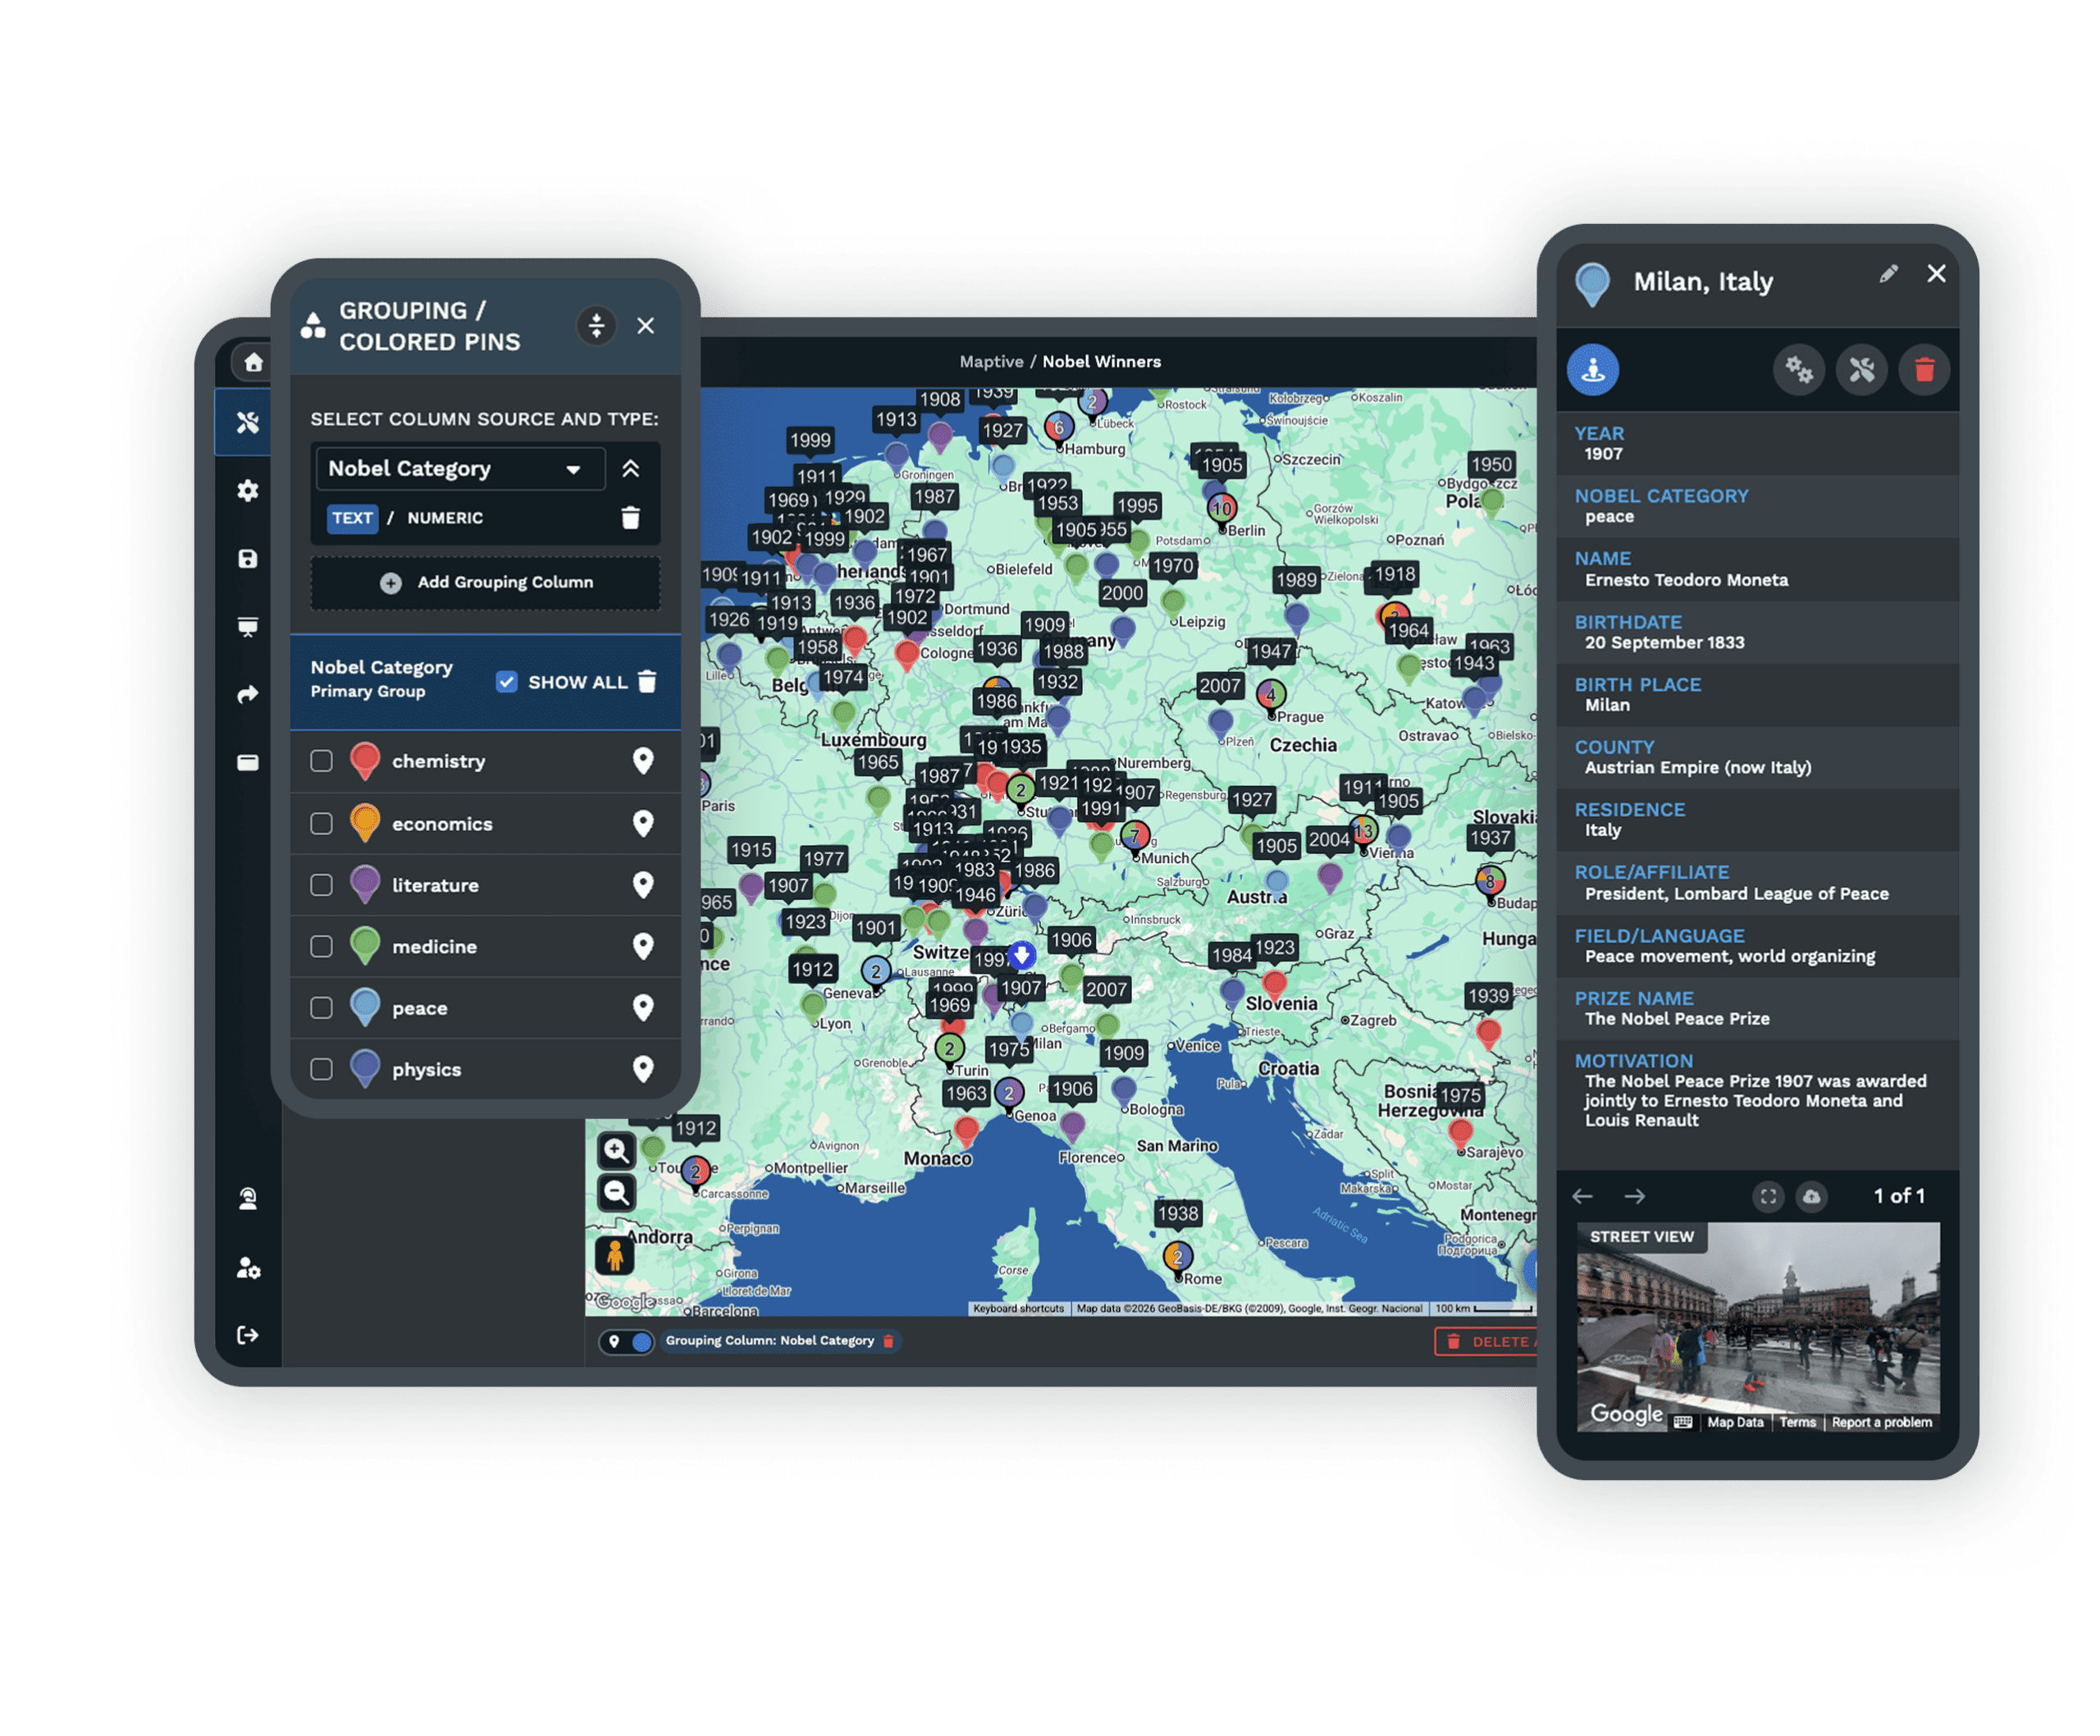
Open the Grouping Tool, pick a column as the Primary Group, and Maptive paints every pin tied to each value a separate color.
Numeric pin buckets
Switch a number column to Numeric in the Grouping Tool, pick Value Ranges or Percentage Ranges, then color pins as Blue, Multi-color, or Growing pins.
Boundary fill by data
Open the Boundary Tool, pick a Boundary Set, then fill by My Numerical Data, My Group / Territory Data, Marker Count, or Demographic Census Data.
Manual boundary coloring
Pick No Fill / Manual Fill, click Set Manual Fill, then hand-pick boundaries On Click, On Hover, or by Lasso Tool, and save a fill group color.
Heat color palette
Open the Heat Mapping Tool, pick Marker Density or Represents Numerical Data, set up to 3 gradient color stops, then flip Gradient on.
Drawn territory color
Open the Territories Tool, draw a polygon or select boundaries, then pick a territory color and fill transparency at save for every territory tone.
Color a Map in 3 Steps
Upload
Upload your file to Maptive as xlsx, xls, csv, or tsv, and every row plots as a pin on the base map for color coding.
Color
Open Map Tools, pick the Grouping Tool, Boundary Tool, Heat Mapping Tool, or Territories Tool, then color by a column.
View
A color coded map and a key appear, ready to share by link, embed in a deck, or export to a file for an offline view.
What a Color Coded Map Shows
A column that hides as digits or text in a file turns into a pattern you can see at a glance on the map.
Pin Color
Pick a categorical column like owner, status, or region in the Grouping Tool, and every value takes its own pin color. Color clusters show a regional pattern, and a lone pin flags an outlier.
Numeric Pin Buckets
Switch a number column like sales or score to Numeric in the Grouping Tool, then split it by Value Ranges or Percentage Ranges. Maptive colors each bucket across Blue, Multi-color, or Growing pins, so highs and lows separate at a glance.
Boundary Fills
Fill regions by My Numerical Data, Group / Territory Data, Marker Count, or Demographic Census Data, and the map colors each state, county, or zip by that metric. A planning call moves faster when every region carries its own color.
Manual Boundary Picks
Need color for a region your data does not name yet? Load the set with No Fill / Manual Fill, then pick boundaries On Click, On Hover, or by Lasso. Save them as a Fill Group, and the manual fill stays alongside your data-driven fills.
Heat Color
Paint density or a numeric value across the map with the Heat Mapping Tool. Set the radius, opacity, and intensity, then pick up to 3 gradient color stops, or turn Gradient off for a single solid color.
Layered Fills, 1 Set
Stack more than 1 fill on a single Boundary Set with Add More Fills, from Numerical to Group / Territory, Marker Count, and Census. Click a fill's number in the quick menu to switch the active rule, and the boundaries re-paint.
Color Coding Maps in Practice
Pins Colored by Column
A color coded map in Maptive starts with the simplest path. A column in your uploaded file holds a value worth a color, and the Grouping Tool turns that column into a colored pin map. Open Map Tools, pick the Grouping Tool / Colored Pins Tool, and pick the column you want as Primary Group. Every unique value picks up its own color, and every pin tied to a row in that value takes that color across the pin map.
The output is a colored pin map and a key, with each group listed next to the color it carries. Click the small white icon to the right of a group to open the picker and set a custom color or marker style. The choices stick across reloads of the same data set, so the rule looks the same on day 1 and day 30. A numeric column works through the same tool with a different switch. Pick Numeric, set the number of ranges, pick Value Ranges or Percentage Ranges, choose a marker style, then click Group Now.
Boundaries Colored by Value
A boundary fill on a color coded map is the path for a region answer. Open the Boundary Tool, pick a Boundary Set, then pick a fill type. The 5 fill types are No Fill / Manual Fill, My Numerical Data, My Group / Territory Data, Marker Count / Location Density, and Demographic Census Data. Click Load Boundaries, and the map paints each region a color from your data.
Fill Settings carry the color logic. A color progression runs across the numeric ranges, and you set the number of ranges and pick Value Ranges or Percentage Ranges. Opacity runs 0 to 100, color picks accept an HTML code, and any range gets customized. Boundary Formatting sits alongside the fill controls, where Line Width and Line Color tune the outline of each region. Add More Fills lets a Boundary Set carry many fills, with 1 active at a time. You can also pull Demographic Census Data for a region with no extra columns.
Heat and Territory Color
A heat colored map is the 3rd path for a color coded view in Maptive. Open the Heat Mapping Tool from Map Tools, pick a heat map style, and click Add Heat Map. Marker Density uses every marker as a count of 1, and Represents Numerical Data takes a numeric column like Sales, Price, or Square Ft. for the heat weight. Adjust radius, opacity, and intensity threshold to set the spread, set the 3 color stops, or flip the Gradient toggle for a single solid color heat.
The Territories Tool adds a 4th color path. Open Map Tools, pick the Territories Tool, then draw a polygon or pick boundaries with On Click, On Hover, or Lasso Tool. At save, pick a territory color and a fill transparency for each territory. The drawn territories sit alongside the pin color, the boundary fill, and the heat color, so a single color coded map can carry every color rule at the same time.
Related Features
The tools teams reach for alongside a color coded map.
Color Coded Map FAQs
Can I color code my map by any column in my data set?
How do I color code a boundary by a number in my file?
Can I color code a heat map by a number column?
Can I color in boundaries by hand without any data column?
How do I change the color of a single boundary range?
Can I switch a categorical color rule to a numeric color rule?
Can I hide a color group on the map without removing it?
Can I color code a map by Census data without any column in my file?
Can I stack more than 1 fill on the same boundary set?
Can I share a color coded map with my team?
Free trial, every tool, no credit card
Put Color Coding to Work on Your Map
Start a 10-day free trial with no credit card and every tool unlocked, or book a demo to see Maptive color code your own data.


