Supply Chain & Logistics Mapping Software
Maptive plans the routes, territories, and distribution points behind your logistics. Optimize multi-stop trips, balance delivery zones, and site a warehouse against real demand, all from one spreadsheet upload.
No credit card required
- Optimize routes up to 73 stops
- Turn-by-turn nav to any phone
- Map distribution & demand
- Drive-time service areas
- Balance routes across drivers
- See coverage gaps fast
- Optimize routes up to 73 stops
- Turn-by-turn nav to any phone
- Map distribution & demand
- Drive-time service areas
- Balance routes across drivers
- See coverage gaps fast
Trusted by teams at


What Logistics Teams Save
Routes sequenced on real roads cut the miles a straight-line plan leaves in.
Tighter routing fits more stops into the same working day.
Constraint-based balancing trims cost across a full fleet, not one route at a time.
Routing, Zones, and Network Design
| 01 | Multi-Stop Route OptimizationSequence up to 73 stops per trip on real road networks to minimize travel time, then export turn-by-turn directions to a driver's phone. Drag a stop to change the order and the path updates in place. |
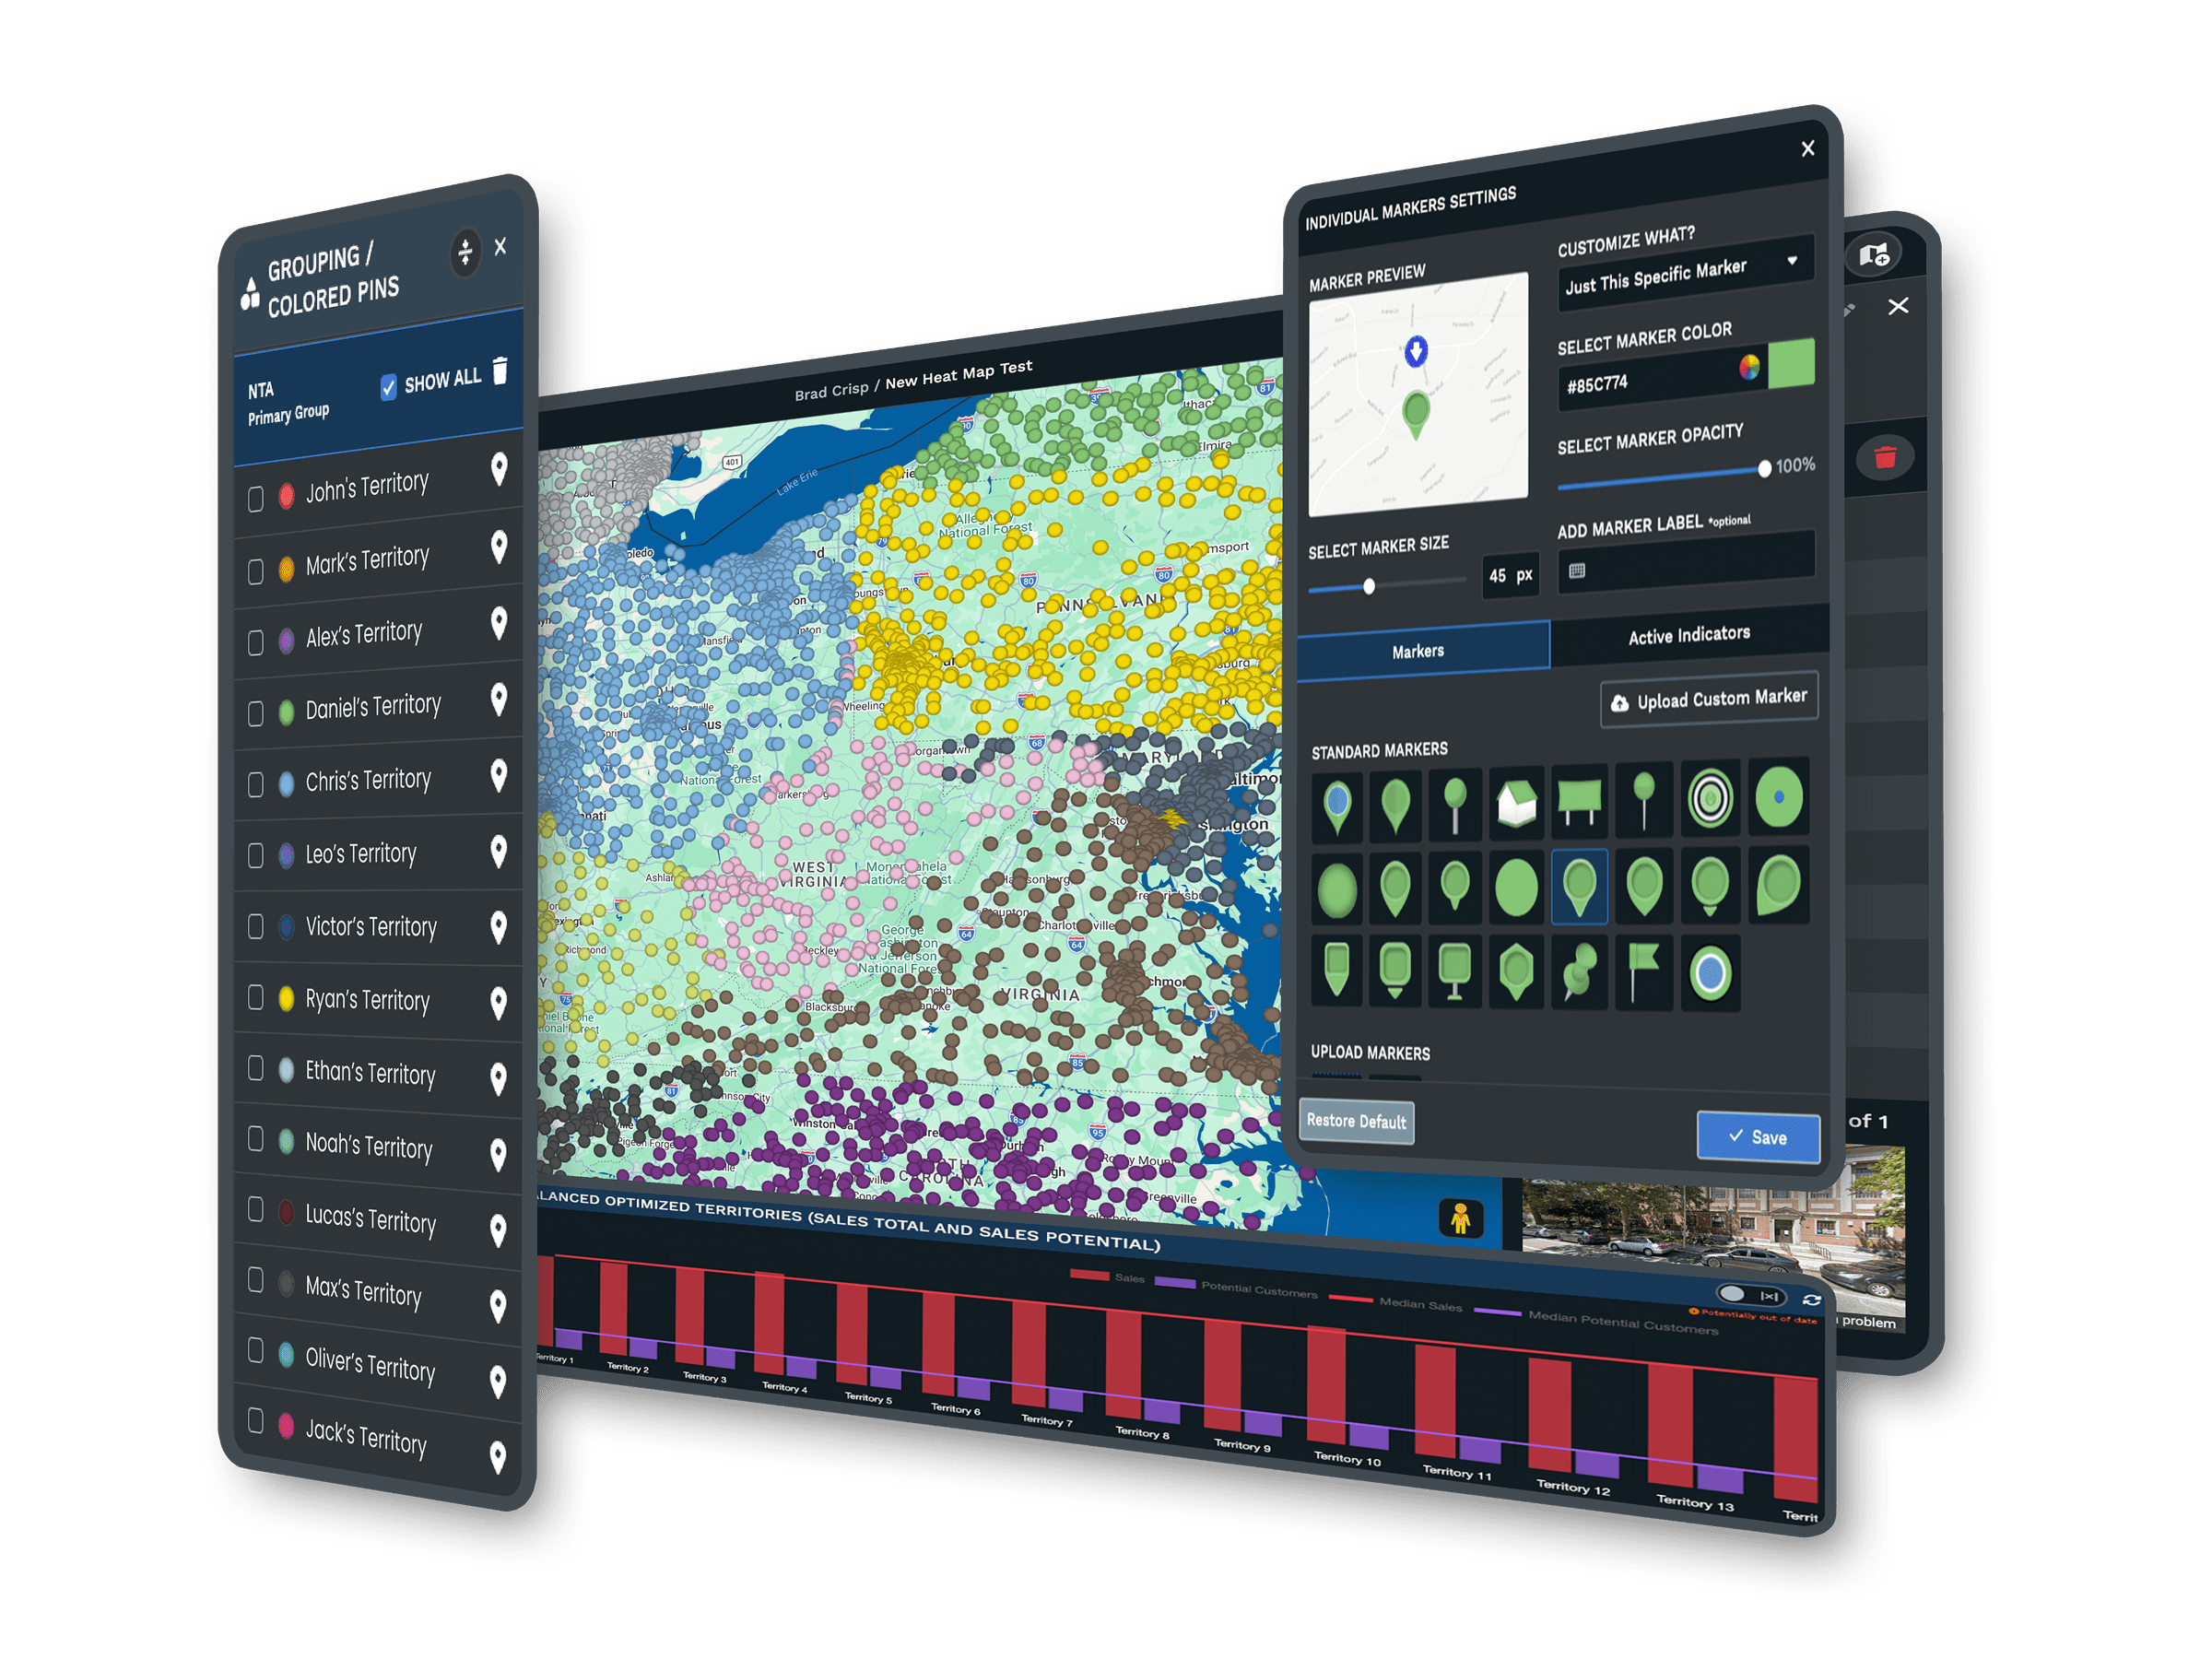
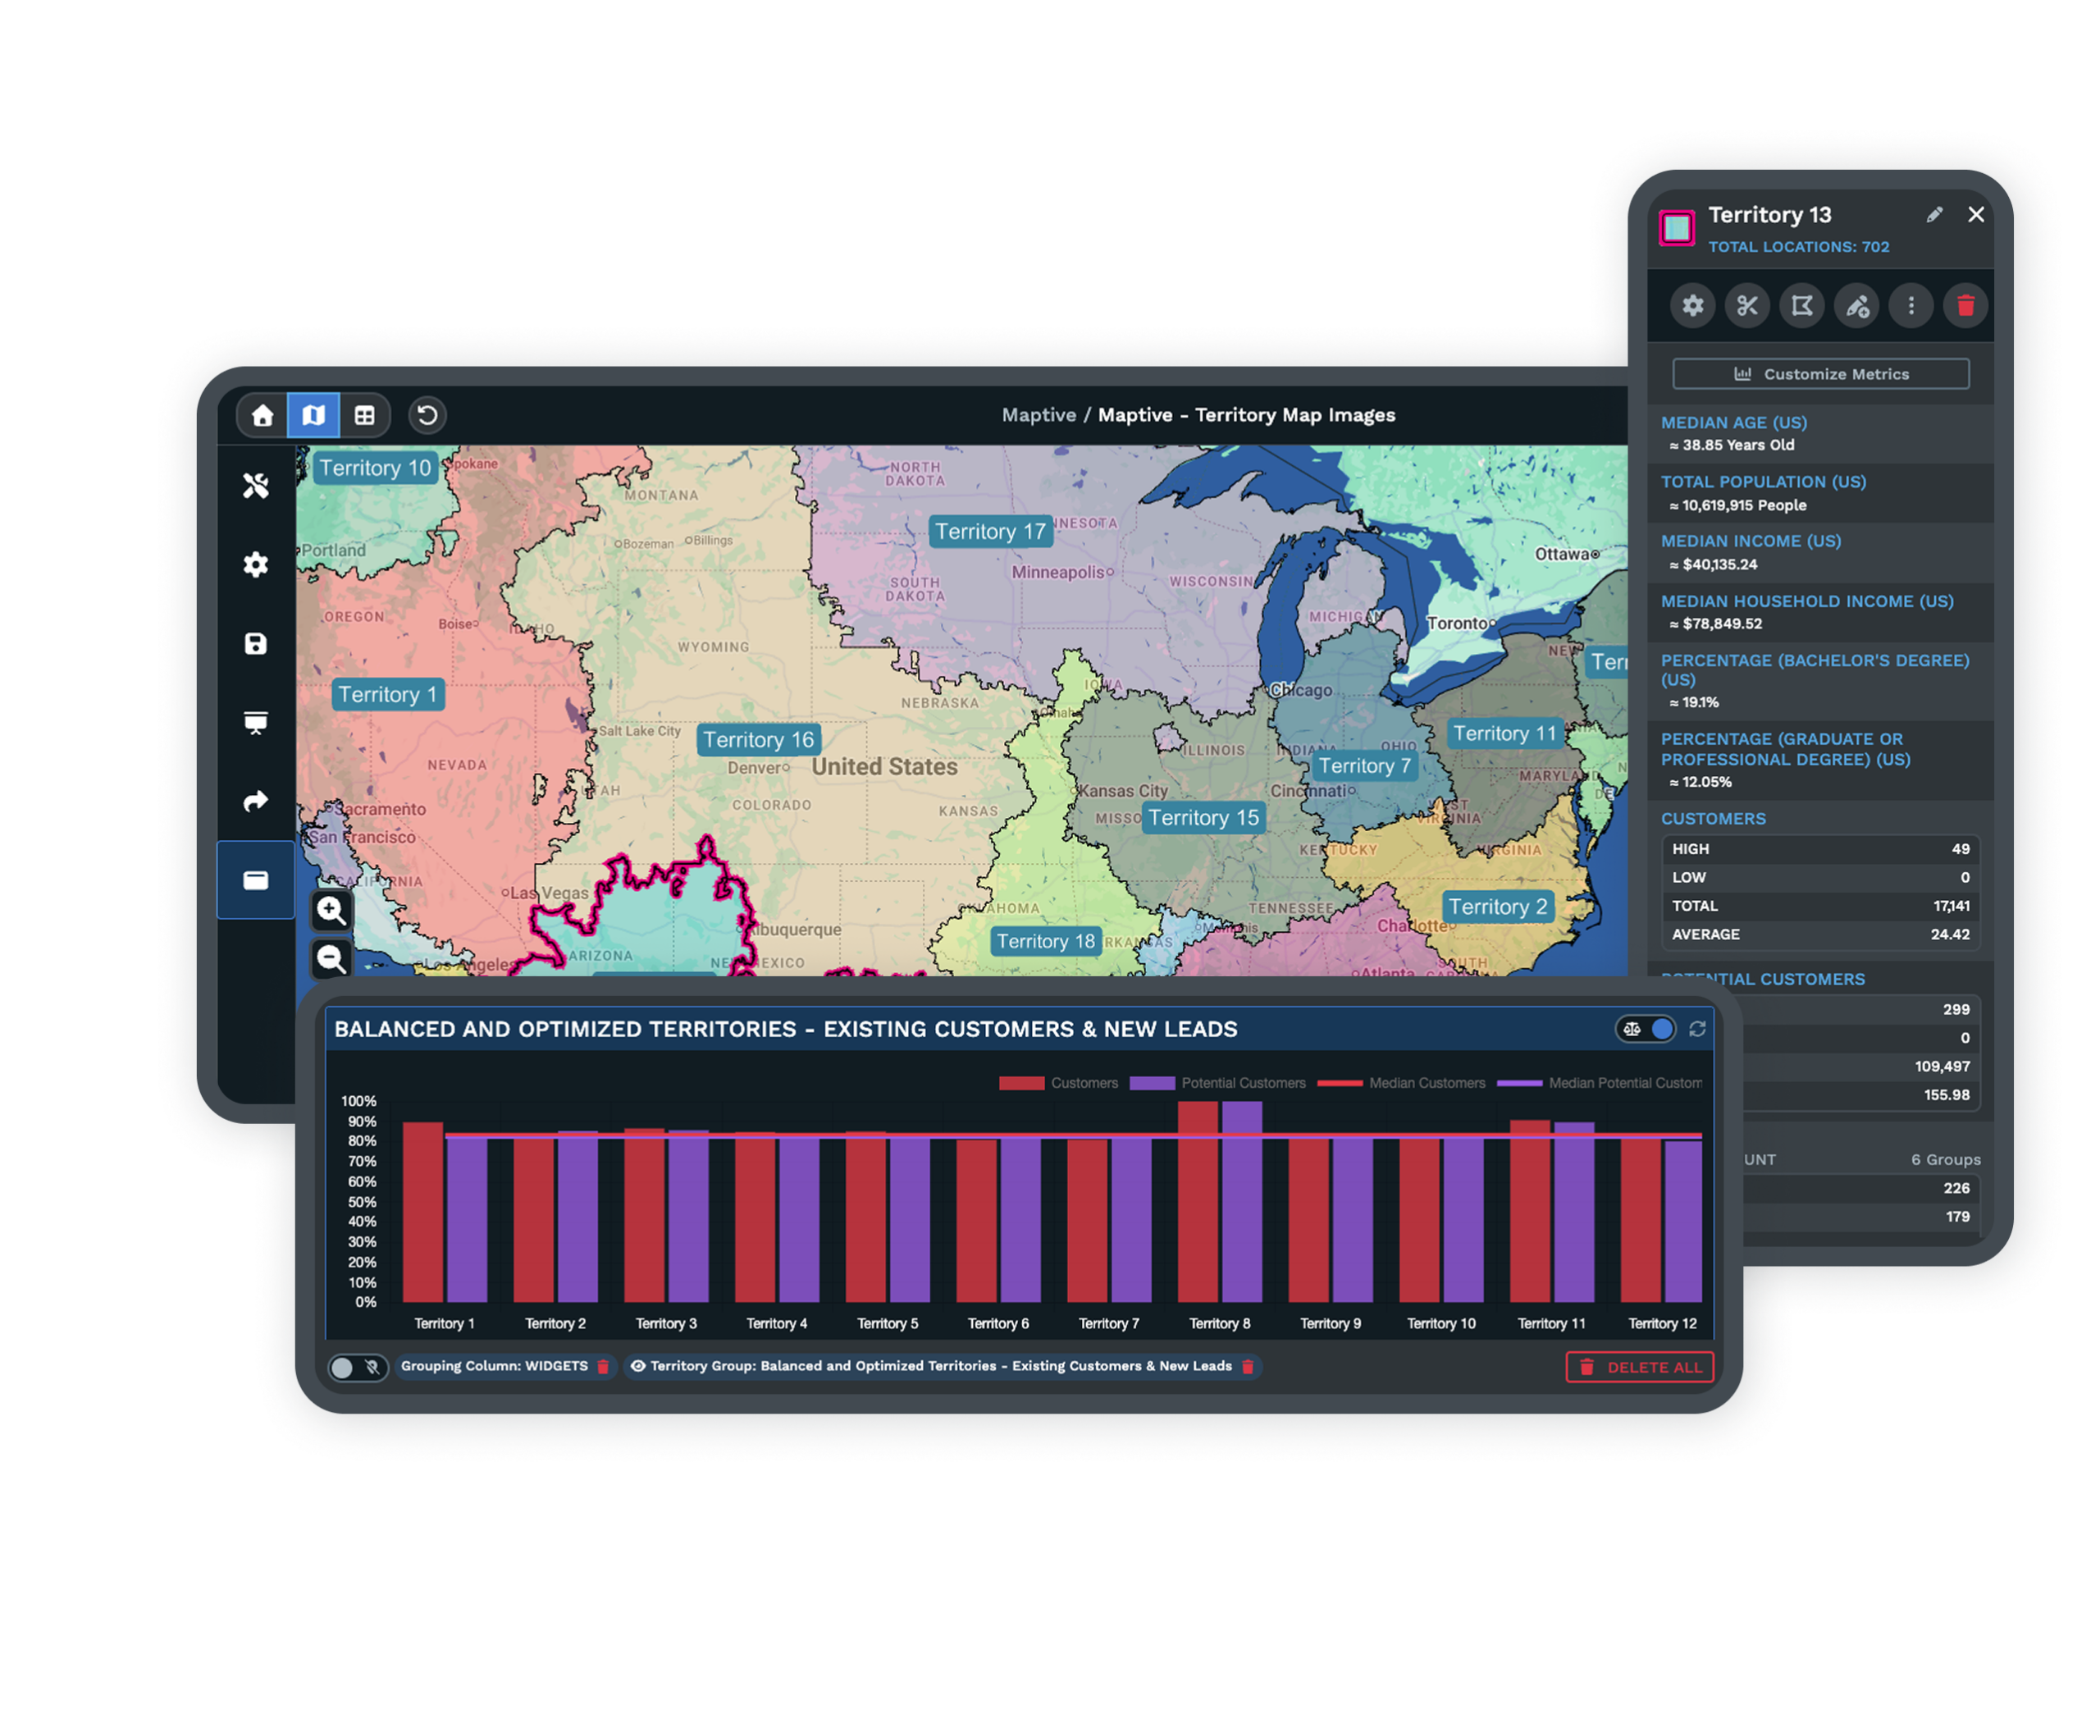
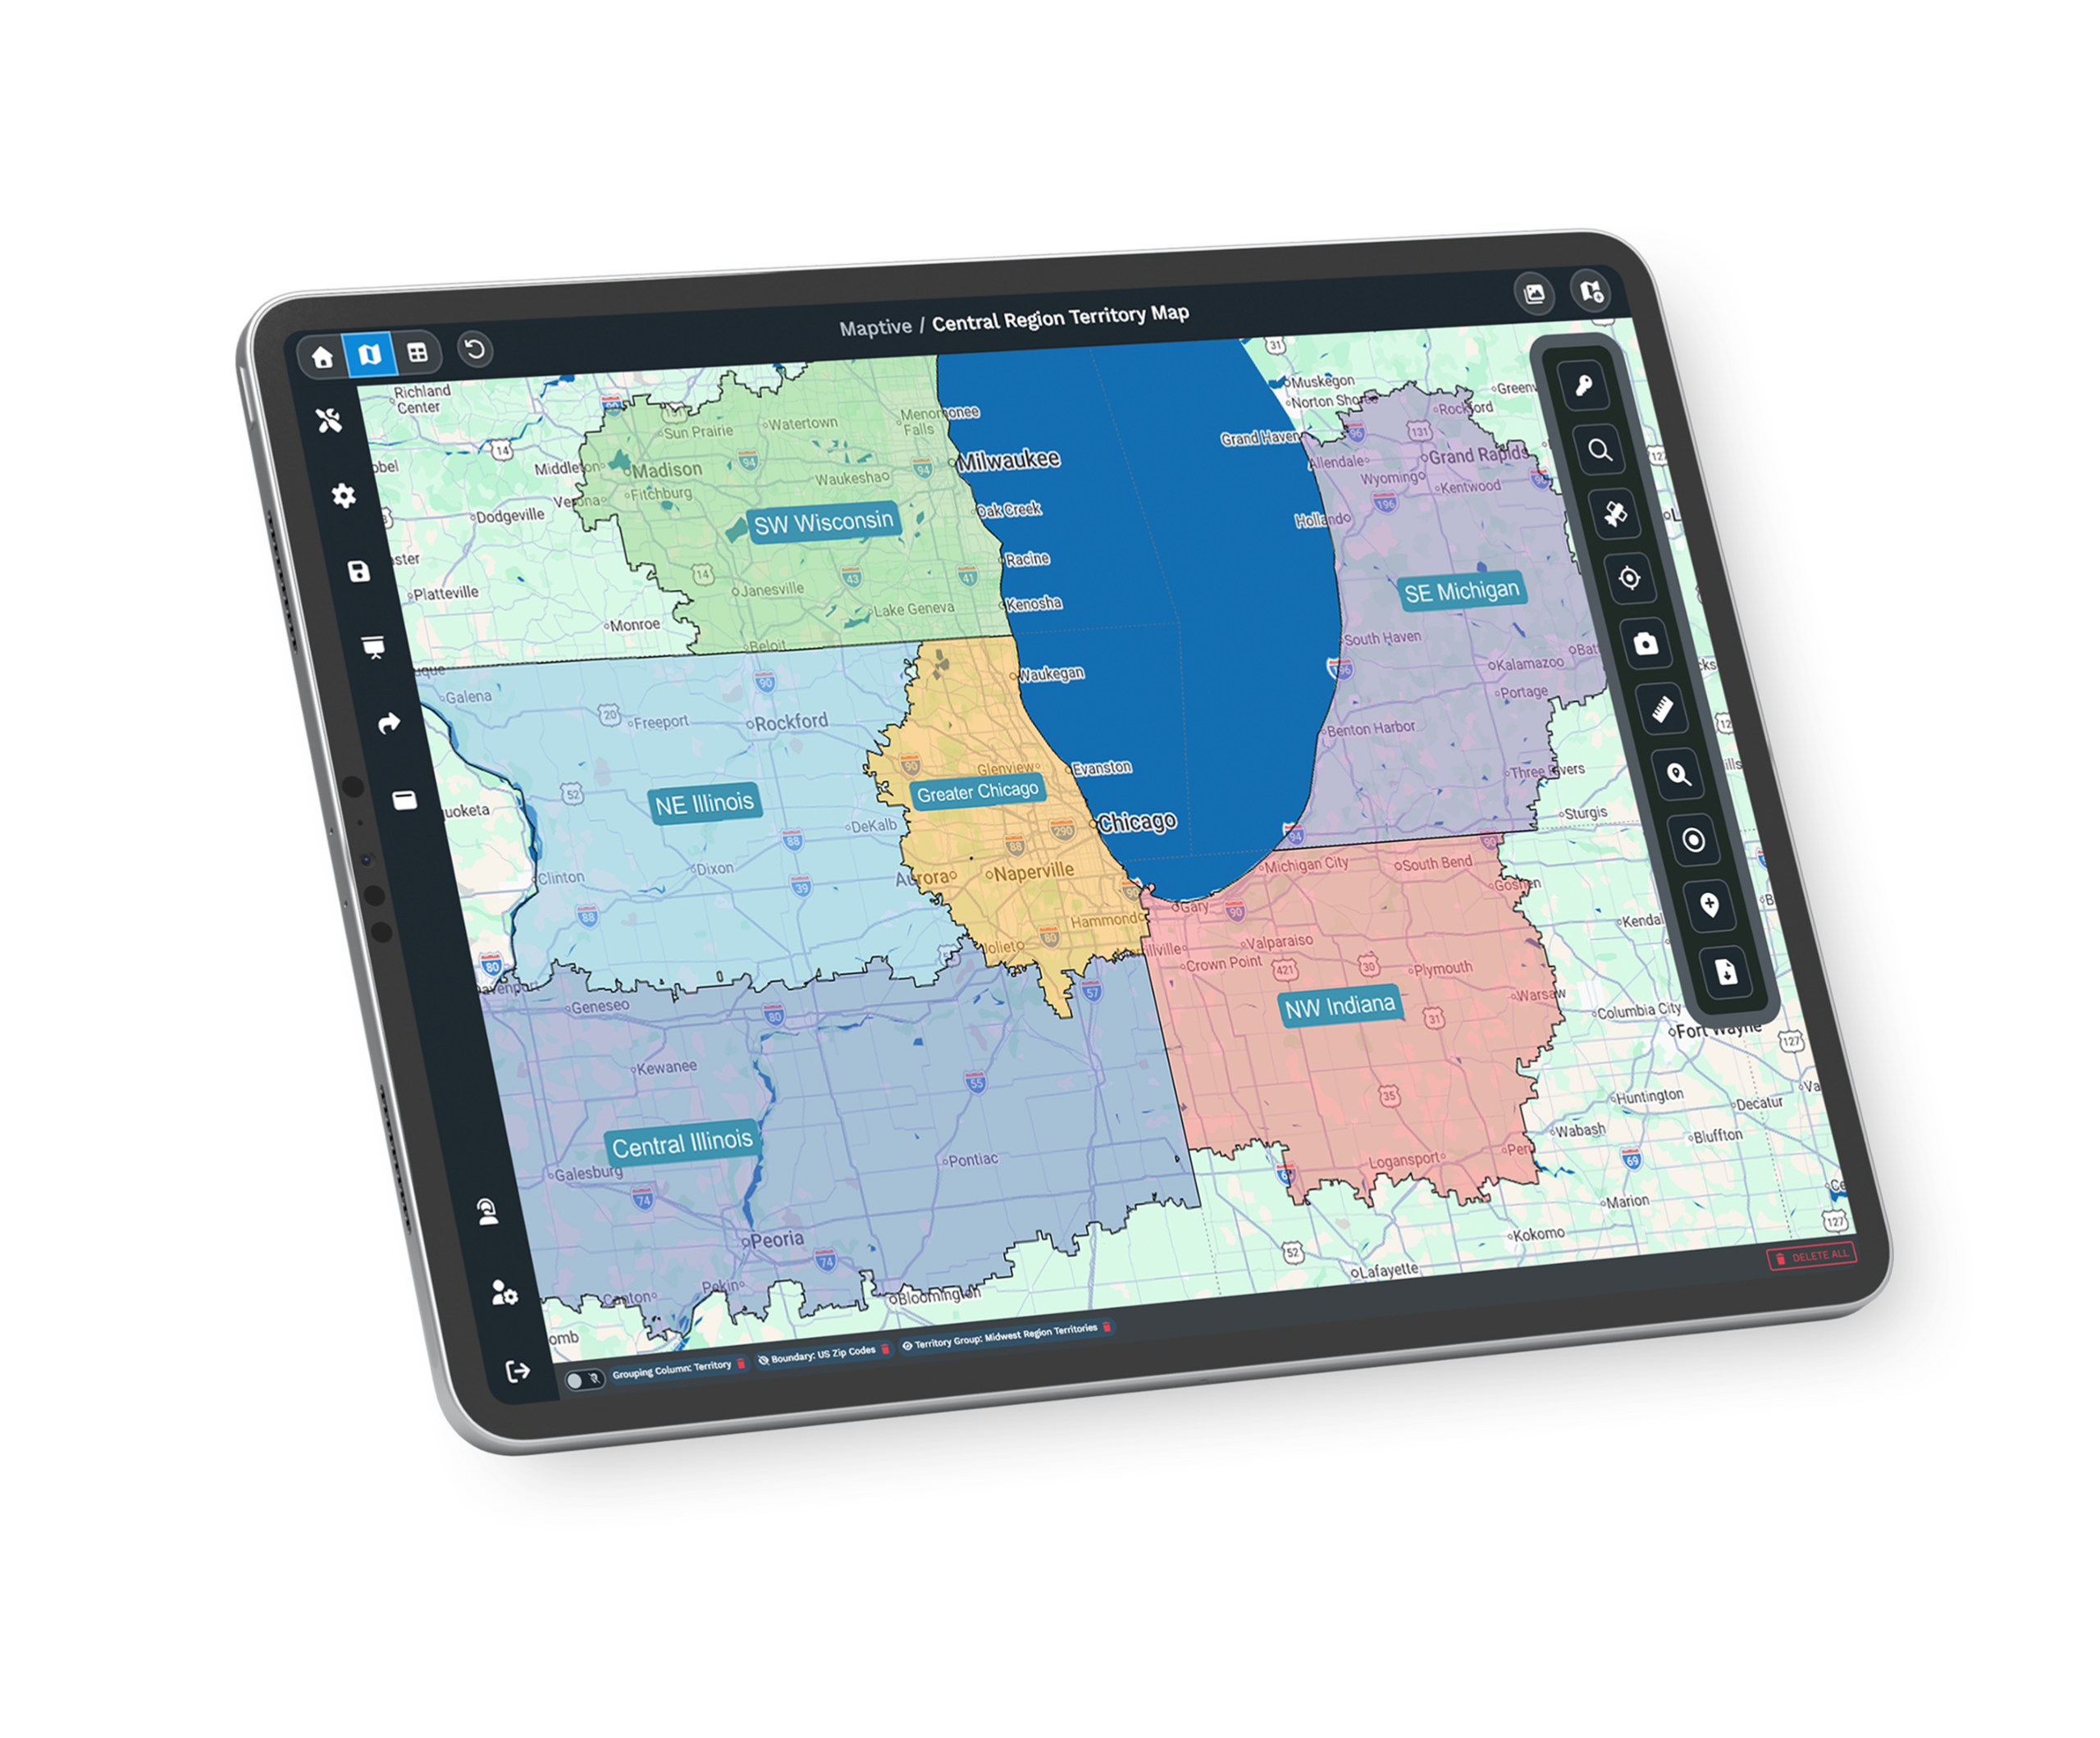
| 02 | Delivery Territory BalancingThe optimizer builds even delivery and service zones from stop density, drive-time limits, and the fields you upload. No route carries twice the load of the one beside it. |
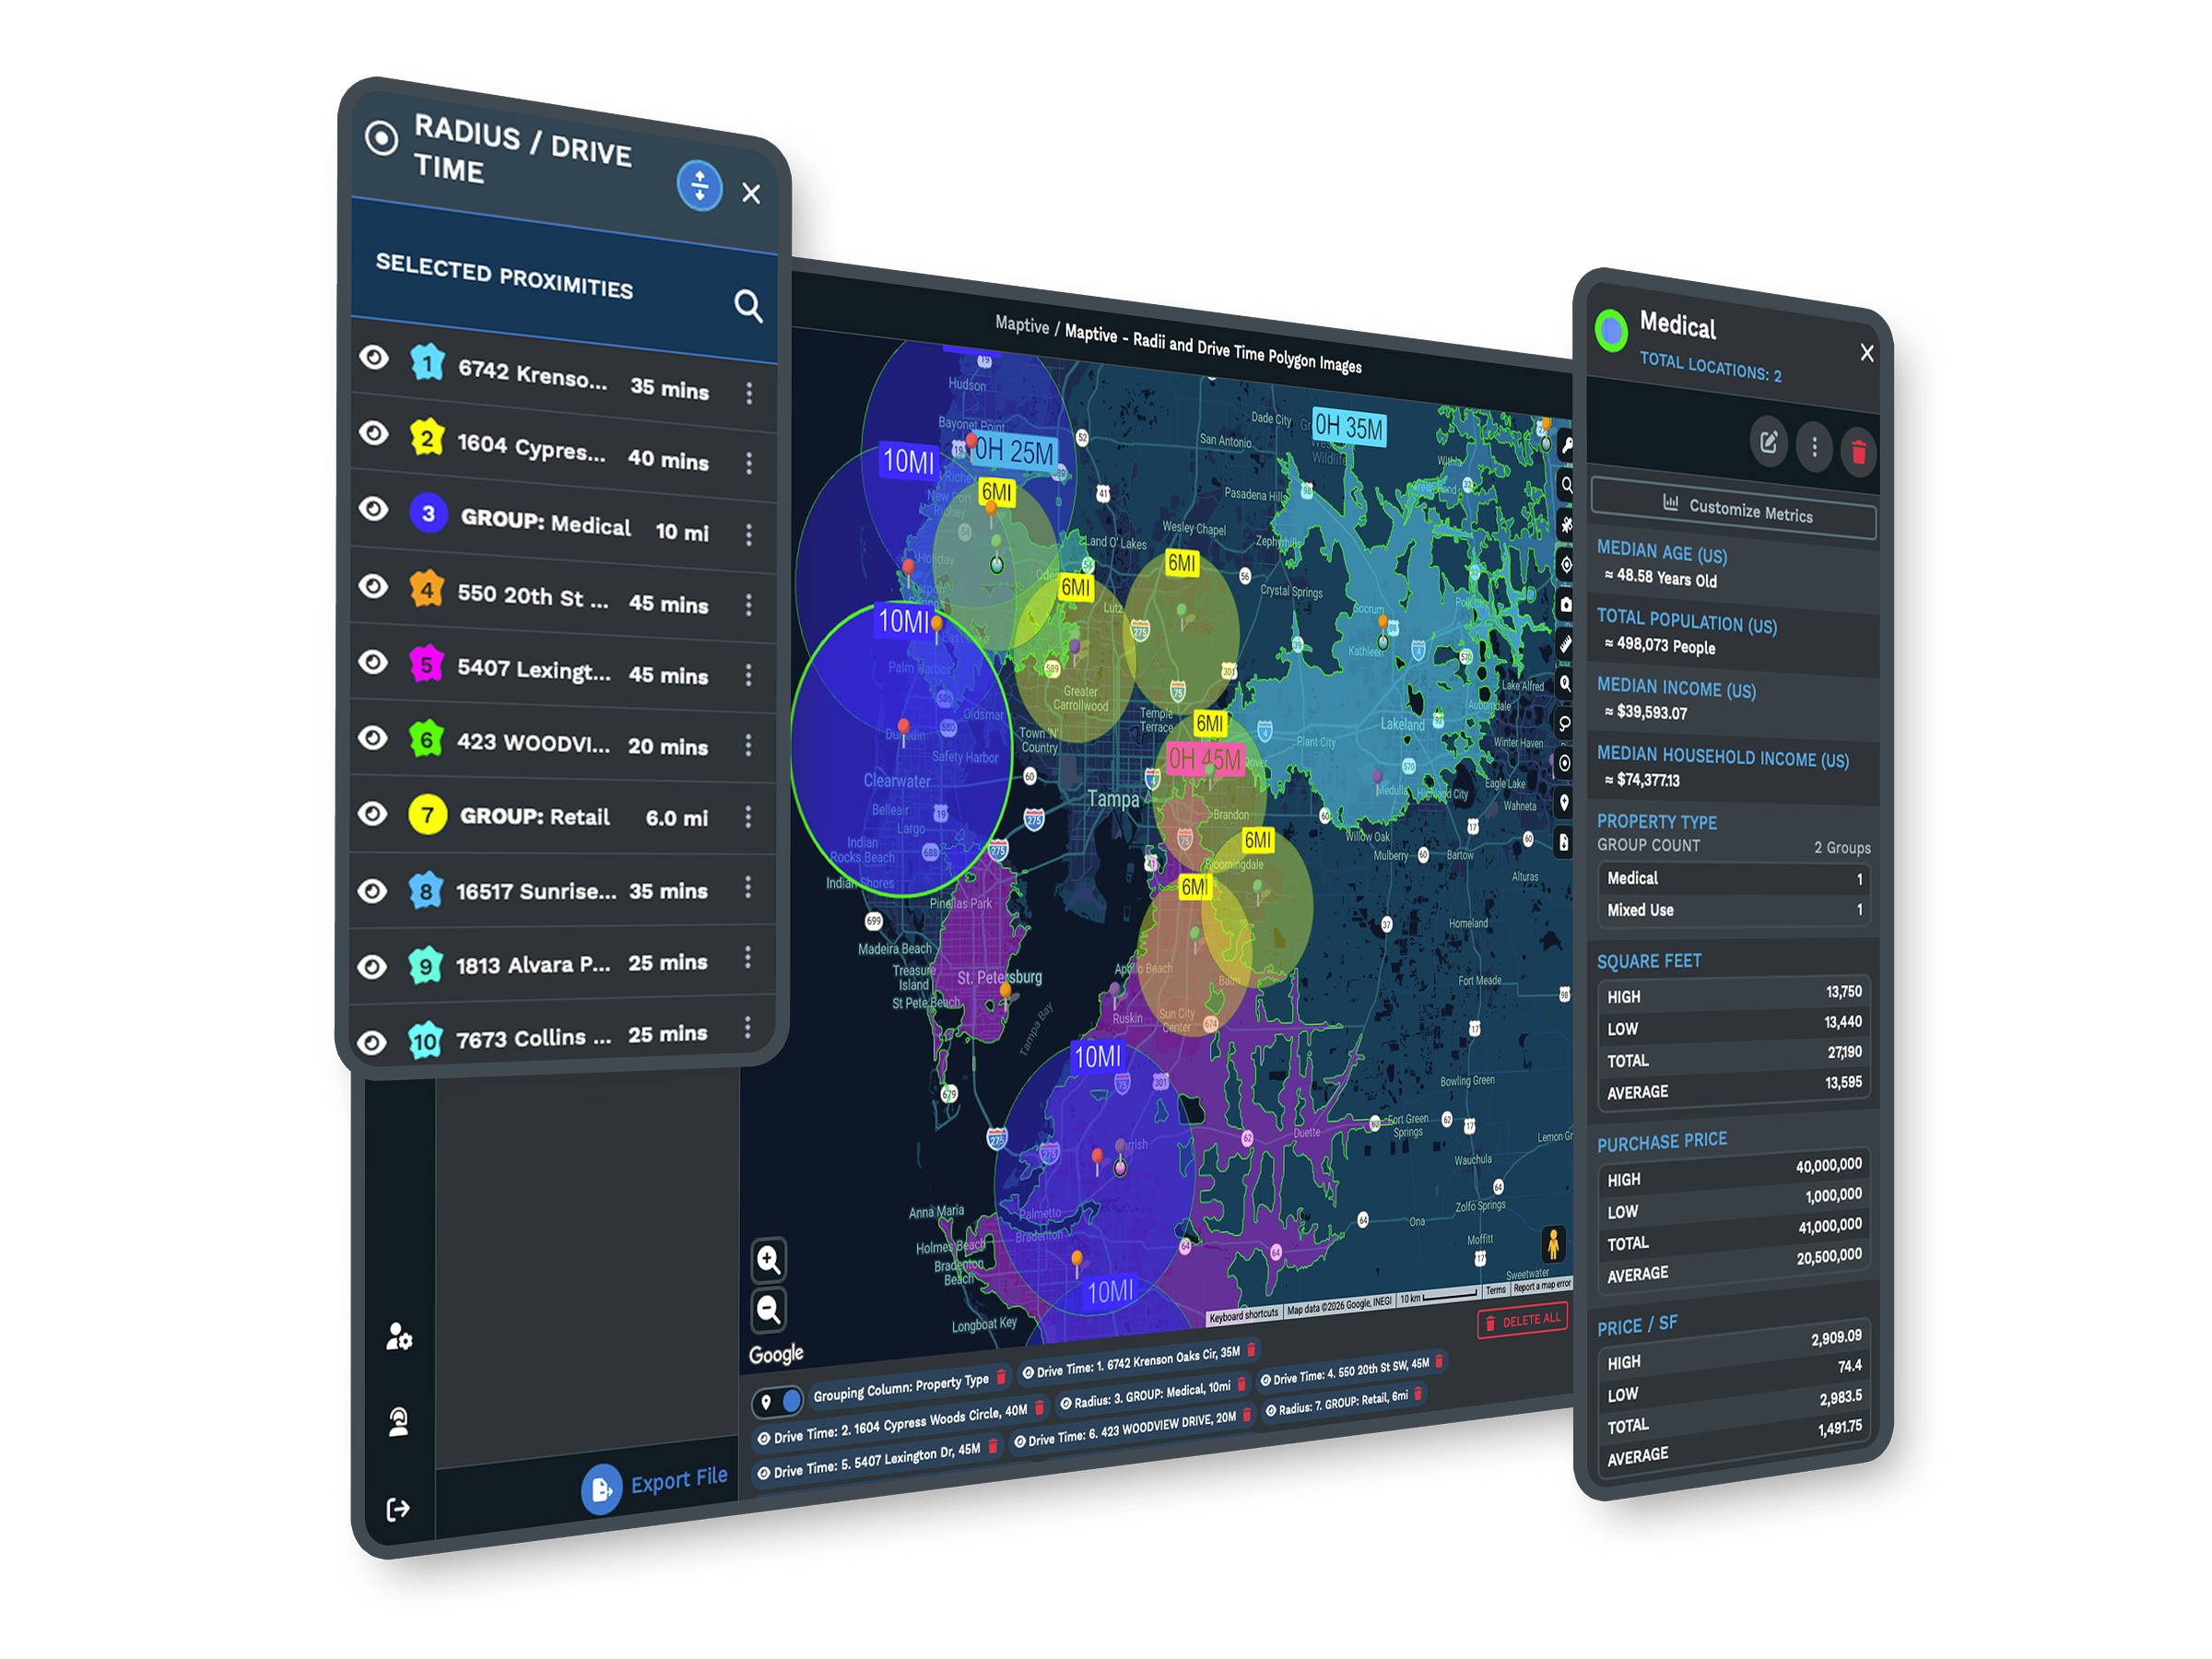
| 03 | Warehouse and Hub SitingDrive-time polygons show how far a candidate distribution point reaches within a service window. Layer demand data underneath to place a hub where it covers the most customers for the fewest miles. |
| 04 | Distance Matrix AnalysisThe distance matrix calculates travel between many origins and destinations at once. You compare facility and routing options across the whole network rather than one pair of points. |
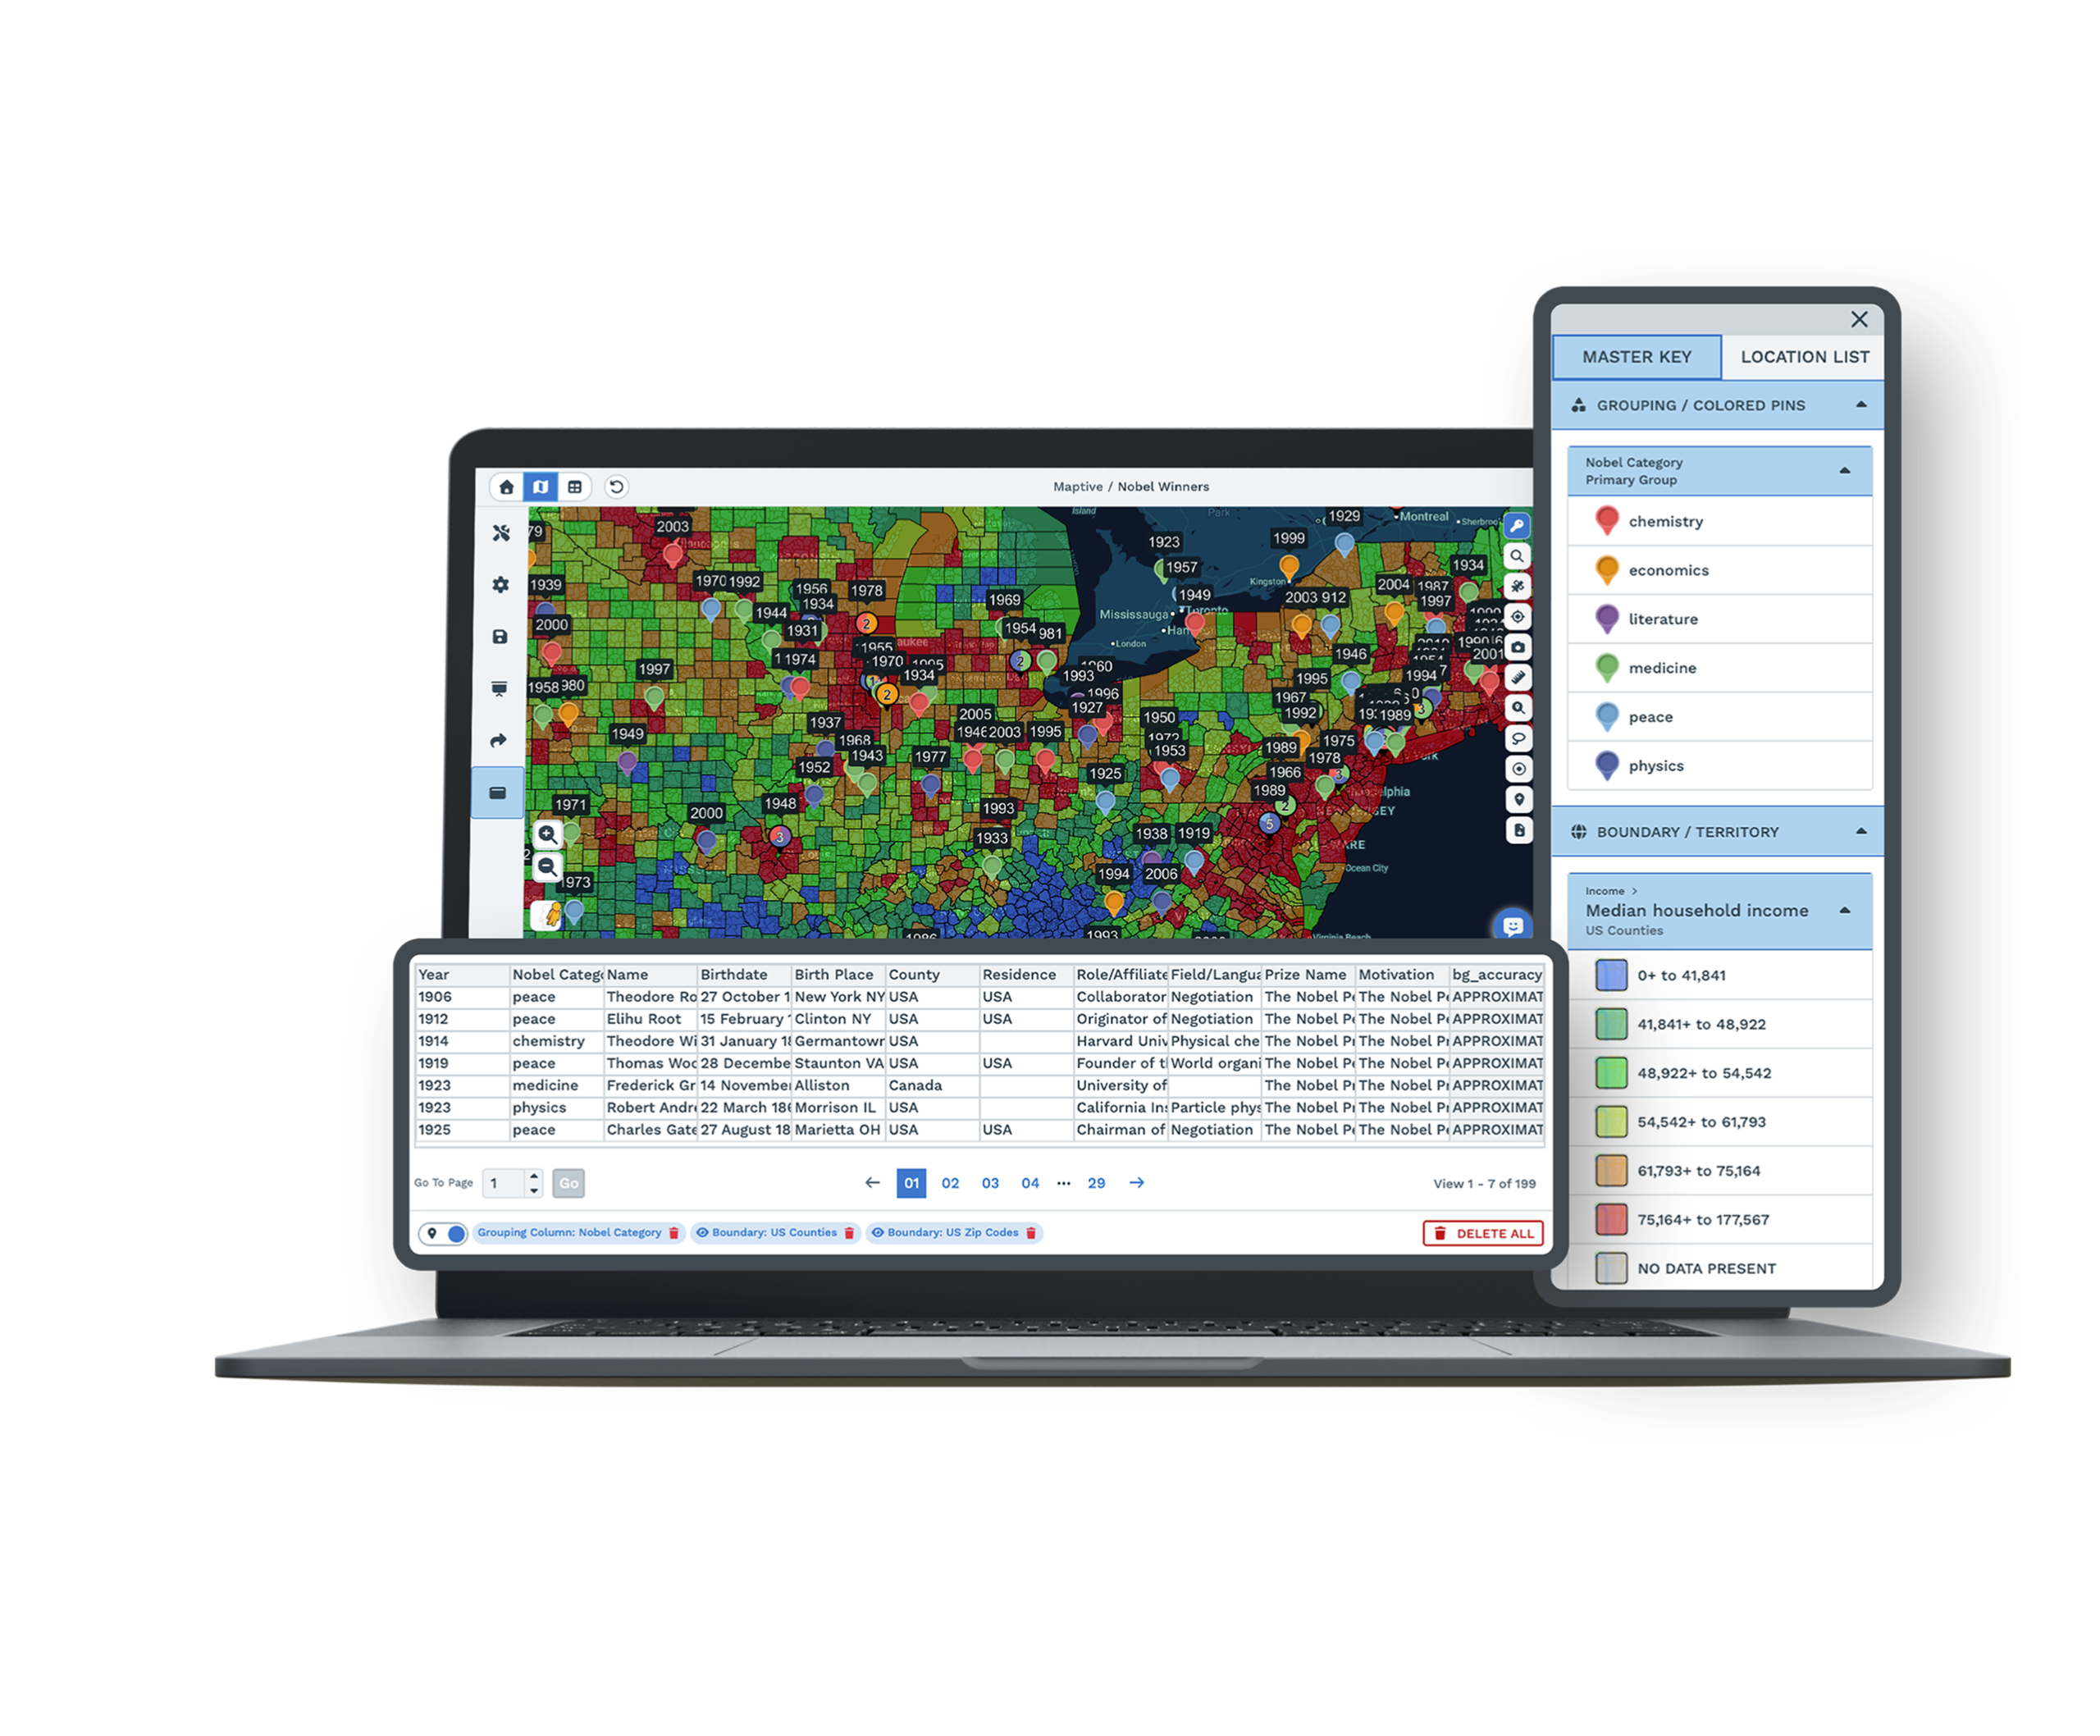
| 05 | Whole-Network MappingUp to 200,000 markers load on a single map, so every depot, vehicle, and delivery point sits on one screen. WebGL rendering holds up as volume grows. |
Beyond the Single Route
From Stop List to Optimized Day
A delivery schedule built in a spreadsheet hides its own waste. The stops are all there, the day looks full, and no one can see the twenty extra miles baked into the order of the visits. Upload the stop and customer file, let the geocoding engine plot it, and the routing engine sequences the day on real road networks. The path a driver follows matches the roads as they are, including the turns and detours a straight line ignores, so the fuel and service gains hold because the plan matches the road.
Designing the Network Behind the Route
Network and territory work has a reputation for taking weeks because the old process earned it. Pulling addresses, mapping them by hand, and balancing the load in a spreadsheet is slow, and it goes stale the moment a customer moves. One nationwide parts distributor compressed two weeks of territory redesign into a single afternoon by running the work on one platform. The speed comes from keeping the data, the map, and the analysis together, so a change happens on the map and its effect on cost and coverage is visible before anything is published.
Built for Around-the-Clock Operations
Logistics Brands on Maptive
Amazon, Frito-Lay, Volvo, and Bridgestone run logistics and location work on the platform, each after its own security review. A regional fleet and a national network use the same tools, with capacity to scale as volume grows.
Uptime and Security for Operations
Maptive includes 256-bit SSL encryption, two-factor authentication, single sign-on, role-based access, and audit logging, with 99.9% uptime and no major outage recorded in 2025. It runs on Google Maps Platform infrastructure, so a national network stays responsive on one map.
Support That Knows Logistics
The support team works from the US and Canada, answers in under 15 minutes at a 9.7 out of 10 rating, and helps clean your stop file and set up your first map. The specialists understand routing and territory work, so the help is specific.
Free trial, full platform, no credit card
Optimize a Route This Afternoon
Run a ten-day free trial, no credit card required. Upload your stops, depots, and customers, optimize a multi-stop route, and draw a drive-time polygon around a candidate hub. Every routing and territory tool is unlocked from the first login, so you can test a real plan against your own data.
Run Your Routes With a Specialist
For operations teams that evaluate tools through a formal process, a Maptive specialist will run routing, territory, and facility analysis on your own stops and depots. This suits teams comparing platforms or needing sign-off before a trial. Bring a route or a facility question, and the session works through your network rather than a sample one.
Frequently Asked Questions
What is route optimization software?
Route optimization software works out the most efficient order of stops for a trip, rather than drawing a straight line between them. Maptive sequences up to 73 stops per route on real road networks to minimize travel time, then exports turn-by-turn directions to a driver's phone. Logistics and delivery teams use it to cut mileage, fit more stops into a day, and give drivers routes they can follow, all from a stop list they upload as a spreadsheet.
How does route optimization work?
You upload a list of stops, and Maptive geocodes each address onto the map. The routing engine then calculates the sequence that minimizes total travel time across the trip, holding the start and end points where you set them and ordering everything in between. The result follows real roads, not straight lines, so it follows how a vehicle drives. You can drag a stop to override the order, and the route and distances recalculate immediately.
How many stops can Maptive route at once?
Up to 73 stops per trip. The engine sequences them to minimize travel time on real road networks, and turn-by-turn directions export to a driver's phone or navigation app. For larger operations, you build multiple routes and color-code them on one map, so a fleet's worth of trips is visible together. Drag any stop to adjust the order, and the path and travel times update in place, which makes last-minute changes quick rather than a full replan.
What is a distance matrix, and why is it used in logistics?
A distance matrix calculates travel time or distance between many origins and destinations at once, producing a table rather than a single route. In logistics, that is the groundwork for comparing options. Examples include which depot is closest to a cluster of customers, how facilities stack up against demand, or how to assign stops between vehicles. Maptive's distance matrix weighs those choices across the whole network at once, instead of checking one pair of points at a time.
How much can route optimization save on fuel?
Teams using Maptive report fuel costs down 18% and 22% more service calls completed, with some fleets cutting more than $100,000 in fuel quarterly. The savings come from two places, sequencing each route on real roads to remove wasted miles and balancing load across routes so no vehicle runs a lopsided day. Because the gains repeat on every trip, the effect compounds across a quarter, which is why the fuel line is usually where the impact shows up first.
Can Maptive help plan a distribution network or warehouse location?
Yes. Draw drive-time polygons around a candidate warehouse or hub to see how far it reaches within a service window, then layer demand data underneath to find where a site covers the most customers for the fewest miles. The distance matrix compares facility options across the network at once. Together these turn a facility decision, which usually rests on intuition and a rough map, into a measured comparison of reach and cost before a lease or build is committed.
What is a drive-time polygon, and how does it help facility planning?
A drive-time polygon, or isochrone, maps the area reachable from a point within a set number of minutes along real roads. For facility planning, it answers the question that matters. It shows how much of your demand a warehouse or hub can serve inside a delivery window. Maptive draws these around candidate sites, and overlaying demand data inside them shows coverage and gaps, so you place distribution where it shortens routes.
Can Maptive balance delivery territories?
Yes. The automated optimizer builds even delivery and service zones from stop density, drive-time limits, and the data fields you upload, so no route carries twice the load of the one beside it. When volume shifts or you add a driver, the zones recalculate against current data, and you can preview the change before publishing it. Balanced zones keep overtime predictable and service windows realistic, which matters as much to a logistics operation as the routing inside each zone.
How large a network can one map handle?
A single Maptive map holds up to 200,000 markers, rendered with WebGL so the view stays responsive. Every depot, vehicle, and delivery point loads together rather than across regional files, which is what lets you plan and balance at the network level instead of region by region. That capacity also supports the distance-matrix and territory tools, since comparing facilities or evening out zones only works when the whole network sits on one screen at the same time.
Do I need GIS training to plan routes and territories?
No. Maptive is built for operations and logistics teams, not GIS specialists. You upload a spreadsheet of stops or customers, the platform geocodes it, and the routing, territory, and distance tools work through a plain interface. Most teams build a usable route or zone plan in their first session, and support is on hand to set up the first map. The aim is to put network planning in the hands of the people running the operation.

