Bubble Maps
Size every marker on the map by a number column so the biggest value reads as the biggest circle. Pick a range count, edit the buckets, and Maptive draws a value-coded view.
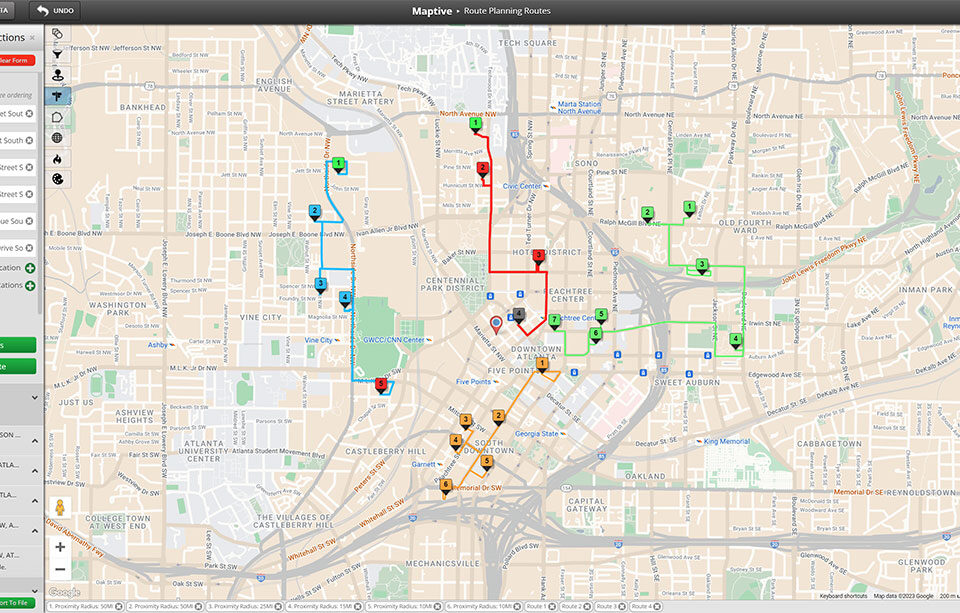
Bubble Maps Sized by Real Value
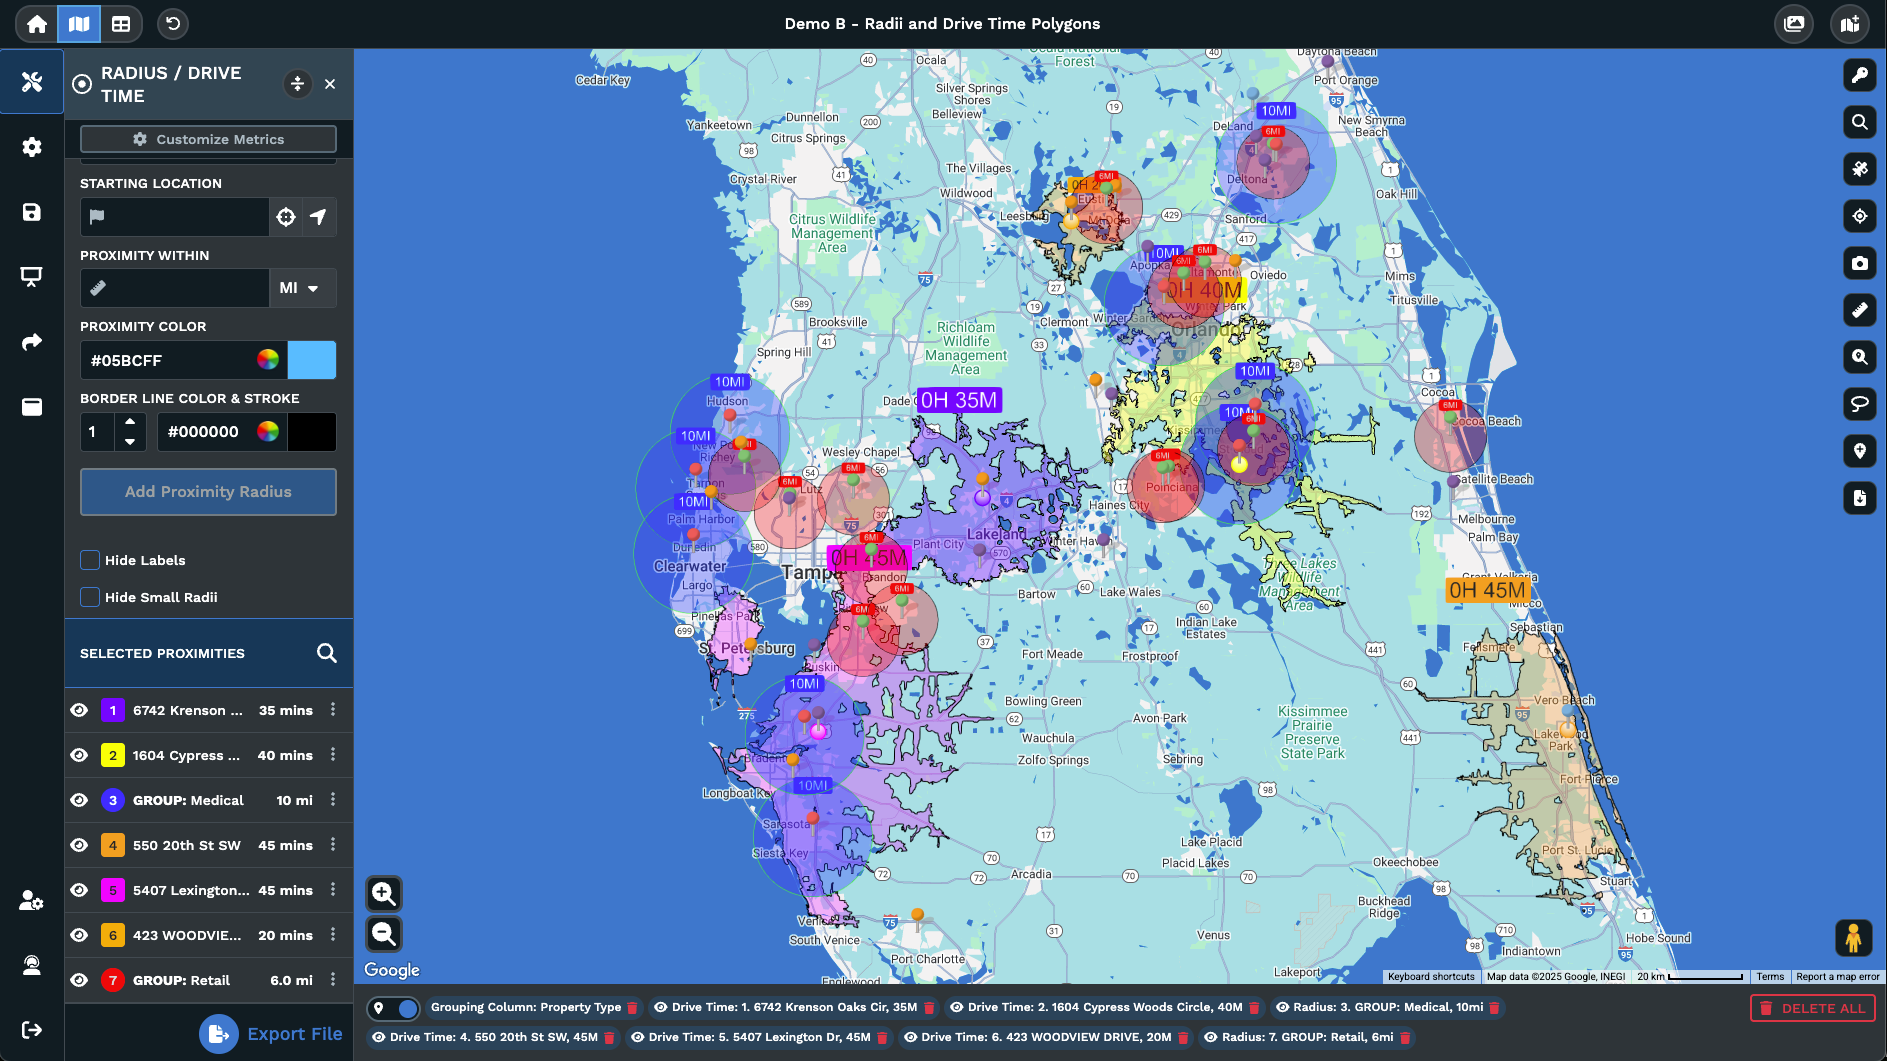
Primary Group dropdown: Pick the column you want bubbles to scale by. Sales, headcount, or any number column on the file maps to a set of size ranges drawn at each pin.
Numeric column type: Switch the chosen column from text to Numeric so range buckets replace category sets. This option works once a column holds over 500 distinct values.
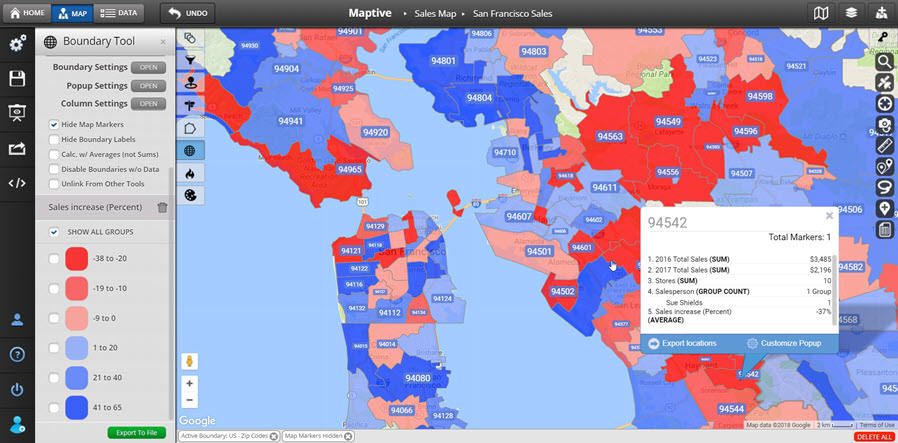
Range and bucket controls: Set how many groups you want, then pick between percentages or number ranges. Edit the lower and upper bounds for each bucket so the breaks fit.
Blue bubble markers: Use the standard option for a single color on the map with size doing the read. The bubbles grow with the bucket so the biggest values pull the eye.
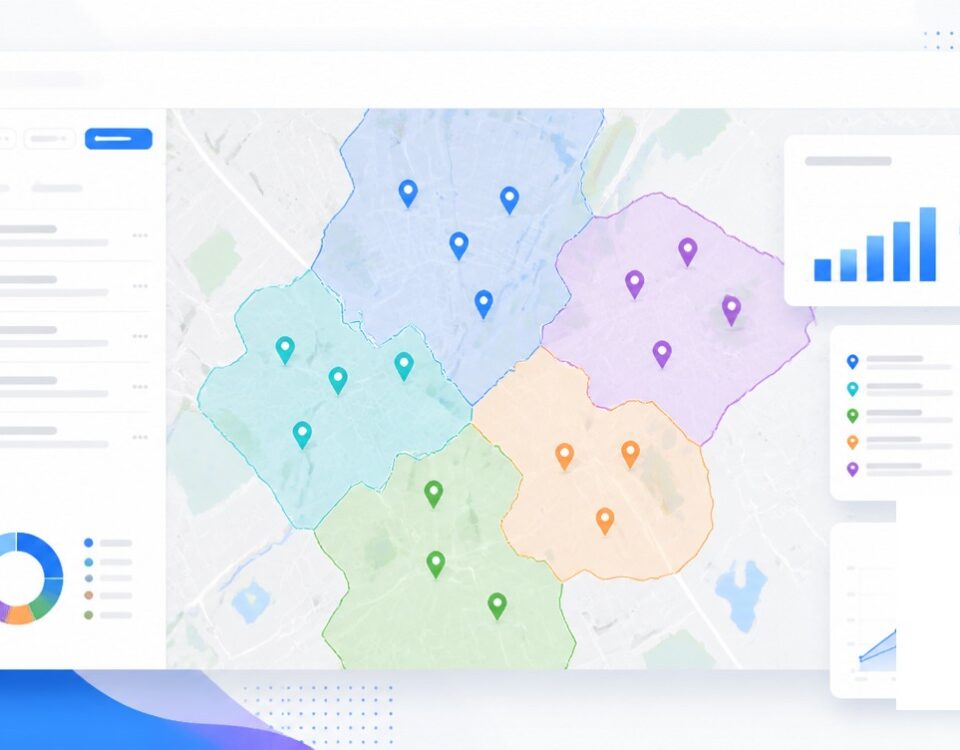
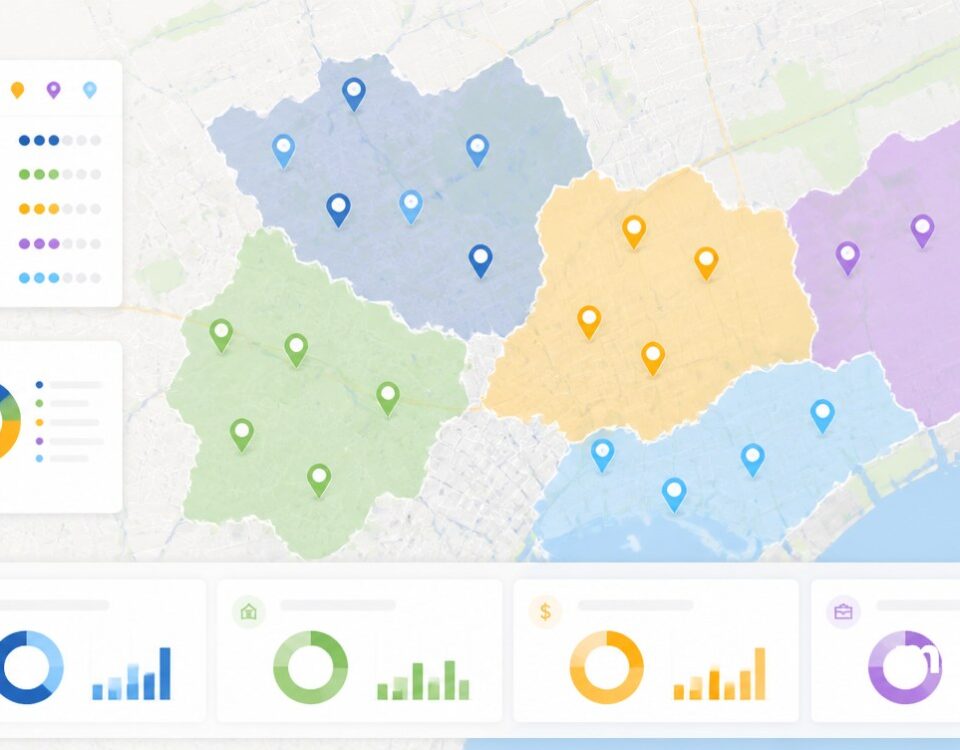
Multi color bubbles: Pick this option when you want bubble size to read alongside a per-range fill color. Each range gets its own fill, so the map carries 2 reads at once.
Growing pin markers: Pick a pin marker that scales by range when a pin reads better than a circle. The marker grows with the bucket and stays anchored at the row location.
Build Bubble Maps in 3 Steps
1
Open
Open Map Tools and click the Grouping Tool / Colored Pins Tool, which brings the Primary Group dropdown onto the map.
2
Pick
Pick a number column, switch the column type to Numeric, set the bucket count, then pick a Blue or Multi color bubble.
3
Group
Click Group Now and the map redraws with sized bubbles per range, keyed in the legend so every viewer reads the bands.
Biggest Values First
Volume by Region
Performance Across Sites
Size and Category
Capacity by Hub
Attendance by Venue
Reading Bubble Maps by Value
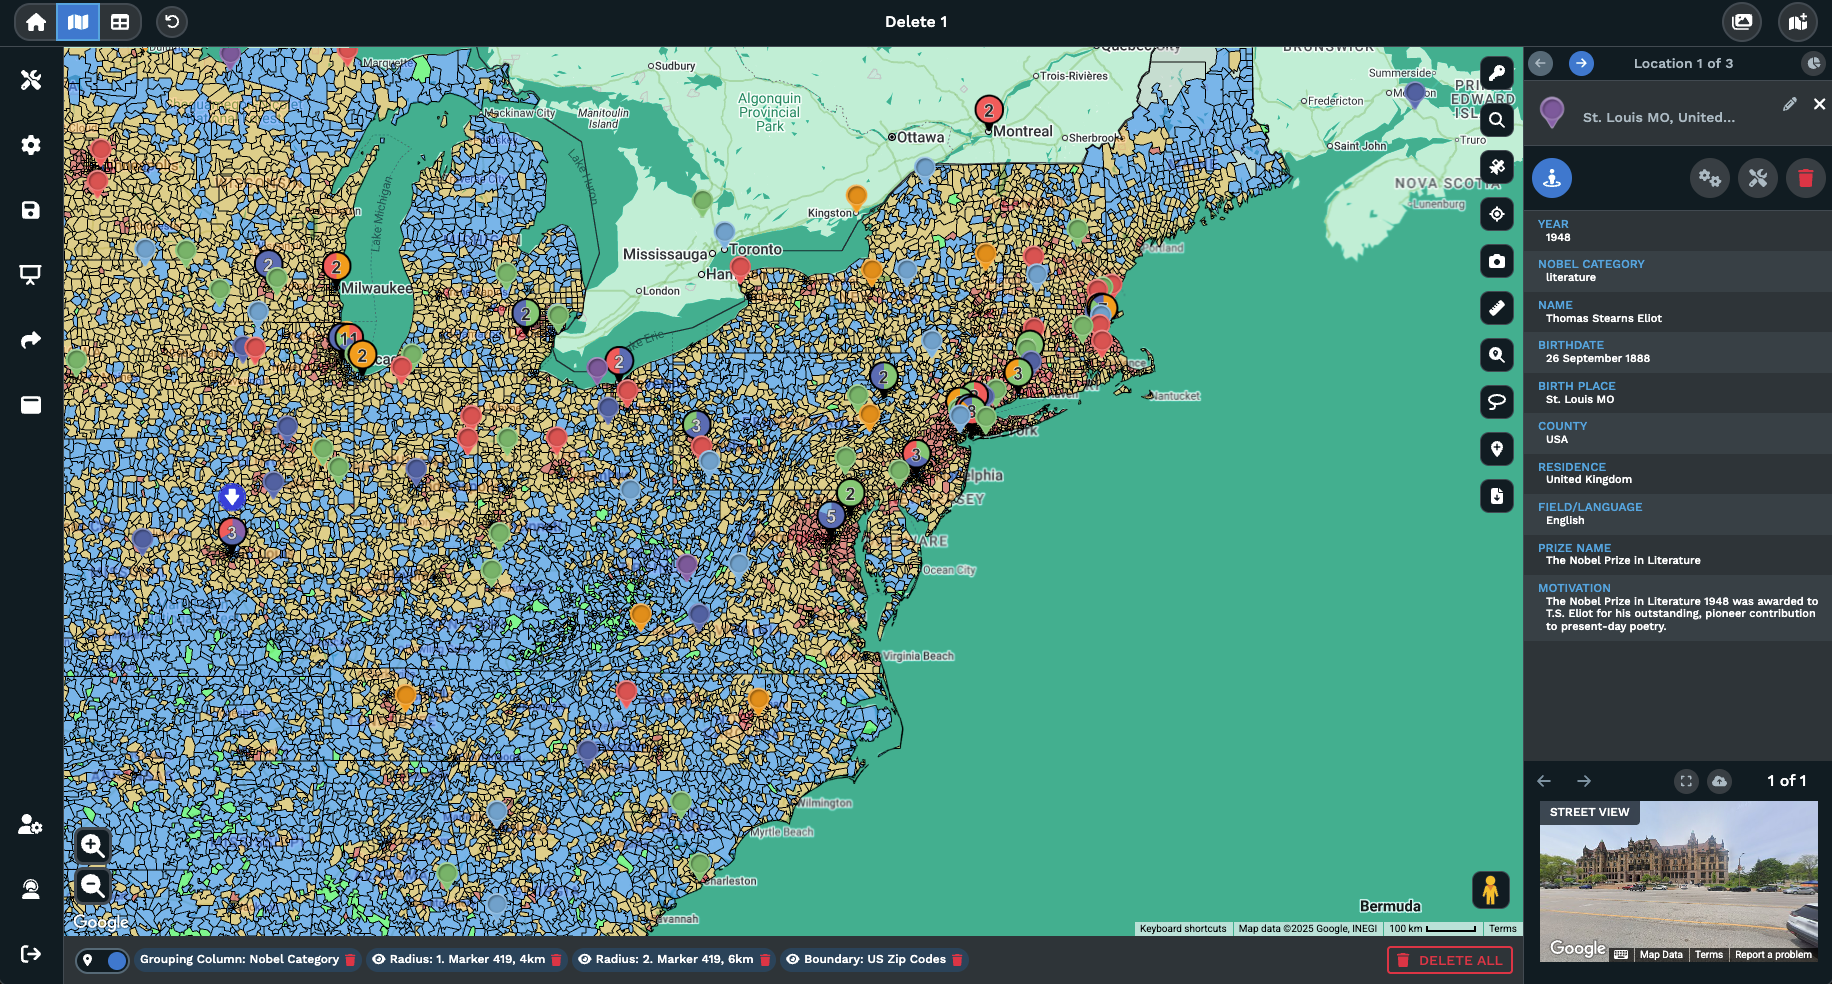
What Sized Markers Show
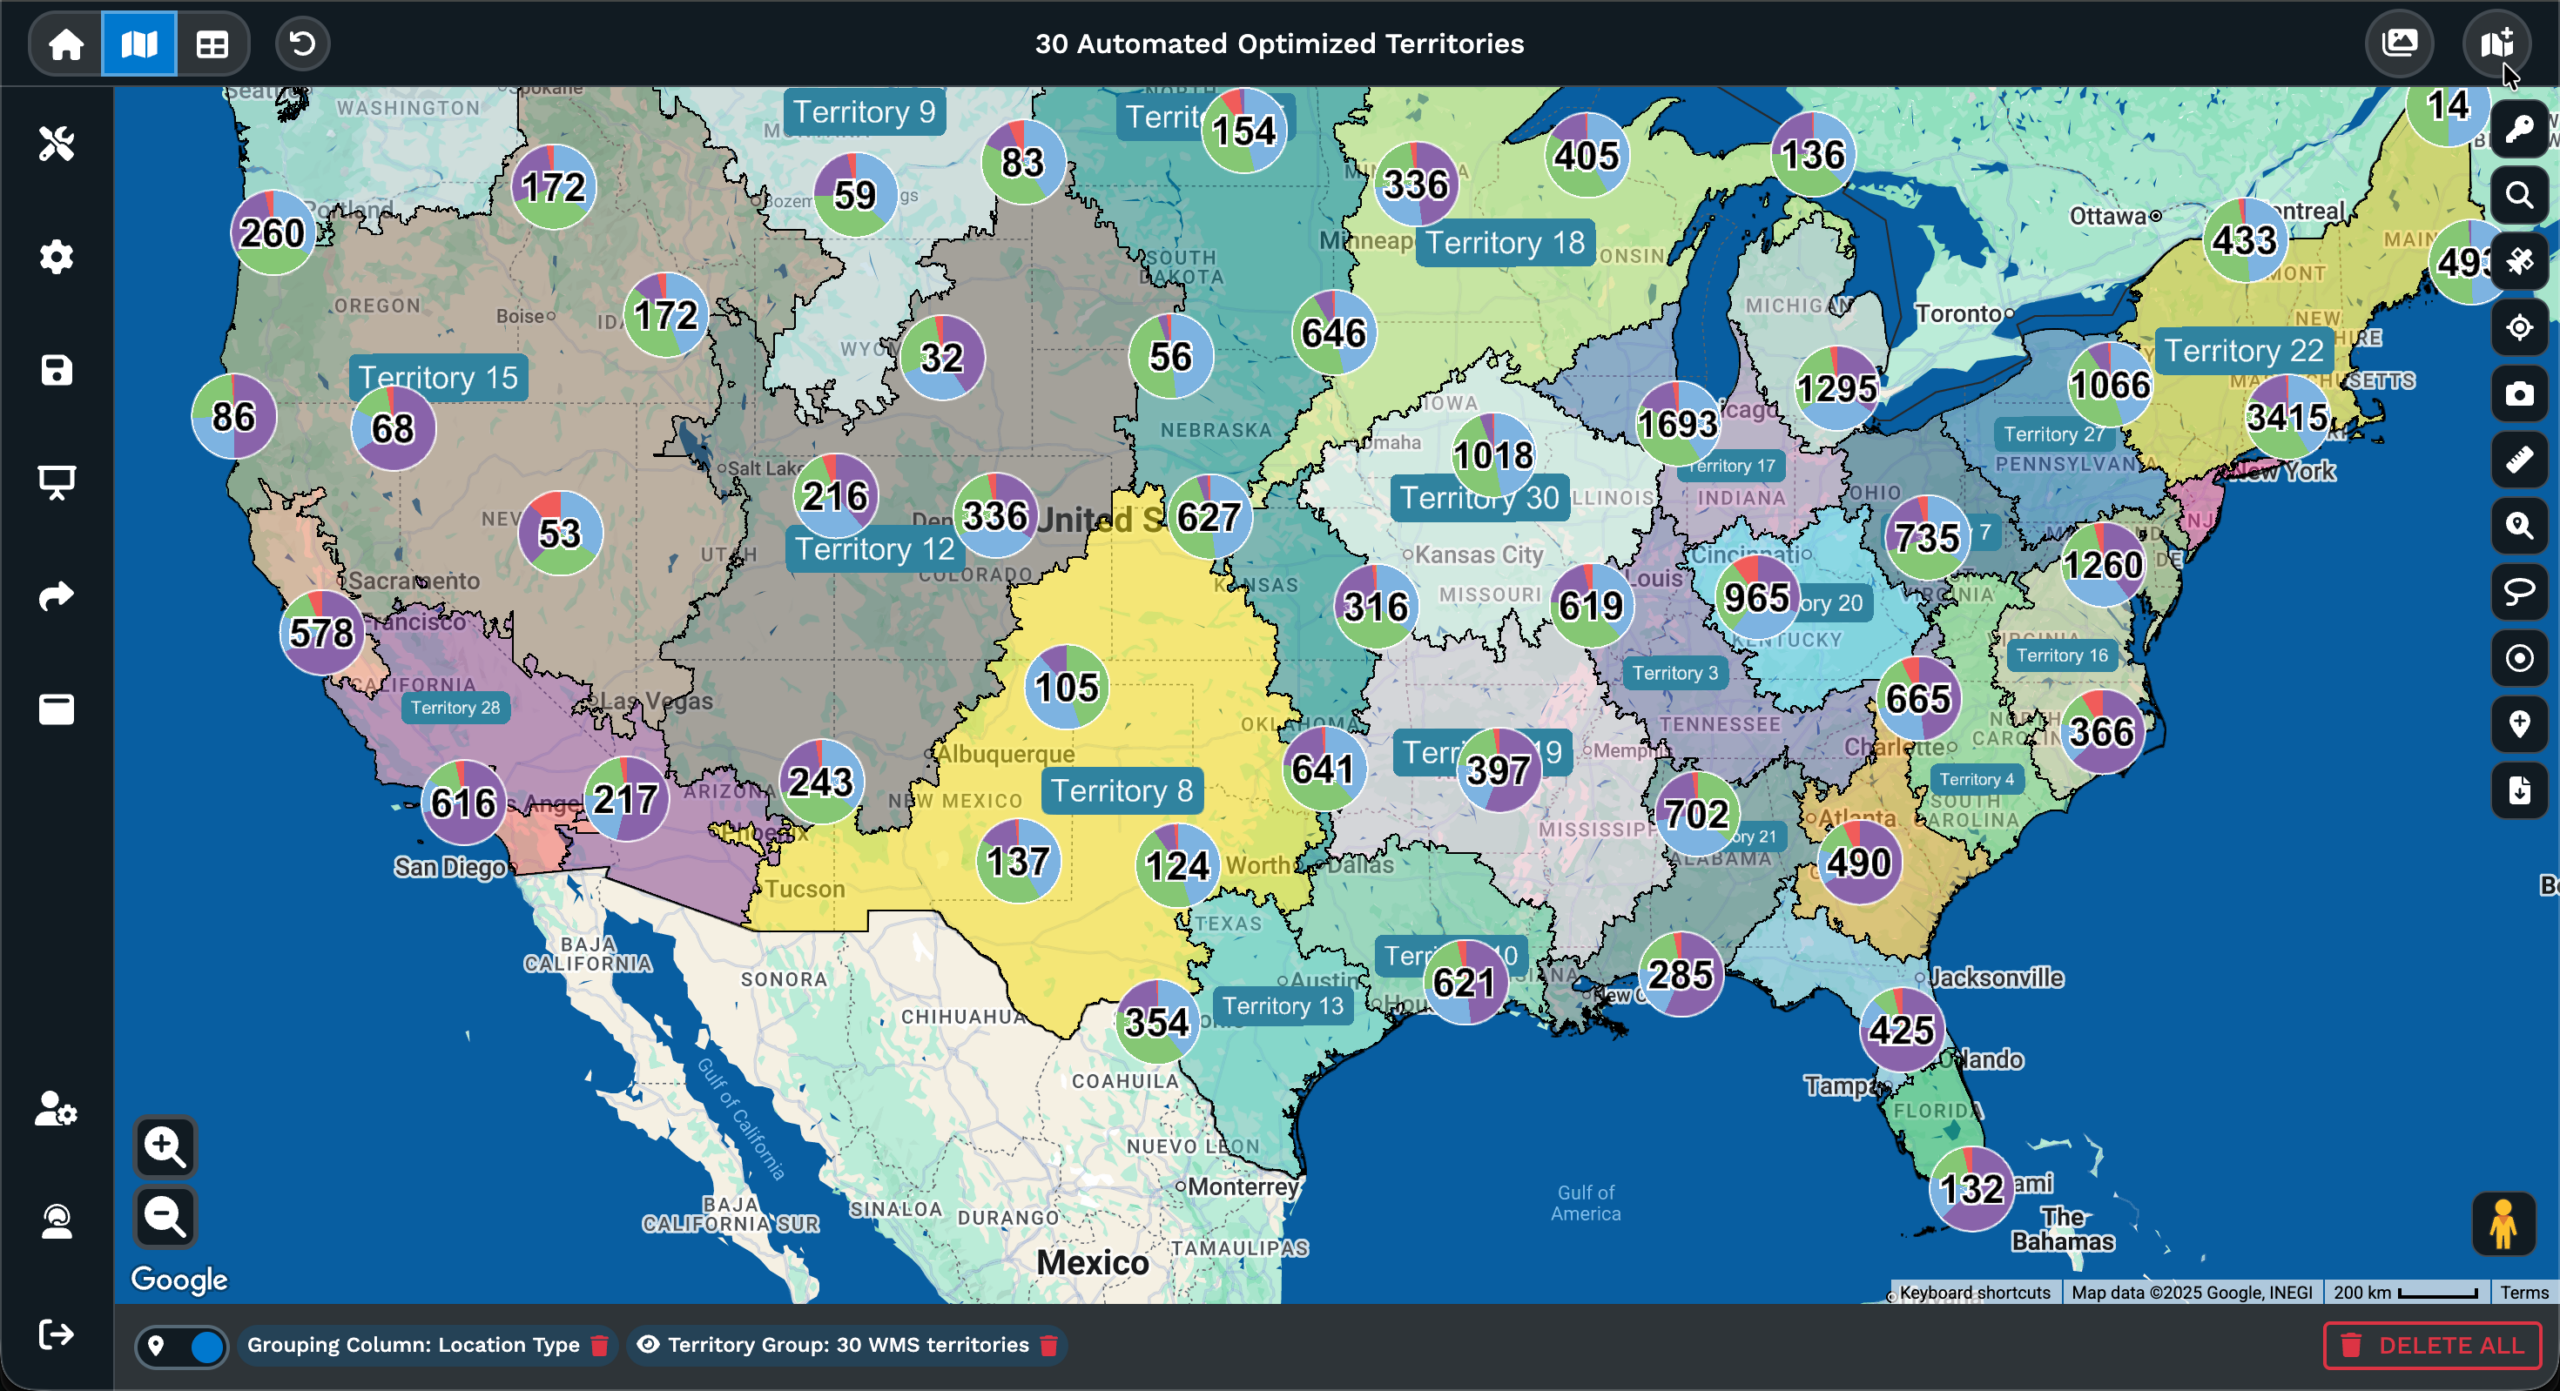
A sized marker map turns a column of numbers into circles where size carries the value. The pin still sits at the exact row location, but the circle drawn around or beneath the pin scales with the range bucket the row falls into. Reading the map by circle size is faster than scanning rows for the biggest values, and the legend shows the range bands so any viewer can match a bubble to a number band.
The Grouping Tool inside Maptive supports 3 marker options when the chosen column is set to Numeric. Blue bubble markers use 1 color across the map with size as the read. Multi color bubbles add a per-range fill color so size and category sit on the same circle. Growing pin markers swap the circle for a pin marker that grows with the bucket. The marker option is picked inside the popup that loads after Numeric is selected.
The bucket setup runs inside the same popup. The number of groups, the breaks between buckets, and the choice between percentages or number ranges all live in the popup. Each range gets its own fill color, so the map can read as a single-color size scale or as a multi-color size scale. The Group Now button writes the choices to the map, and the legend updates with the new ranges.
Bubbles Map vs Heat Map
A bubble map and a heat map answer 2 different questions on the same data set. A bubble map keeps every row as a marker and scales the circle by a value in that row, so any 1 location can read on its own by size. A heat map blends rows into a colored bloom that reads concentration across an area. Both rely on color or size to surface where the data sits, and both work from the same uploaded file.
The split that matters in Maptive is what the map actually plots. A bubble map plots a circle per row, with size and color tied to a bucket the row falls into. A heat map plots a bloom across the map that grows where points sit closest together, or where a chosen number column piles up. A single high-value row reads on its own on a bubble map. The same row blends into the bloom on a heat map.
Picking the right read depends on the question being asked. Use bubbles when row-level comparison matters and the audience wants to read 1 location against another. Use heat when the question is about pockets rather than points, and the goal is to see where a region as a whole runs hot or cool. Running both views on the same data set across saved map views answers the row-level and region-level reads in turn.
Spreadsheet to Bubble Map
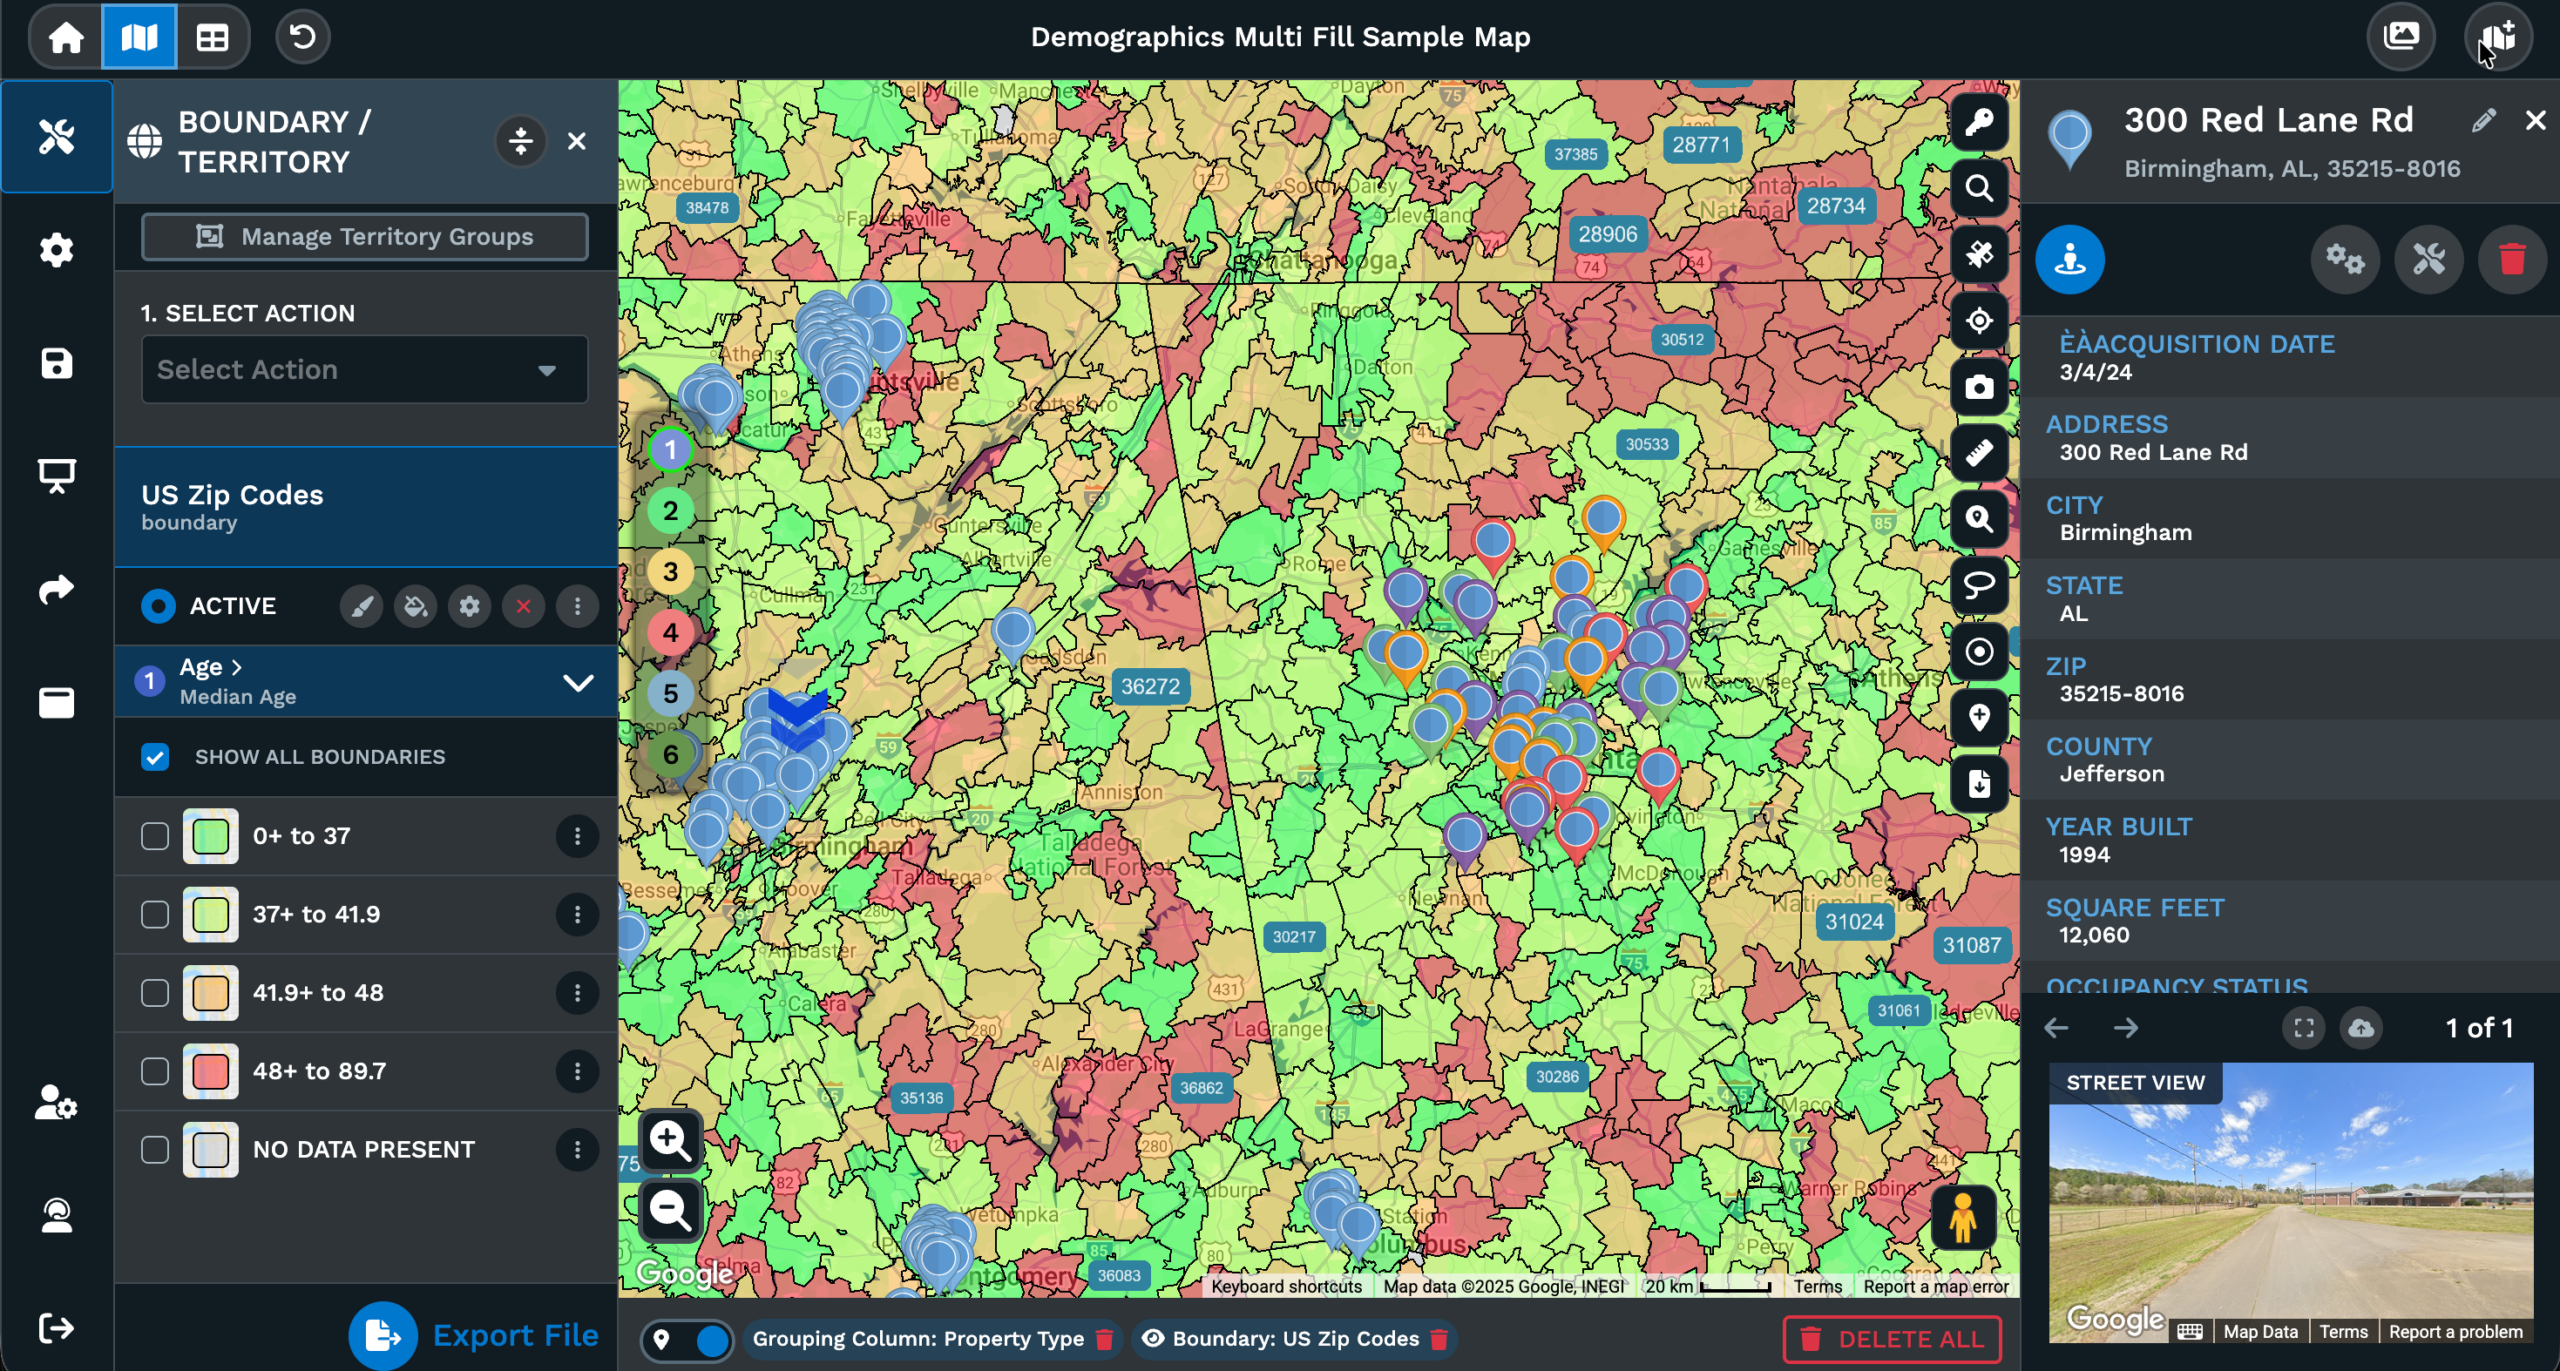
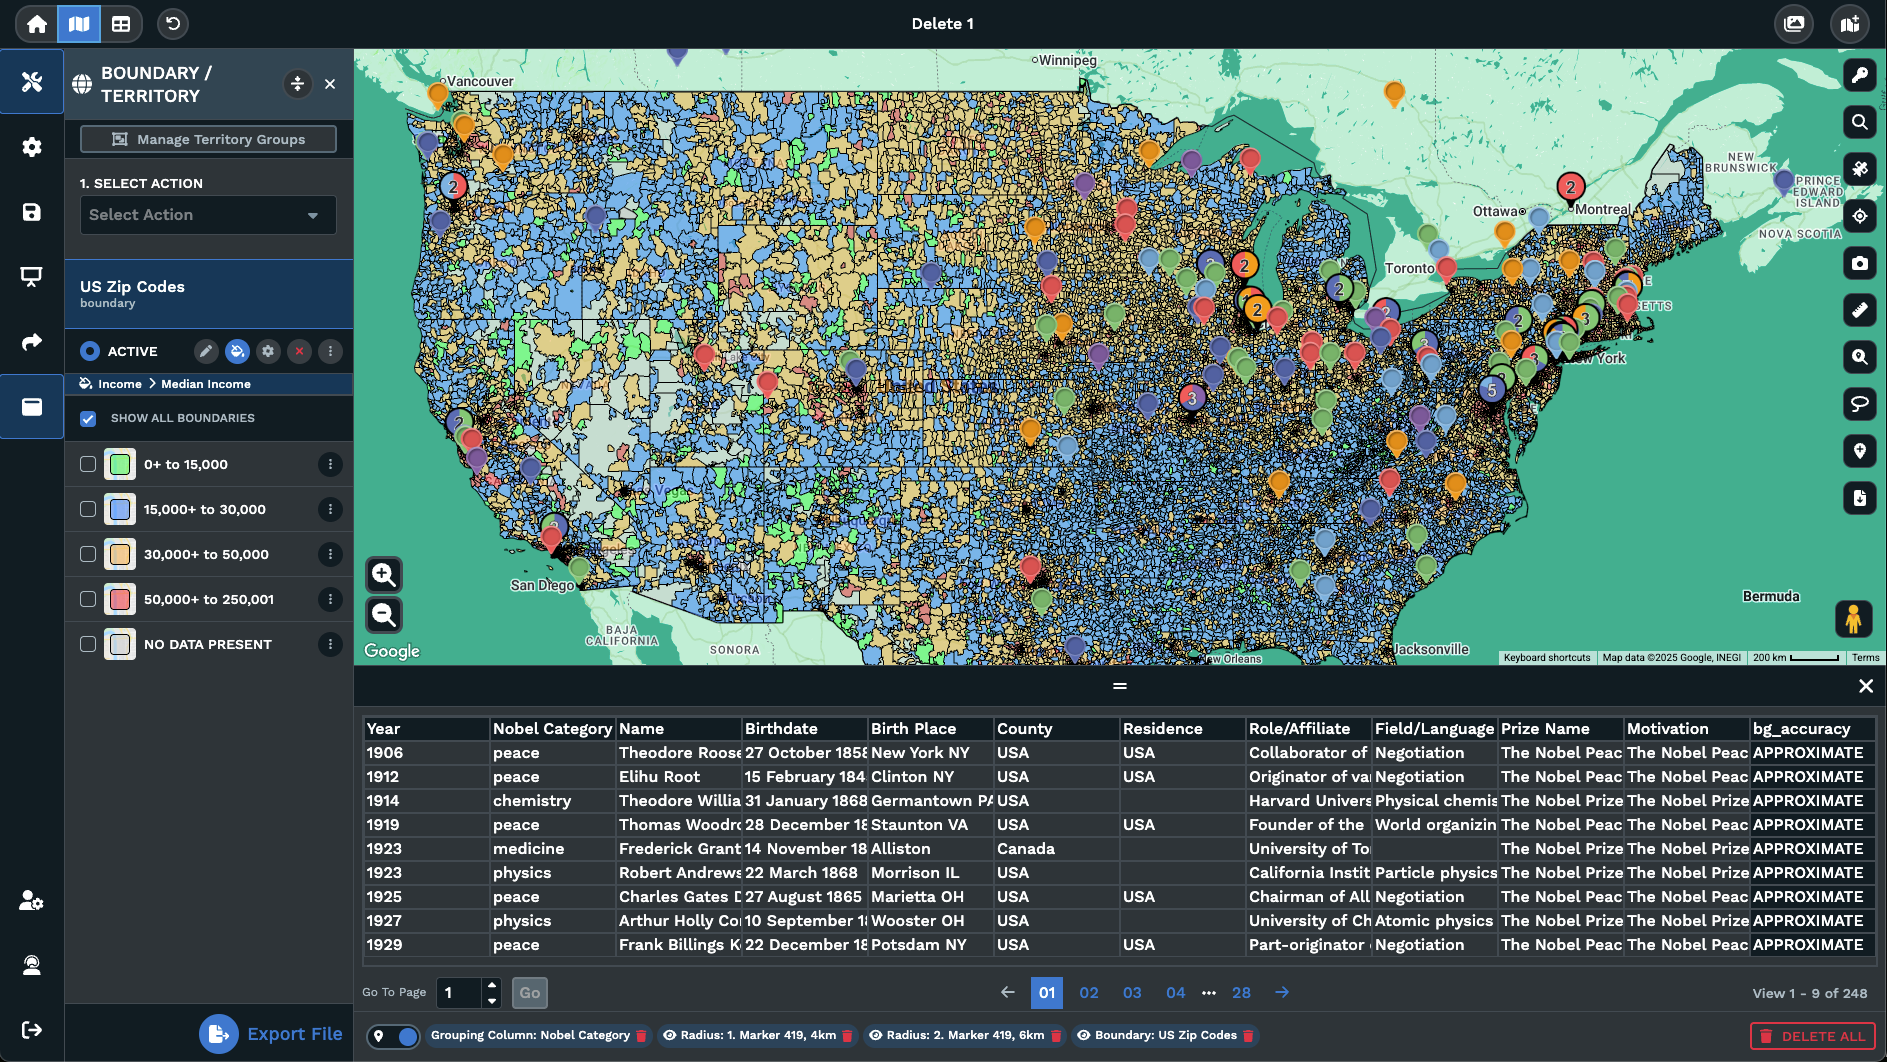
A bubble map starts with a data file already loaded into Maptive. Once rows are geocoded into markers, the Grouping Tool runs on any column the file holds. A number column drives the bucket sizes that the bubbles read by, and the doc lists Sales as the worked example for a numeric grouping. Any column with over 500 distinct values can be switched to number ranges so the buckets carry a real range read.
Opening Map Tools and clicking the Grouping Tool / Colored Pins Tool brings the controls onto the right side of the map. Picking the column inside Primary Group plots colored pins at first, with the column type set to text by default. Switching the column type to Numeric replaces the per-value color groups with range buckets, and a popup loads the range count, the break style, and the marker option set.
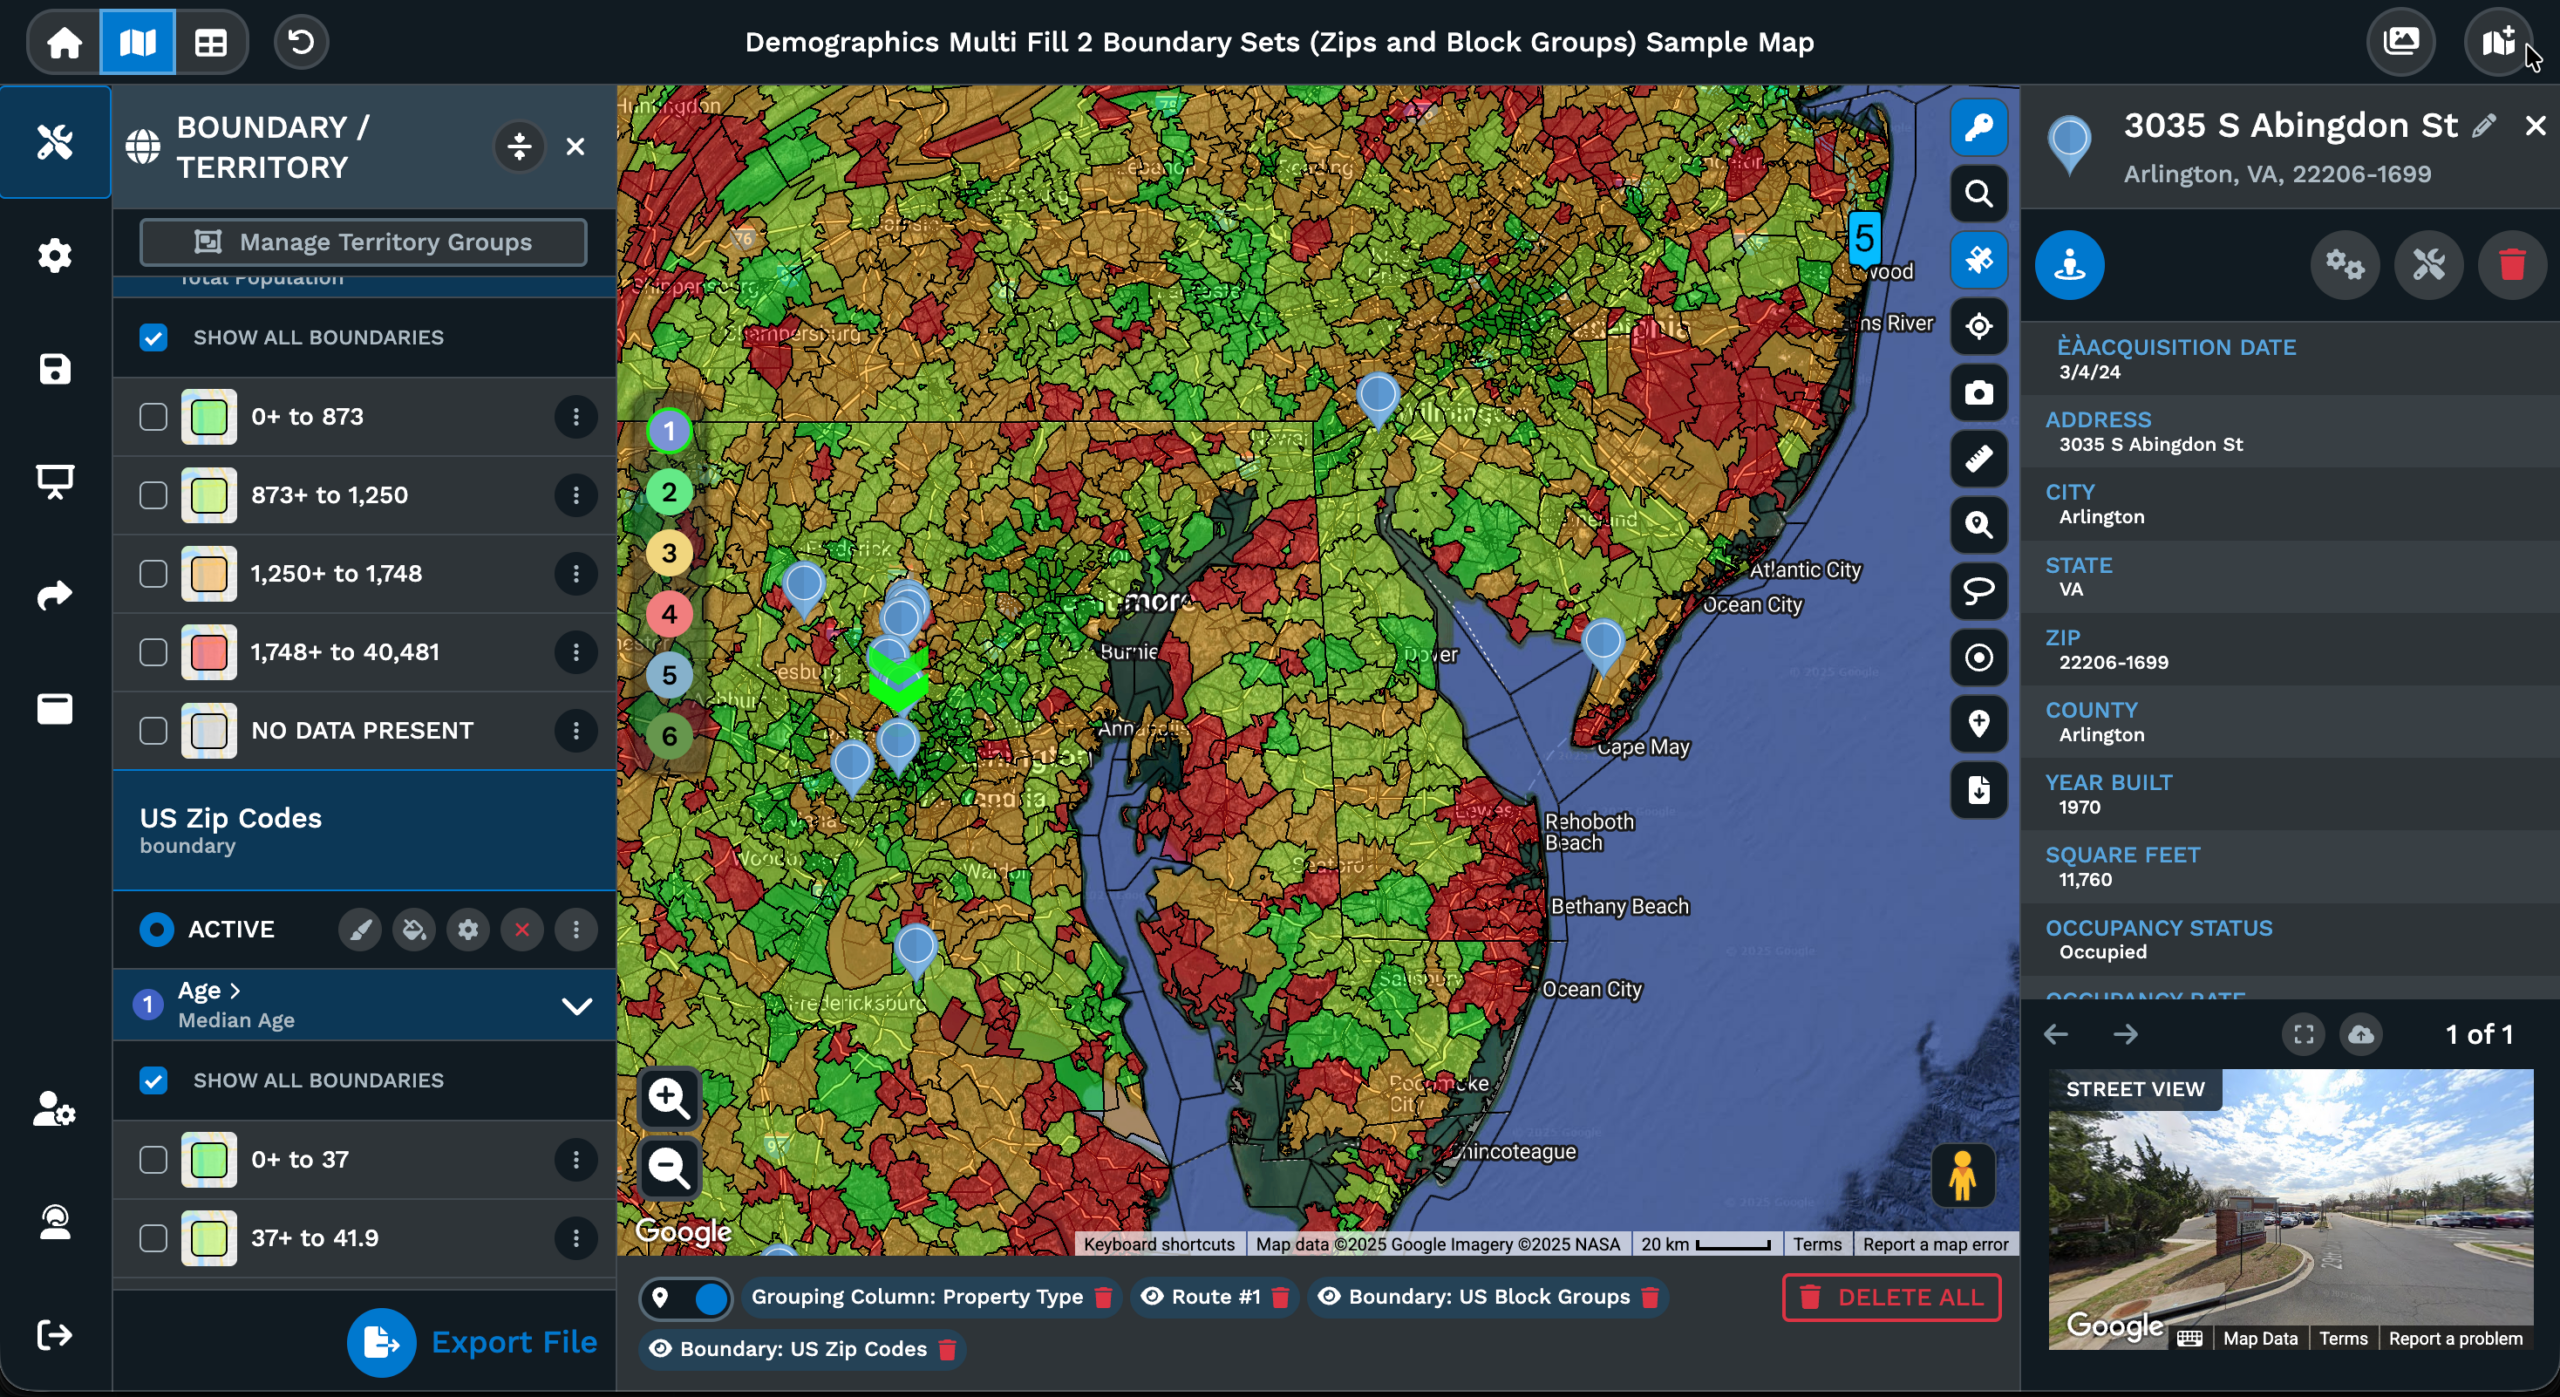
Bubble maps stay editable after Group Now is clicked. The small white icon next to a group opens the per-range style controls so colors can be tuned without resetting the map. The location pin icon opens Group Marker Settings for that bucket. Primary and Secondary groups can be selected or deselected to read 1 band at a time, and the doc points at the Grouping Tool as the home for edits.
FAQs About Bubble Maps
What is a bubble map in Maptive?
A bubble map in Maptive is the read you get when the Grouping Tool / Colored Pins Tool runs on a number column and the column type is set to Numeric. A popup loads the range options, and the map redraws with a sized bubble or a growing pin marker at each row. Marker size carries the value band, the legend keys the range bands, and any range can be deselected to hide that band on the map while the rest of the view stays as it was.
How do I size markers by a number column?
Open Map Tools and pick the Grouping Tool / Colored Pins Tool. Select your number column in the Primary Group dropdown, then switch the column type from text to Numeric. The popup loads the range options, where you set how many groups you want and pick between percentages or number ranges. Pick Blue bubble, Multi color bubble, or Growing pin markers, then click Group Now. The map redraws with sized markers, keyed in the legend so the value bands stay readable to any viewer.
What marker options can a bubble map use?
The Grouping Tool popup lists 3 marker options once a chosen column is set to Numeric. Blue bubble markers use 1 color across the map with size as the read. Multi color bubbles add a per-range fill color so size and category sit on the same bubble. Growing pin markers swap the circle for a pin marker that grows with the bucket. The fill color for each range is editable inside the same popup, and clicking Group Now writes the picks back to the map and updates the legend.
Can a bubble map show 2 columns at once?
Yes. Set the Primary Group to a category column and pick the Secondary Group dropdown to add a second column on the same map. The doc notes the secondary slot is better for numeric data because the bubble markers carry the magnitude of the value. A category column in Primary Group with a number column in Secondary Group gives a 2-read map, with category color from the primary set and value-driven bubbles from the secondary set sitting on the same view at the same time.
Can I edit the range buckets after the map is drawn?
Yes. The small white icon to the right of each group opens that range bucket so the fill color or style can be tuned without resetting the map. The location pin icon next to a group opens Group Marker Settings for the bucket of rows in that range. The Numeric popup can also be reopened so the bucket count, range breaks, or marker option get adjusted, and clicking Group Now writes the new picks back to the map and updates the legend.
Does the Grouping Tool work on text columns too?
Yes. The Grouping Tool / Colored Pins Tool runs on text columns out of the box, with each distinct value getting its own colored pin in the Primary Group set on the map. Bubble maps only kick in once the column type is switched to Numeric. The doc notes that a column can be switched to number ranges if there are over 500 distinct numbers in the data, which is where the range bucket setup takes over from the per-value color groups on a text column.
Can I add a second bubble layer to compare ranges?
The Secondary Group dropdown adds a second column to the same map view. Set Primary Group to a category column and Secondary Group to a number column, then pick a marker option for each set so the reads stay separated. The map carries both reads at the same time, and the doc notes that selecting or deselecting either group toggles its markers on the map. This lets you compare a value band against a category split without leaving the same map view at any point.
How do I hide a bubble band without removing it?
Each range bucket in the Primary Group or Secondary Group list can be selected or deselected from the Grouping Tool panel on the right of the map. Deselecting hides the markers in that bucket without resetting the map or losing the range setup behind it. Selecting the bucket again brings the markers back. The doc highlights this option as the way to read 1 band at a time when the map carries a lot of pins, which keeps the legend and the bucket math intact.
Does the bubble map handle a column with hundreds of distinct values?
Yes. The doc notes that a column can be switched to number ranges if there are over 500 distinct numbers in the data set. Once the column type is set to Numeric, the popup lets you pick the number of groups and the break style, so the hundreds of raw values get bucketed into a handful of readable ranges on the map. Sales, revenue, headcount, or population columns with long tails of distinct numbers all fit the range read for a bubble map output.
Should I edit a single marker or the whole group?
Edit the group. The Customizing Map Markers article notes that whenever possible the grouping tool should be the home for marker edits, since changes to individual markers will not show in the key and can get overwritten when reloading the data set. Open Group Marker Settings through the location pin icon next to a group, or use the small white icon to the right of a group, so the legend stays in sync with the map across every range bucket.