Distance Matrix Calculator
Pair every origin against every destination in one batch and get back a downloadable table of driving distance and drive time for every paired row in your 2 uploaded lists.
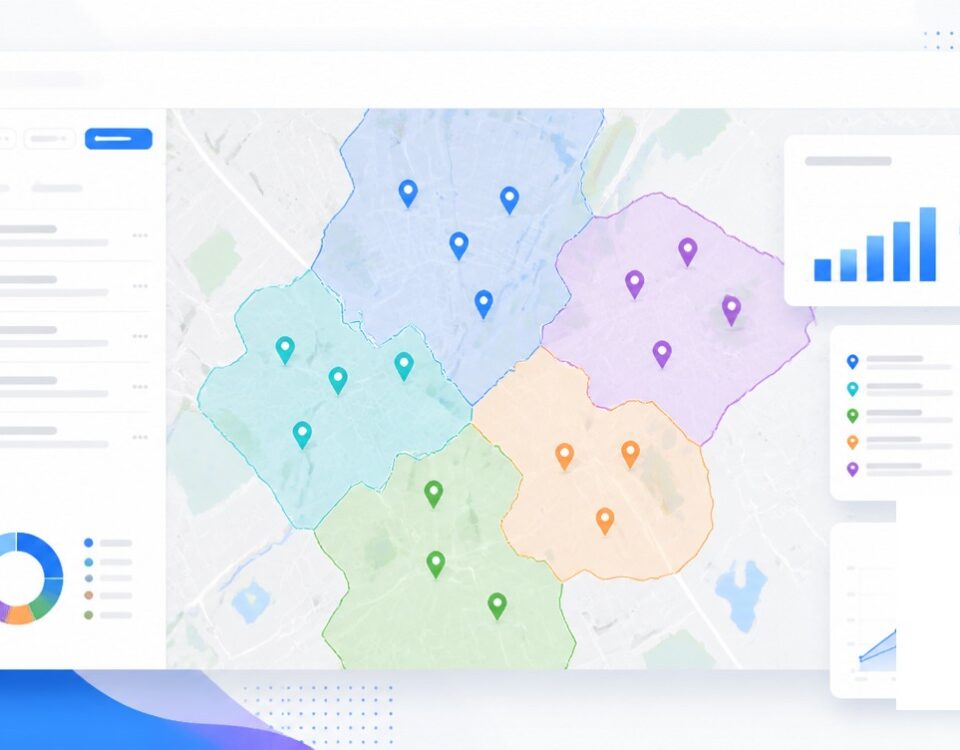
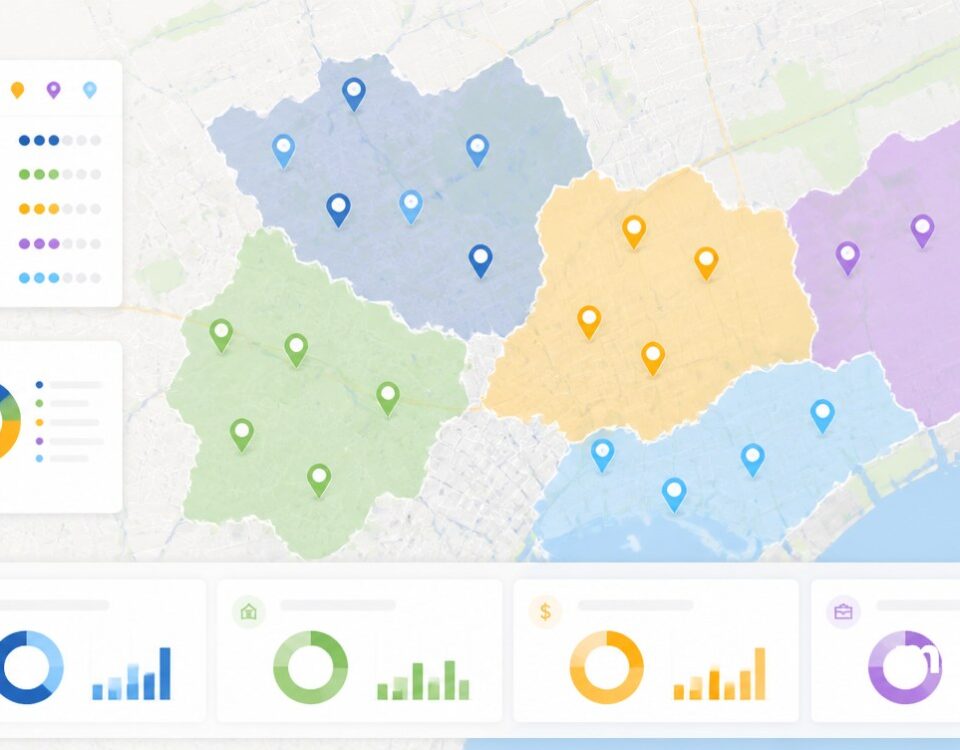
Distance Tables for Every Pair
Origin locations: Pick the first group of addresses, like sales reps, stores, hubs, or candidate sites. Every row becomes 1 starting point in the matrix run on that list.
Destination locations: Pick the second group of addresses, like customers, accounts, suppliers, or zip code centroids. Each row becomes 1 endpoint in your matrix run.
Spreadsheet upload: Bring an Excel file with the addresses or coordinates you already maintain. The file you keep your account list in is the file Maptive reads on upload.
Manual entry: Type addresses directly into Maptive when no file is ready. Useful for a short test run before you commit a full spreadsheet upload of a production list.
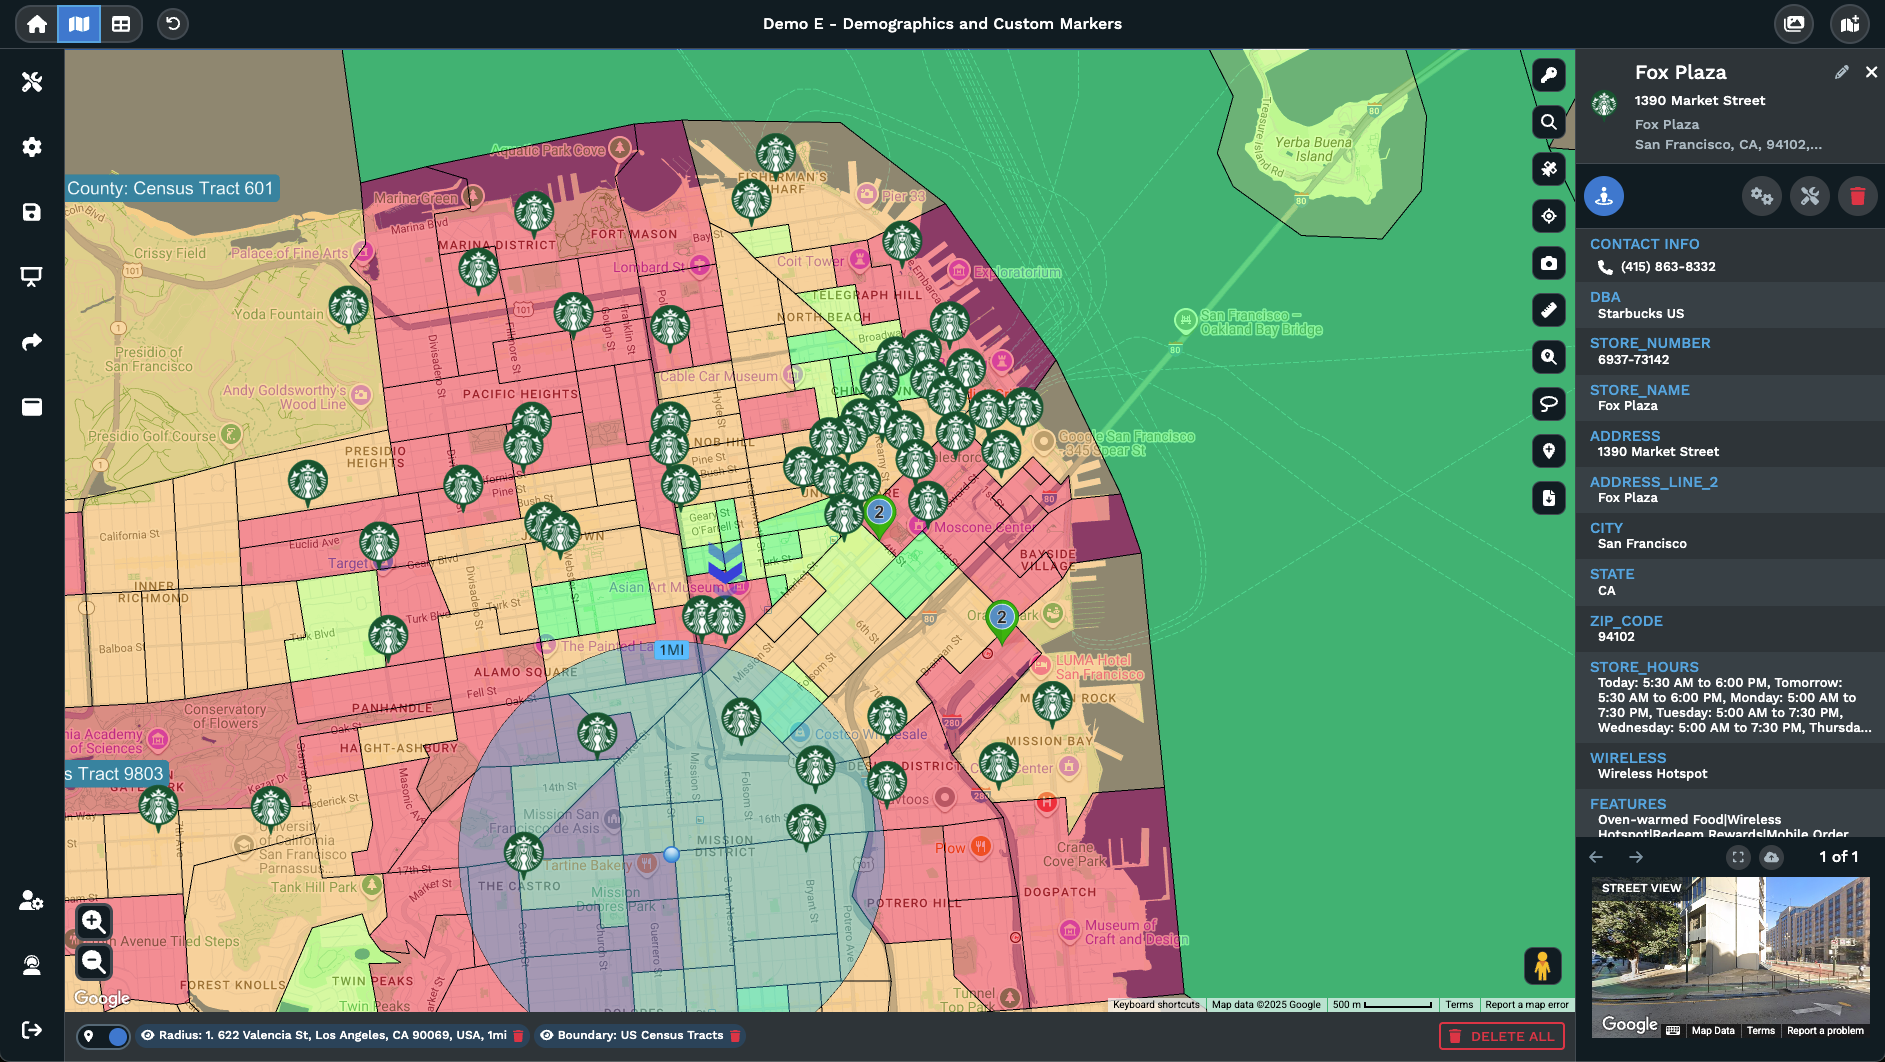
Origin and destination flag: Tag which rows are origins and which are destinations on the same map. Maptive pairs every flagged origin against every flagged destination.
Matrix run trigger: Confirm both groups, then run. Maptive pairs every origin against every destination and writes pair-level distance and drive time into a results table.
Find Locations in 3 Steps
1
Upload
Drop your spreadsheet into Maptive or type addresses by hand, then pick Create Map to plot every row on your data map.
2
Tag
Mark which rows are origins and which rows are destinations, then confirm both groups so the matrix pairs every pair.
3
Export
A full distance and drive-time table opens inside Maptive, and the file downloads as XLS or CSV for any model you run.
Closest Hub Per Row
Per-Lane Driving Mileage
Total Travel Per Candidate
Outlier Drive Times
Closest Rep Per Customer
Reusable Pair Files
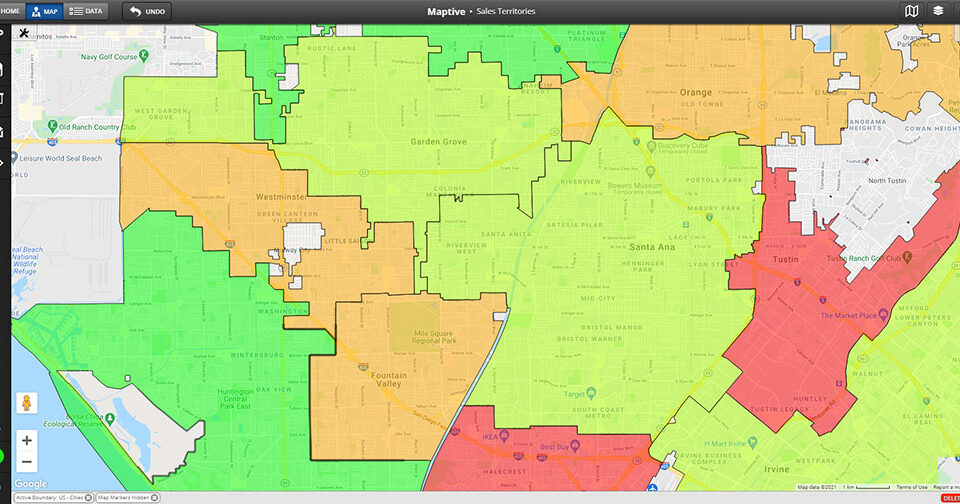
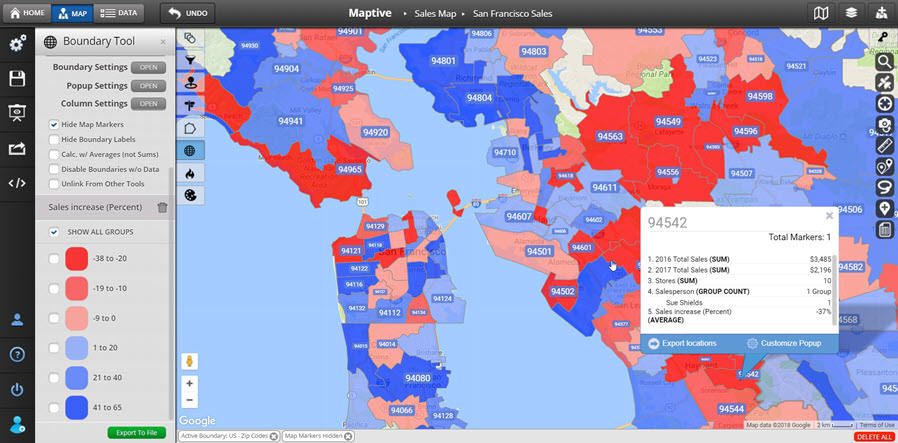
Distance Tables for Logistics Pairs
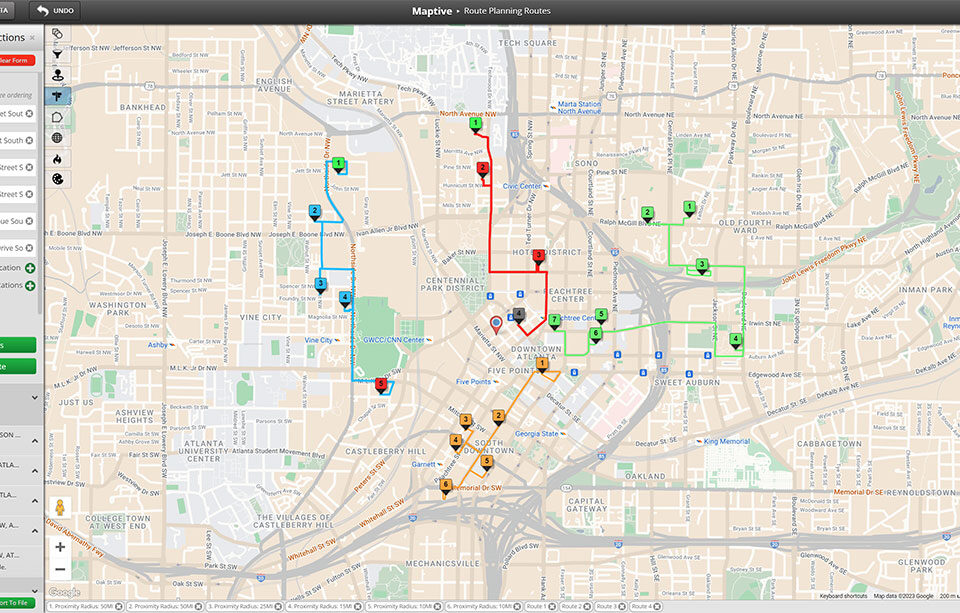
Defining the Distance Matrix
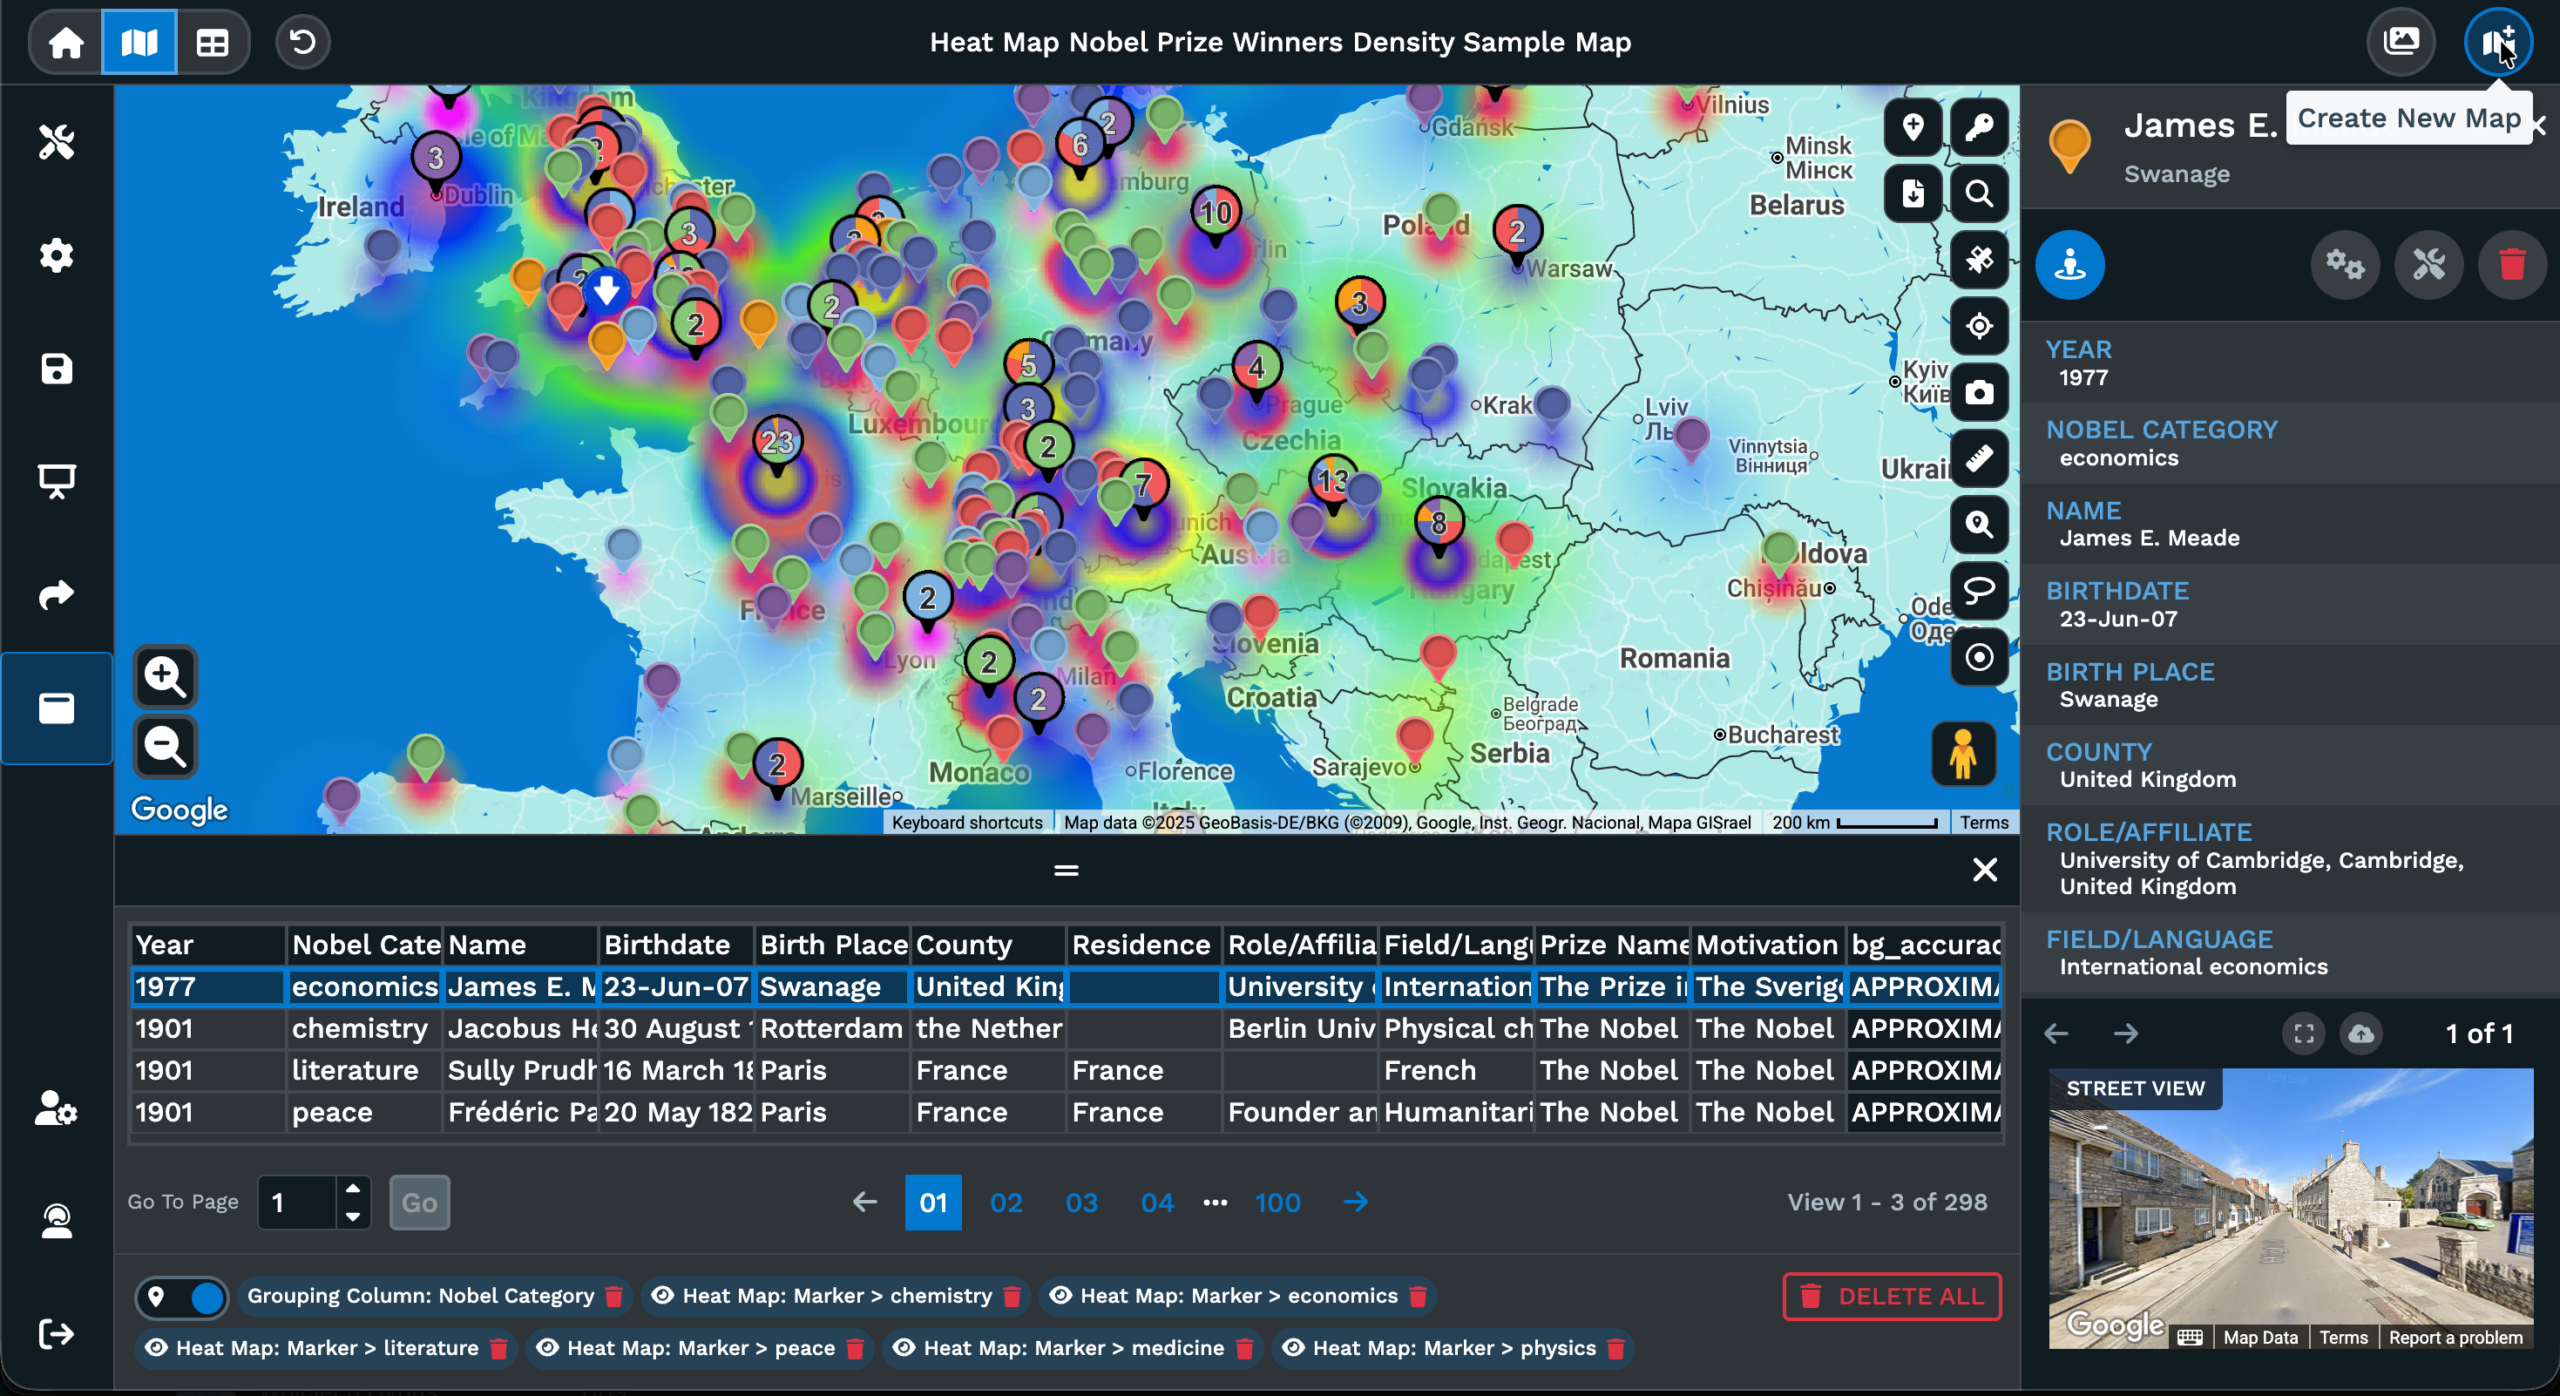
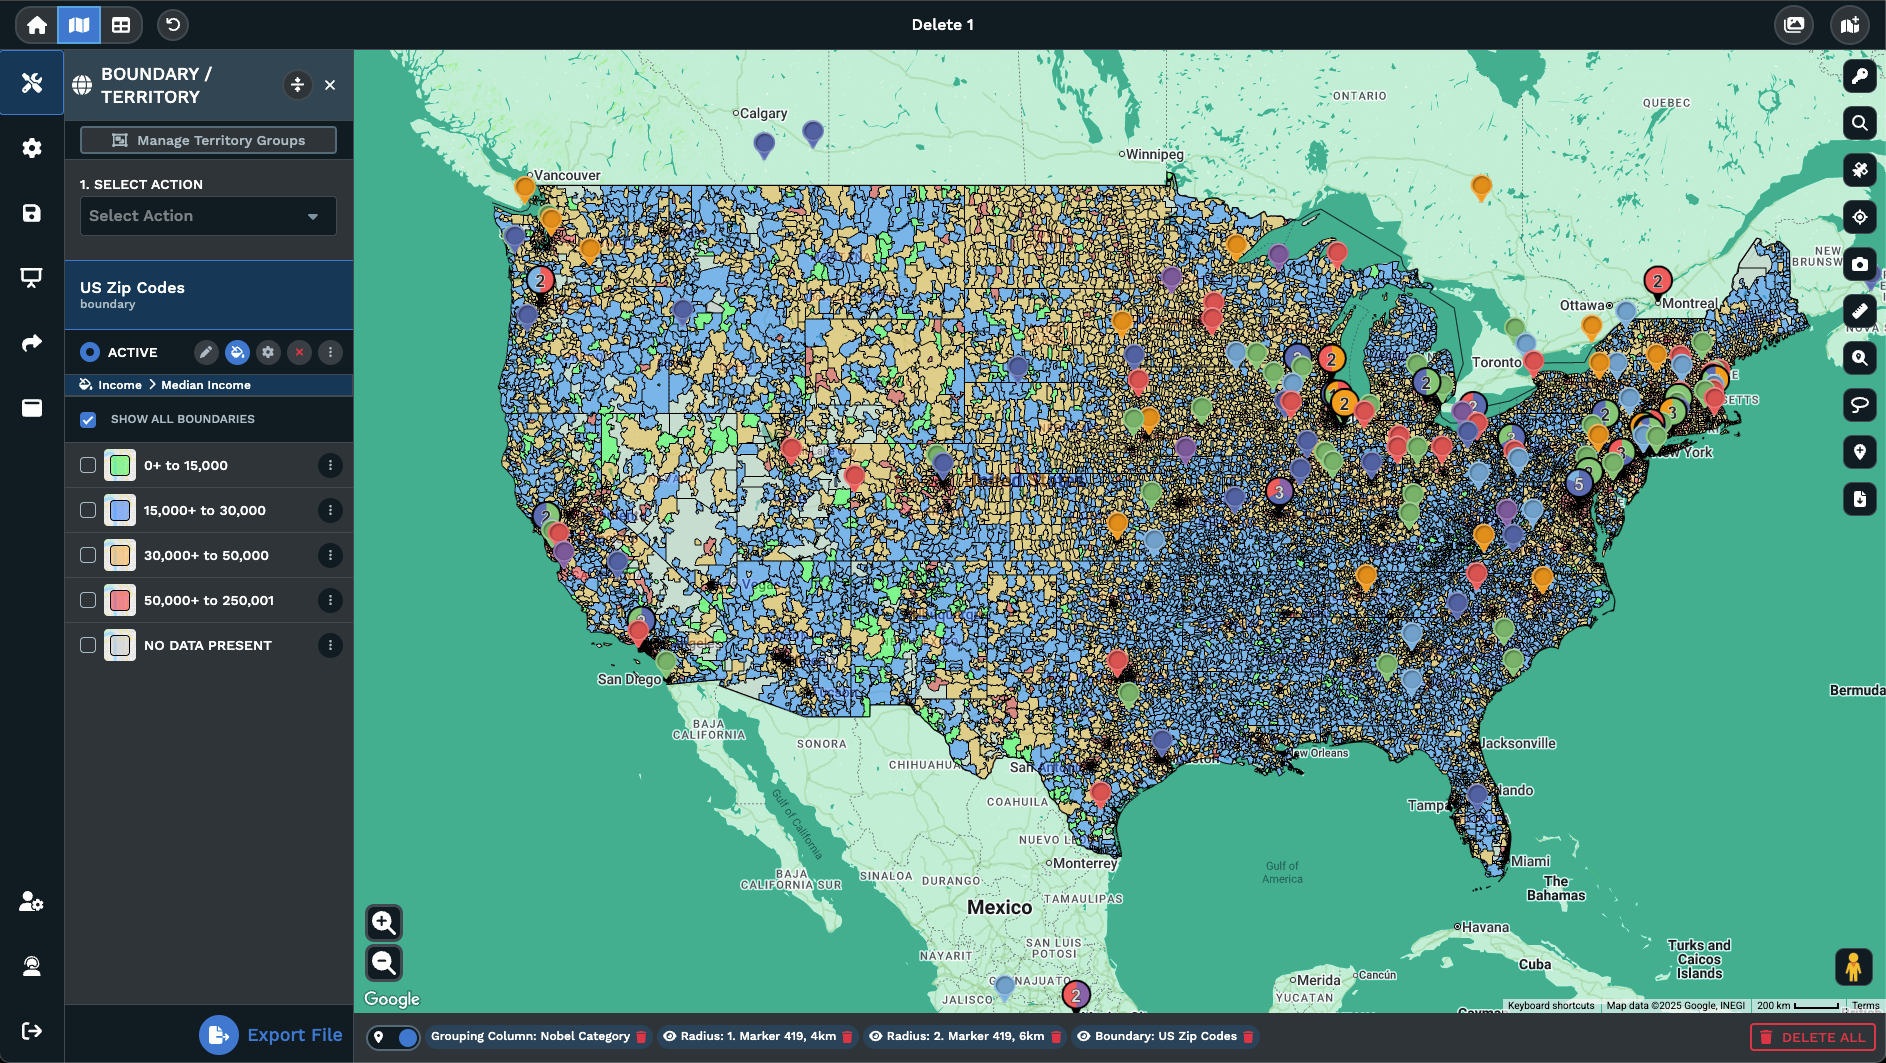
A distance matrix is a table that lists the driving distance and the drive time between every row of a starting list and every row of a destination list. If a 50-row customer list is the destination and a 10-row store list is the origin, the table that the matrix produces has 500 paired values, 1 per origin-to-destination combination. Spreadsheets do not handle this without a script against an external API, and clicking the same lane 500 times in Google Maps is not a workflow any planning team is going to keep up with.
Maptive's Distance Matrix Calculator is the run button for that table. Bring an Excel file or type addresses in, plot the rows on the Google-powered map, flag which rows are origins and which are destinations, then run the matrix. The result is a pair-level table of driving distance and drive time you can read inside Maptive or download as XLS or CSV.
The output is the file a planner, an analyst, or a dispatcher already wanted. A pricing team feeds the table into a rate model. A territory owner sorts the table for the closest rep per customer. A site search team sums each candidate row to pick the best location. The matrix is the input the next step of the workflow needs.
Math Across Many Pairs
A many-to-many calculation is the work a spreadsheet formula cannot finish on its own. The user has 2 lists, and the answer needs the driving distance between every row of 1 list and every row of the other list. A 100-by-100 problem is 10000 paired values, and a 500-by-500 problem is 250000. No drag-down formula in Excel returns driving time, and no manual lookup against Google Maps will keep pace with the volume a planning team needs to handle.
Maptive runs the pairing as a batch from your inputs. You hand Maptive the 2 lists, tag which rows are origins and which rows are destinations, then run the matrix in 1 pass. The matrix returns 1 row per pair with the driving distance and the drive time, and the table is ready to read inside Maptive or to export as XLS or CSV to a downstream model.
The work that the matrix removes is the manual lookup loop. A team that previously paid a junior analyst to type lane addresses into Google Maps 1 row at a time gets a table that arrives from a spreadsheet upload step instead. The same logic applies to coverage audits, supplier sourcing, and any planning step where the question is which location is closest to which other location on a sizable row list.
Origin and Destination Pairing
The matrix runs on 2 inputs, and the labels on those inputs matter. The origin column is the starting list, the destination column is the ending list, and every paired row in the output is read as origin to destination. Reversing the labels reverses the read of the table, which matters when the answer is the closest rep per customer versus the closest customer per rep on a coverage audit run.
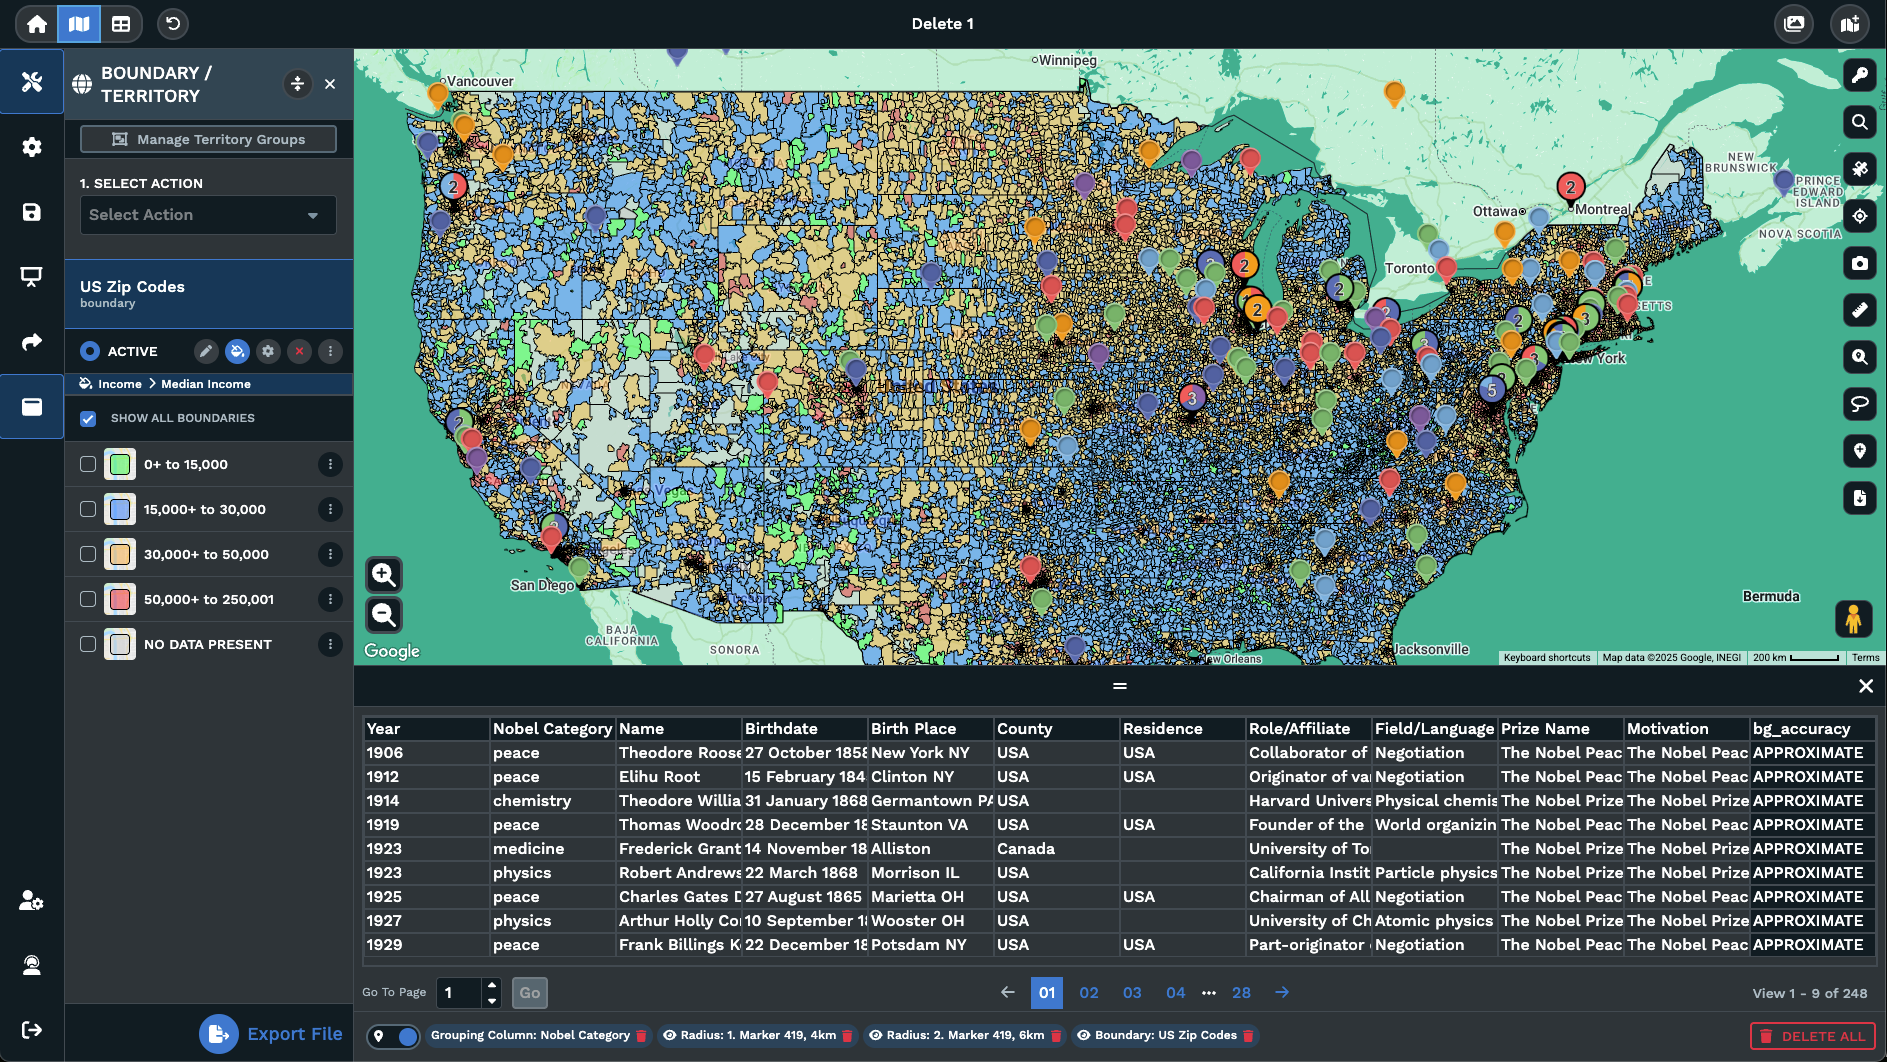
Maptive lets you flag origins and destinations on the same map view. Both lists plot on the Google-powered map, and the matrix run reads the flag column to pair every origin against every destination in the run. The output file carries the pair-level driving distance and the drive time so the rest of the planning work happens in the file your team owns, not inside the application screen.
The labels also matter for a same-list run. If you pair every row of 1 list against every other row of the same list, you load the list as both origin and destination on the run. Maptive then returns the all-pairs distance table for the full list. A 200-store same-list run is 1 way to get the store-to-store driving distance file for a supply chain plan, a transfer file, or a competitor proximity check on a list.
FAQs About the Distance Matrix Calculator
What is a distance matrix calculator in Maptive?
The Maptive Distance Matrix Calculator pairs every row of an origin list against every row of a destination list and returns a table of driving distance and drive time for every pair in the run. You upload your data from an Excel file or type the addresses in by hand, plot the rows on a Google-powered map, flag which rows are origins and which rows are destinations, then run the matrix in 1 pass. The output table opens inside Maptive and downloads as an XLS or CSV file you can drop into any spreadsheet or model your team already runs.
How do I calculate distance between multiple locations in 1 pass?
Upload your origin list and your destination list into Maptive, select Create Map to plot the rows on the map, then tag which rows are origins and which rows are destinations in the tool. Run the matrix and Maptive pairs every origin against every destination in a single pass. The results table lists 1 row per pair with the driving distance and the drive time. Download the table as XLS or CSV when you want to load the numbers into a pricing model, a routing plan, or a coverage audit you already run on a regular cadence.
Can I calculate driving time between many addresses with the matrix?
Yes. The Distance Matrix Calculator returns the drive time for every origin-destination pair, alongside the driving distance, so a 100-by-100 pair list arrives with 10000 drive-time values in 1 run. Drive time is what feeds territory reassignment, site selection by total travel, and home-to-assignment audits for field teams. Sort the returned table by shortest drive time per origin row and you have the closest destination per row, ready for staffing or routing handoff to the system that owns that assignment downstream of the file.
Is there a way to find the closest location from a list of options?
Yes. Load the points you want assigned as origins, load the candidate locations as destinations, then run the matrix in Maptive against those 2 lists. The output table lists the driving distance and the drive time for every pair, and a sort by shortest value per origin row gives you the closest candidate for every point in the origin list. Use this pattern to pick the closest hub, the closest store, the closest supplier, or the closest sales rep. Download the result as XLS or CSV and push the assignment column into the system that consumes it next.
What file types does the Distance Matrix Calculator accept and return?
Maptive reads an Excel spreadsheet on upload, and you can also type addresses directly into Maptive when no file is ready on your side. The matrix output is a table you can view inside Maptive and download as XLS or CSV when the run finishes. The exported file holds the origin row, the destination row, the driving distance, and the drive time on every line. The file is the input format Excel, Google Sheets, Power BI, and Tableau already read without a custom connector or a script that an engineer has to maintain.
How is this different from the Distance Calculator in Maptive?
The Distance Calculator measures the distance between points you click on the map, 1 pair or a connected series of clicks at a time on the screen. The Distance Matrix Calculator runs against 2 uploaded lists and returns the full pair-level table of driving distance and drive time for every origin-destination combination in the lists. The click tool answers a 1-off measurement question while looking at the map view. The matrix tool answers a planning question that needs hundreds or thousands of paired numbers delivered in a single downloadable file.
Can I run a matrix where origins and destinations are the same list?
Yes. Load the same list as both your origin group and your destination group on the same map, then run the matrix the same way you would for 2 distinct lists. Maptive returns the driving distance and the drive time between every row and every other row of the list. A 200-store run produces the store-to-store distance file you need for a transfer plan, a competitor proximity audit, or any same-set comparison. Download the file as XLS or CSV and load the pair-level numbers into the model that consumes the matrix downstream.
Do I have to upload a spreadsheet to run the matrix?
No. Manual entry is supported, so you can type addresses directly into Maptive when no file is ready on your side. A short test run is a fast way to see the matrix output structure before you commit a full spreadsheet upload of a production-size list to the tool. For any production run with more than a handful of rows, an Excel upload is the faster path, since the file you keep your customer list, store list, or lane list in is the same file Maptive reads on import without any reformatting on your end.
What can I do with the exported matrix file?
Drop the XLS or CSV into Excel, Google Sheets, Power BI, or Tableau and the columns load without a custom connector or a script that an engineer has to maintain. Sort by shortest drive time per origin row to pull a closest-destination assignment column. Sum each origin row across destinations to compare candidate sites by total travel volume. Pivot the table for a heat read of long lanes, or push the file into the pricing model, the routing engine, or the staffing plan that already consumes a pair-level distance file on a regular cadence.
Does the matrix use straight-line distance or driving distance?
The Distance Matrix Calculator returns driving distance and drive time, computed on a Google-powered map, not straight-line distance between coordinates. Driving values are the numbers a rate card, a routing plan, or a territory assignment actually depends on, since a real road network bends around water, terrain, and limited-access routes that a straight line ignores. If you want a quick on-map measurement instead, the Distance Calculator handles point-to-point clicks. For pair-level driving numbers across full lists, the matrix run is the path you want.