Manufacturing & Distribution Mapping Software
Maptive maps your distributors, dealers, reps, and the demand each one serves. Find the gaps in your coverage, balance sales territories, and plan distribution against market data, from one upload.
No credit card required
- Map plants, distributors & accounts
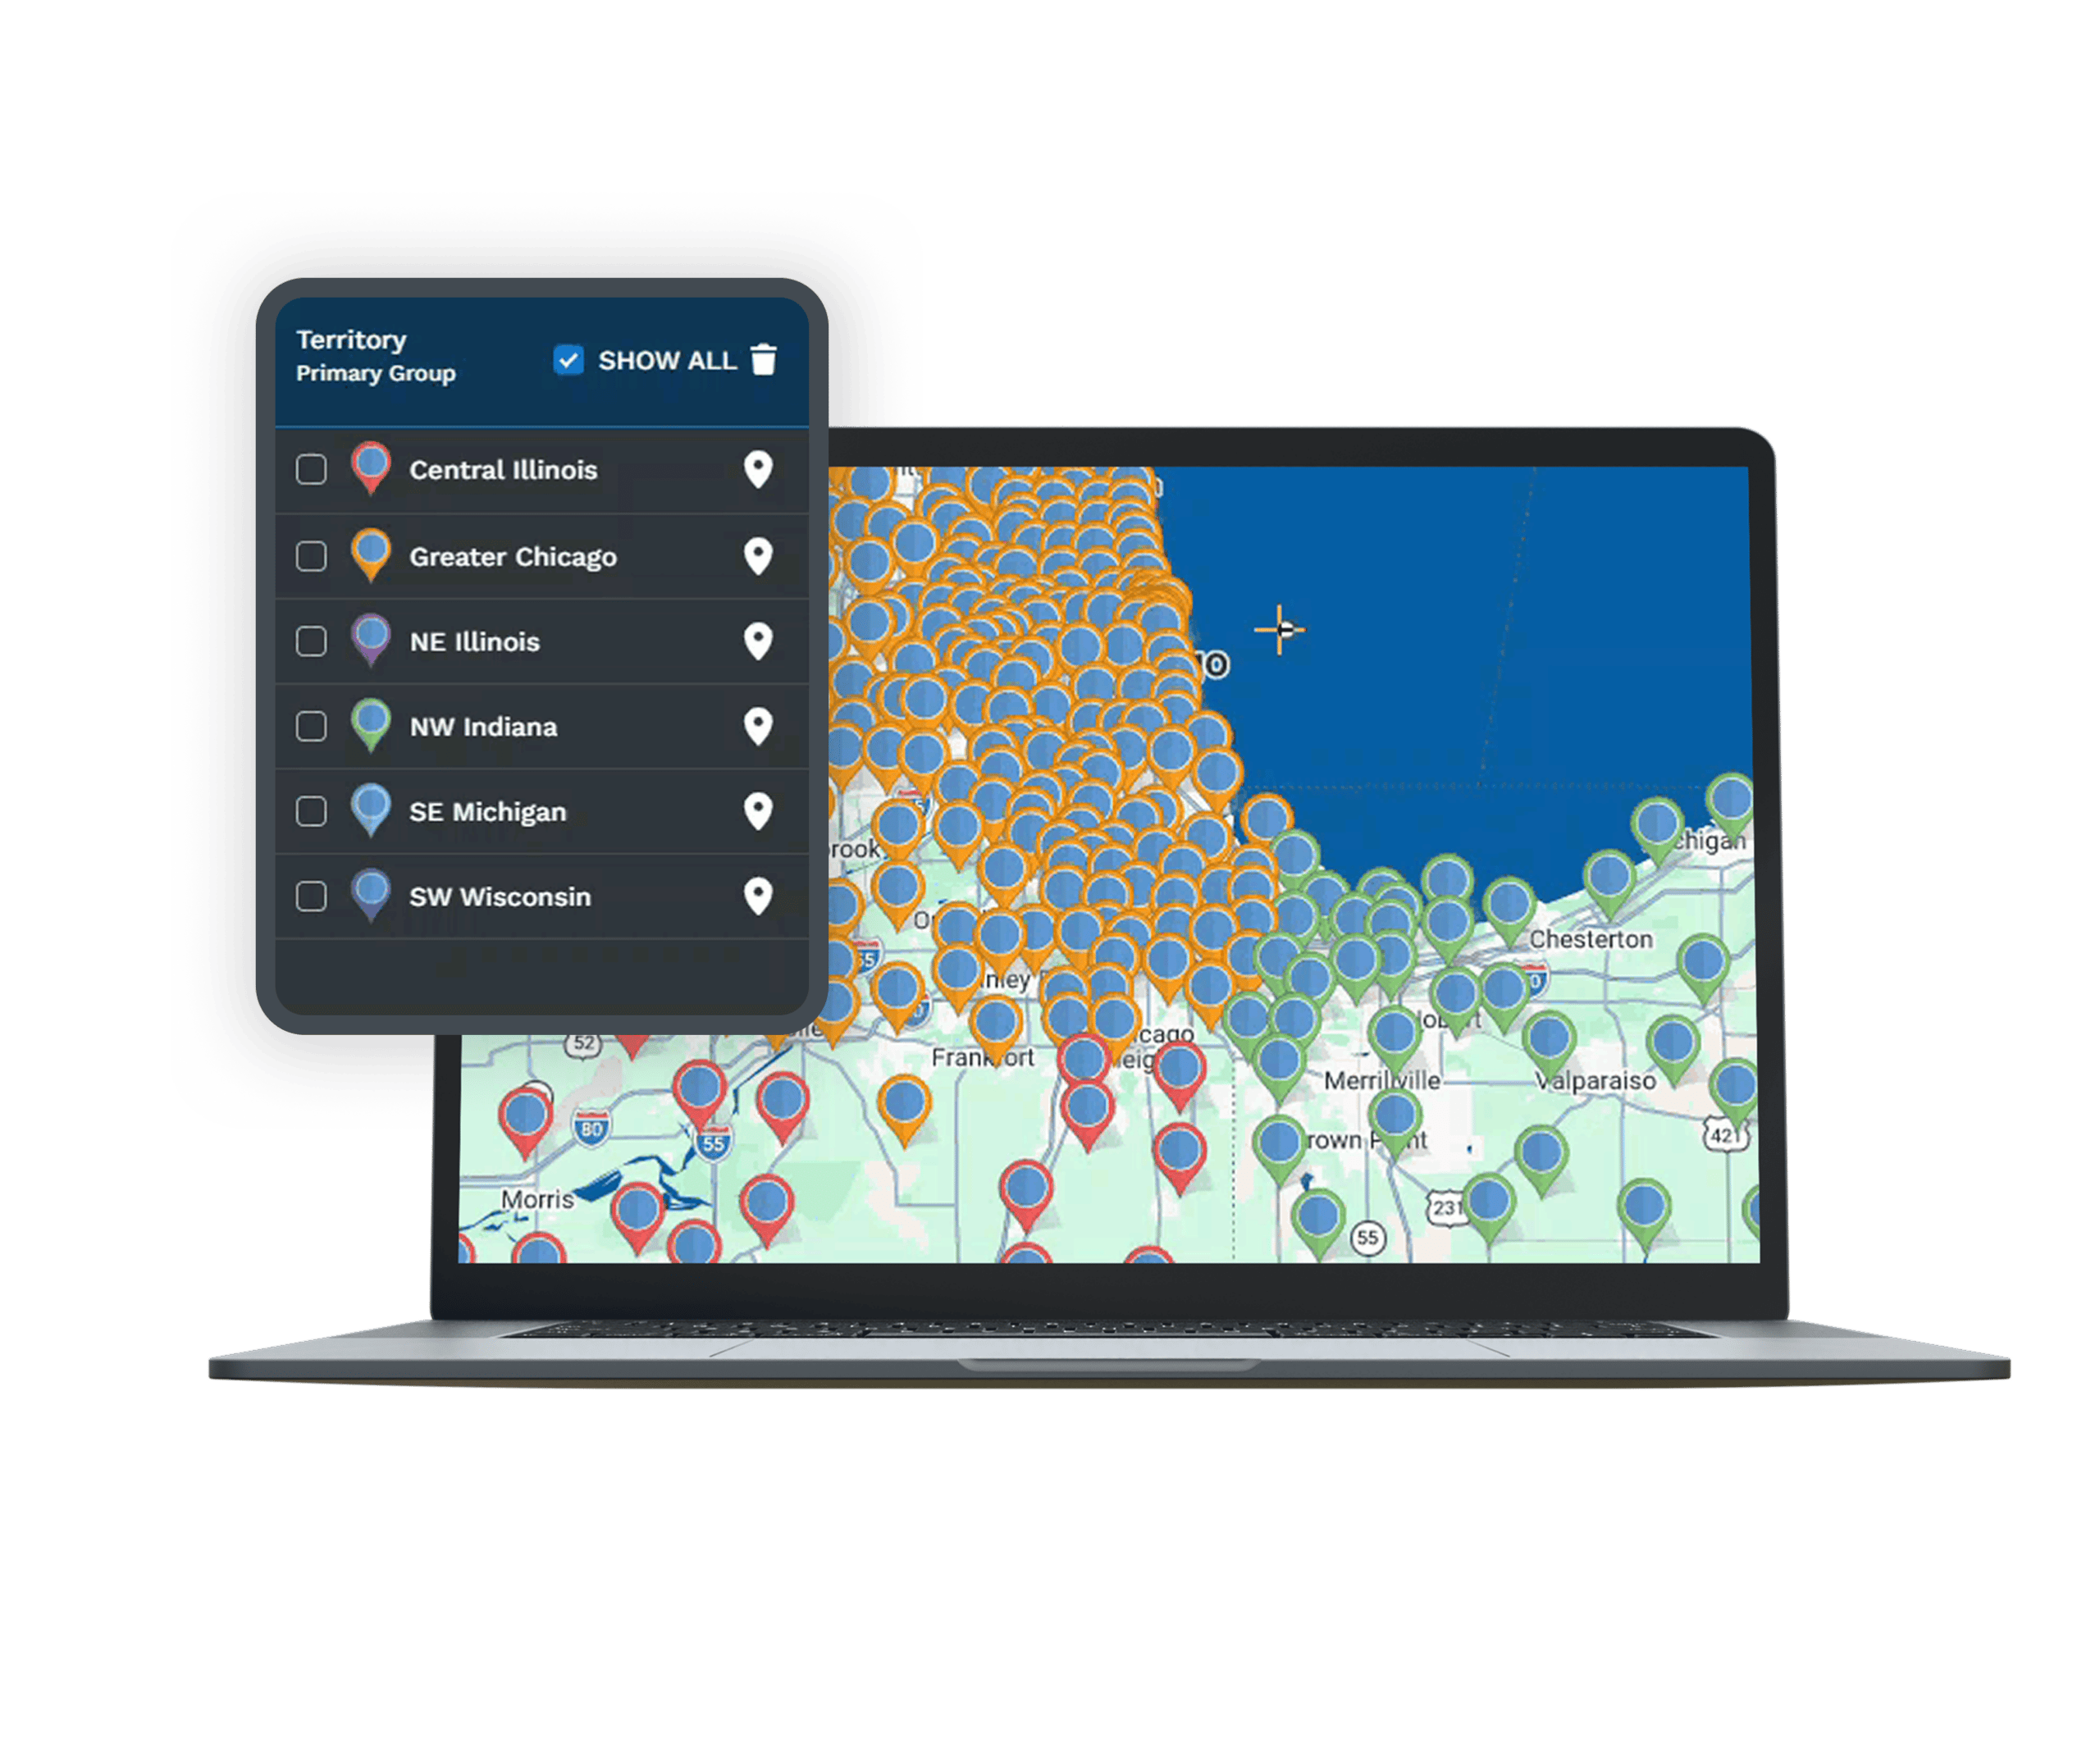
- Balanced rep & dealer territories
- Drive-time coverage by region
- Spot underserved markets
- Optimize delivery routes
- Layer demand & demographic data
- Map plants, distributors & accounts
- Balanced rep & dealer territories
- Drive-time coverage by region
- Spot underserved markets
- Optimize delivery routes
- Layer demand & demographic data
Trusted by teams at


Channel Coverage by the Numbers
Optimized distribution routes trim cost across a network, not one trip at a time.
A nationwide parts distributor cut route cost while compressing a two-week redesign into one afternoon.
Every plant, distributor, dealer, and account loads together, with no regional batching.
Closing the Gaps in Your Channel
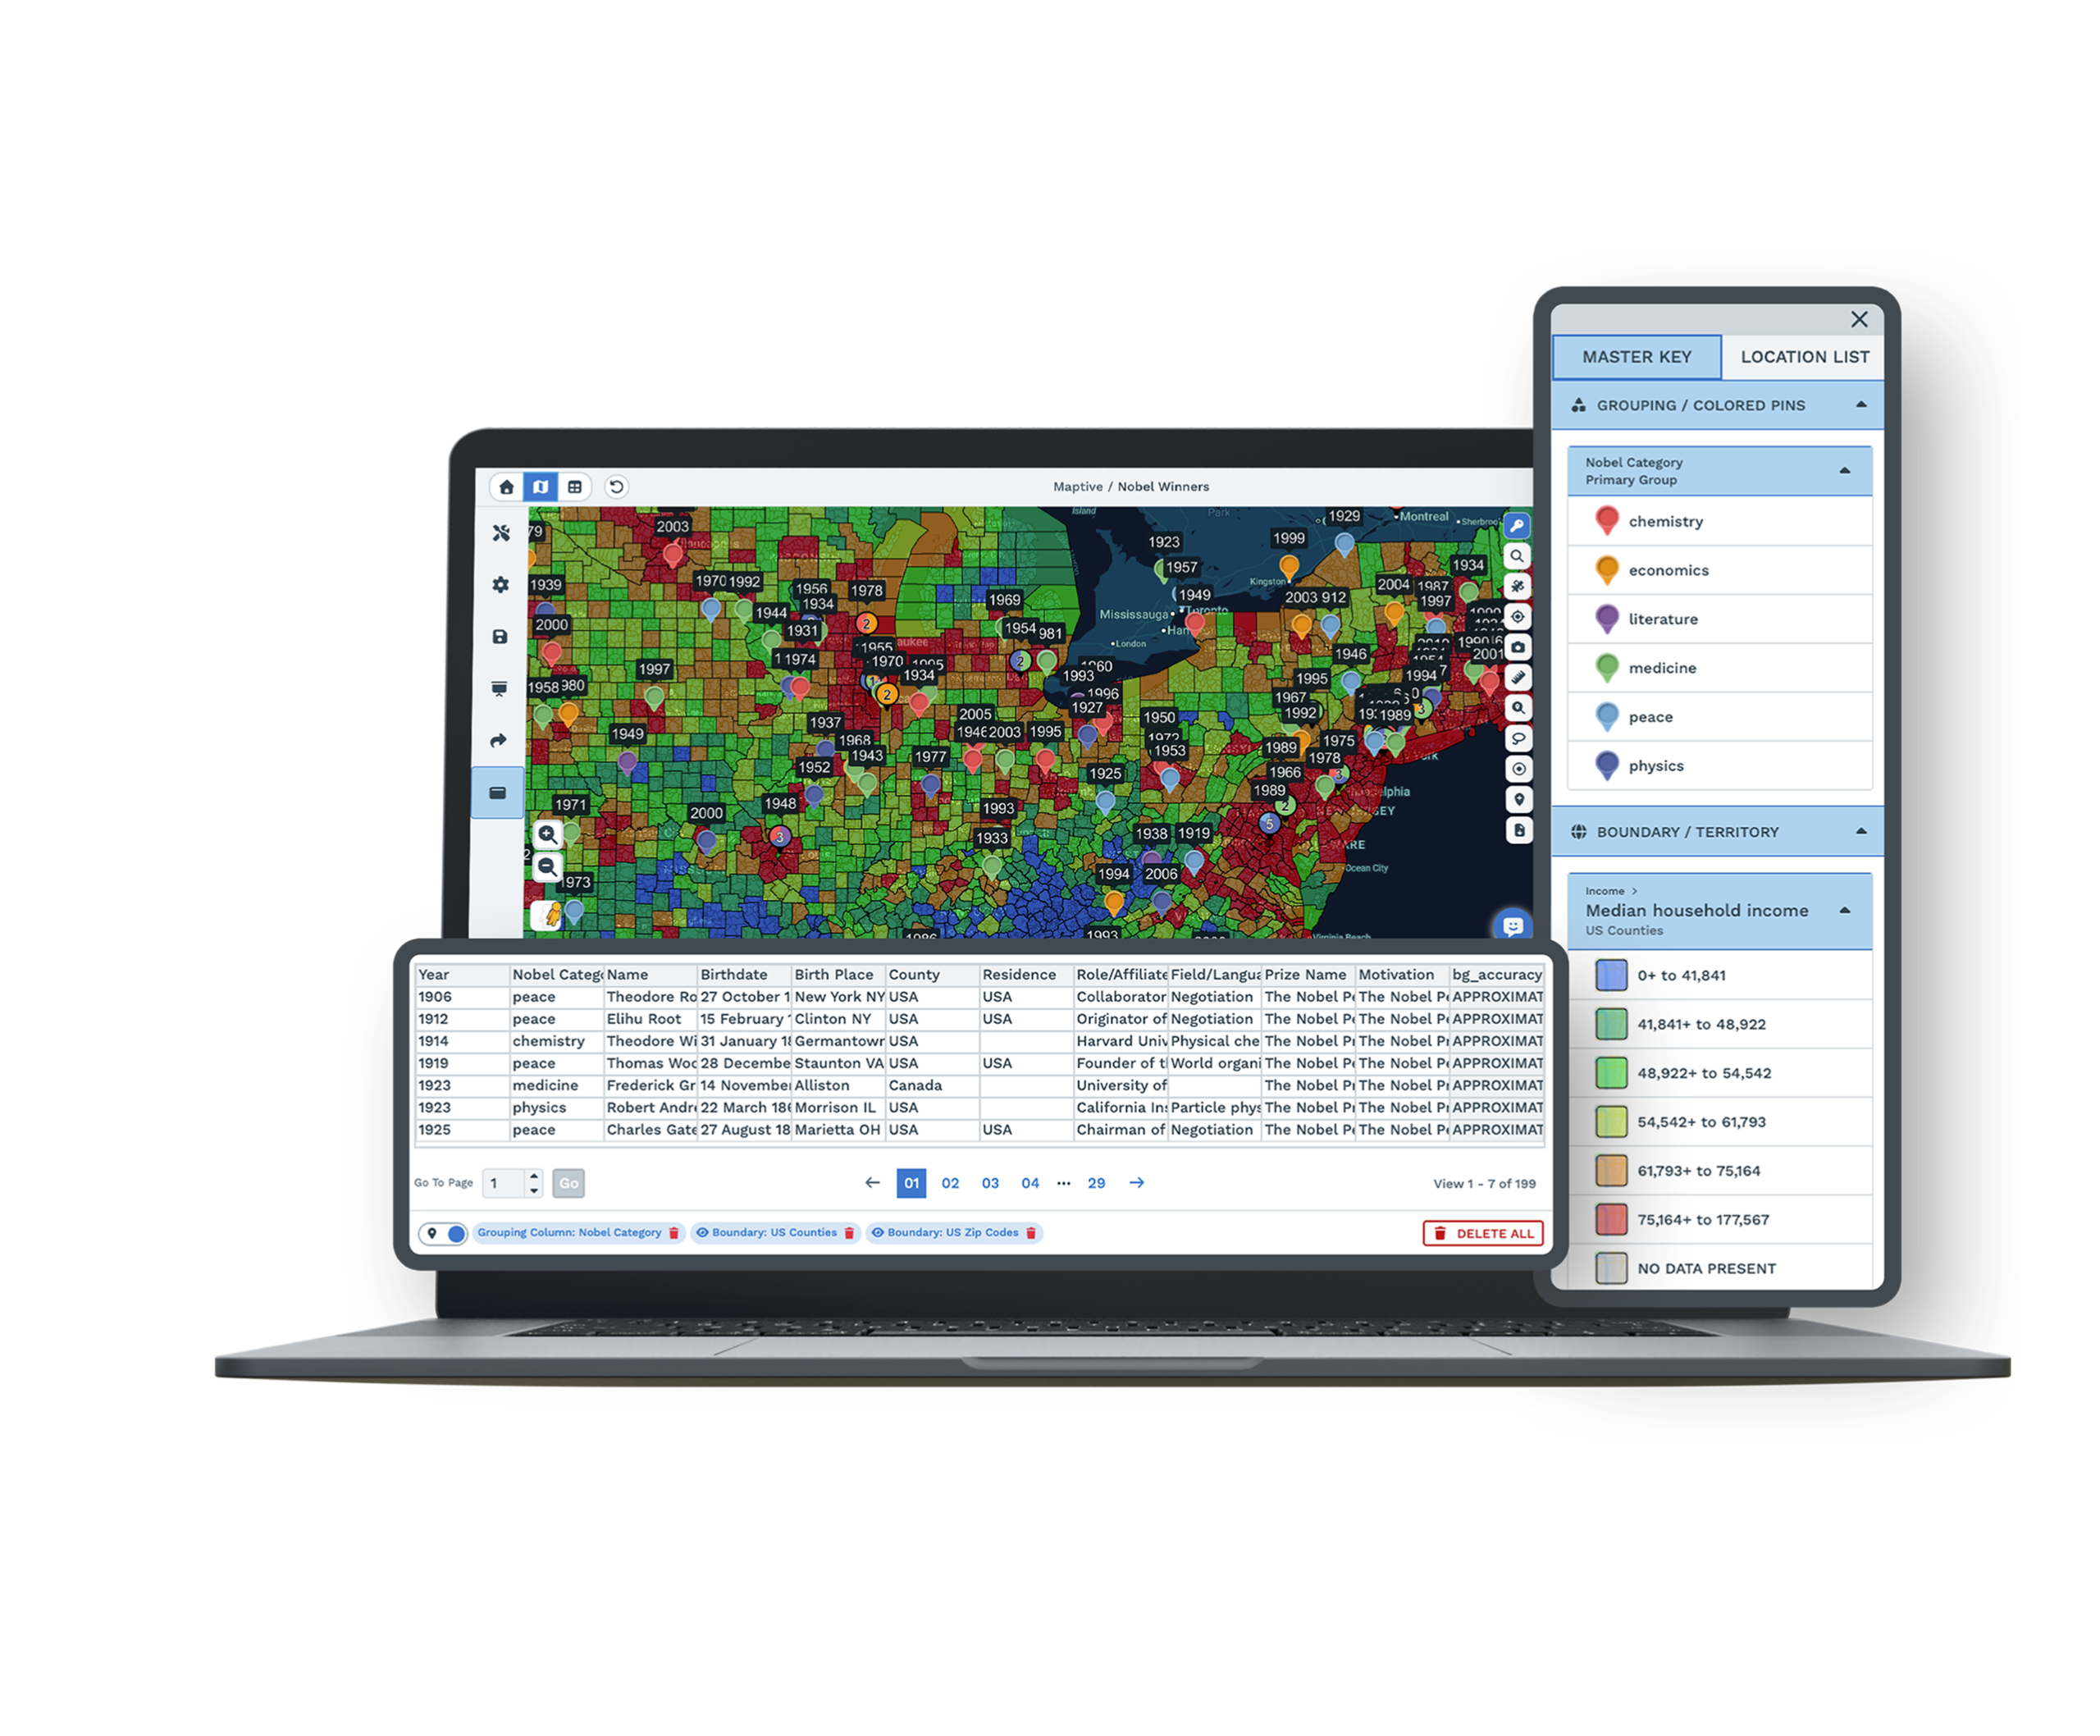
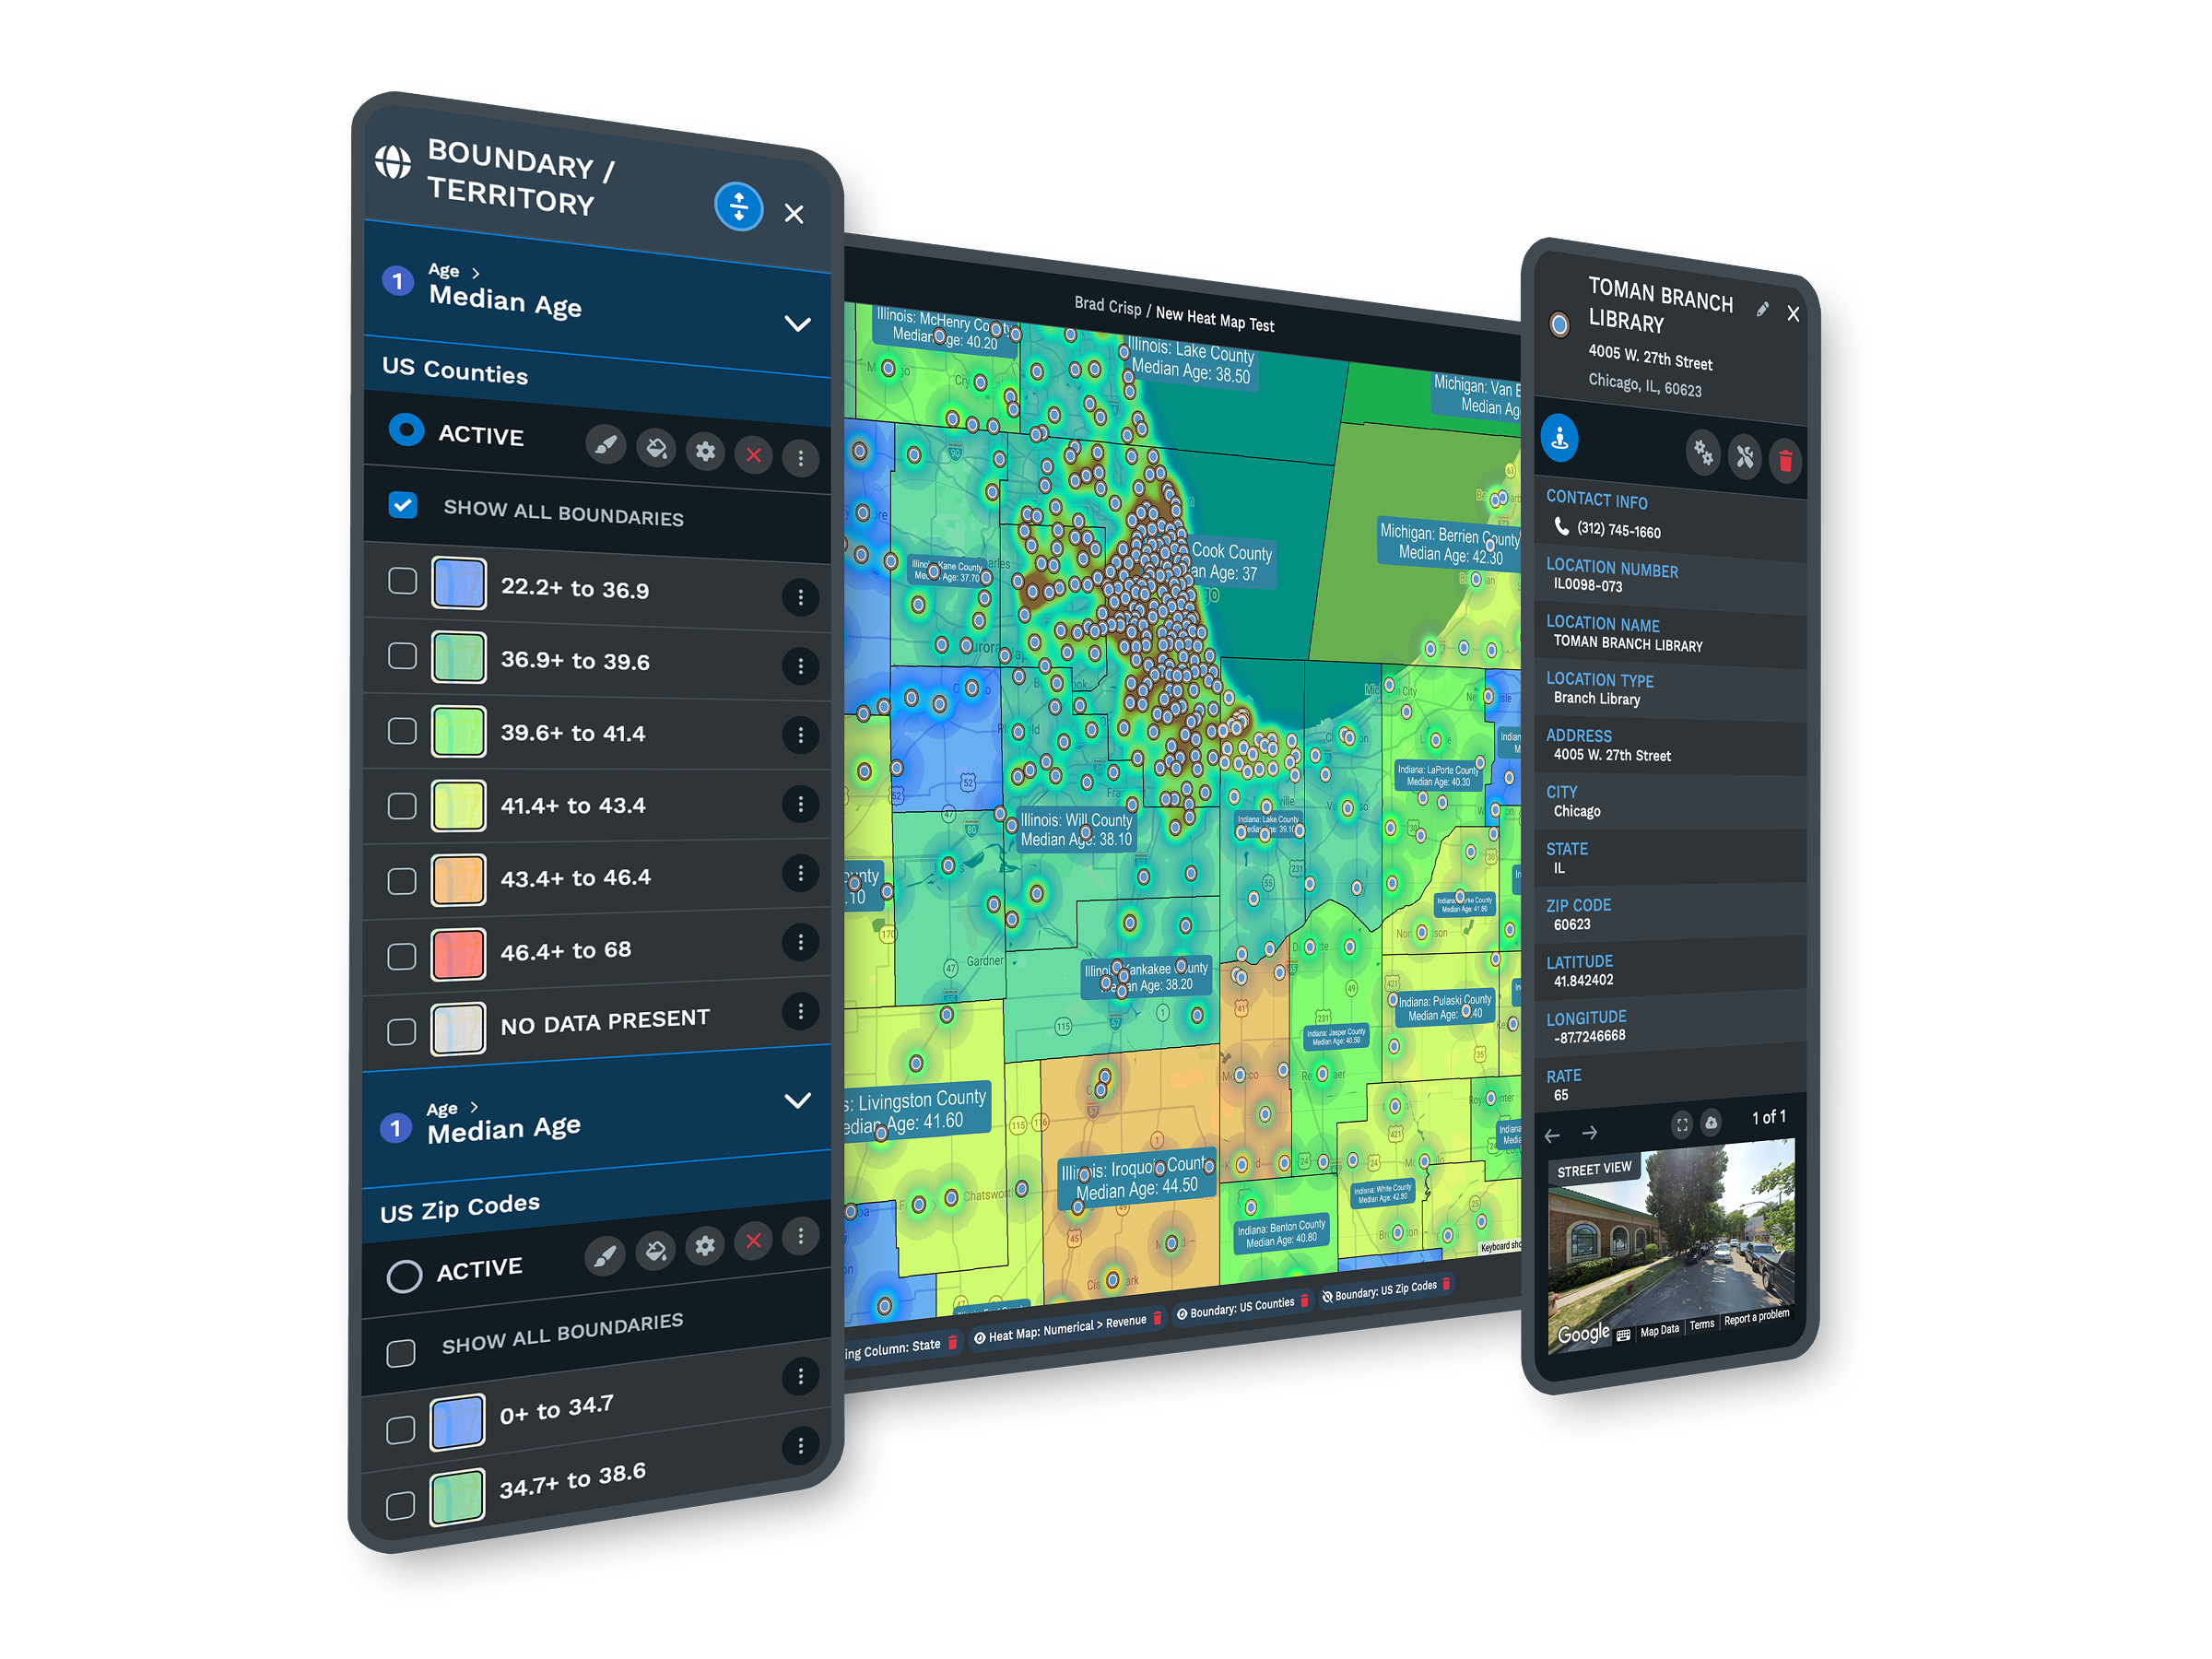
| 01 | Channel Coverage MappingPlot dealers and distributors over demographic and market data to see where reach overlaps and where open demand has no coverage. The map turns a roster of partners into a picture of the market. |
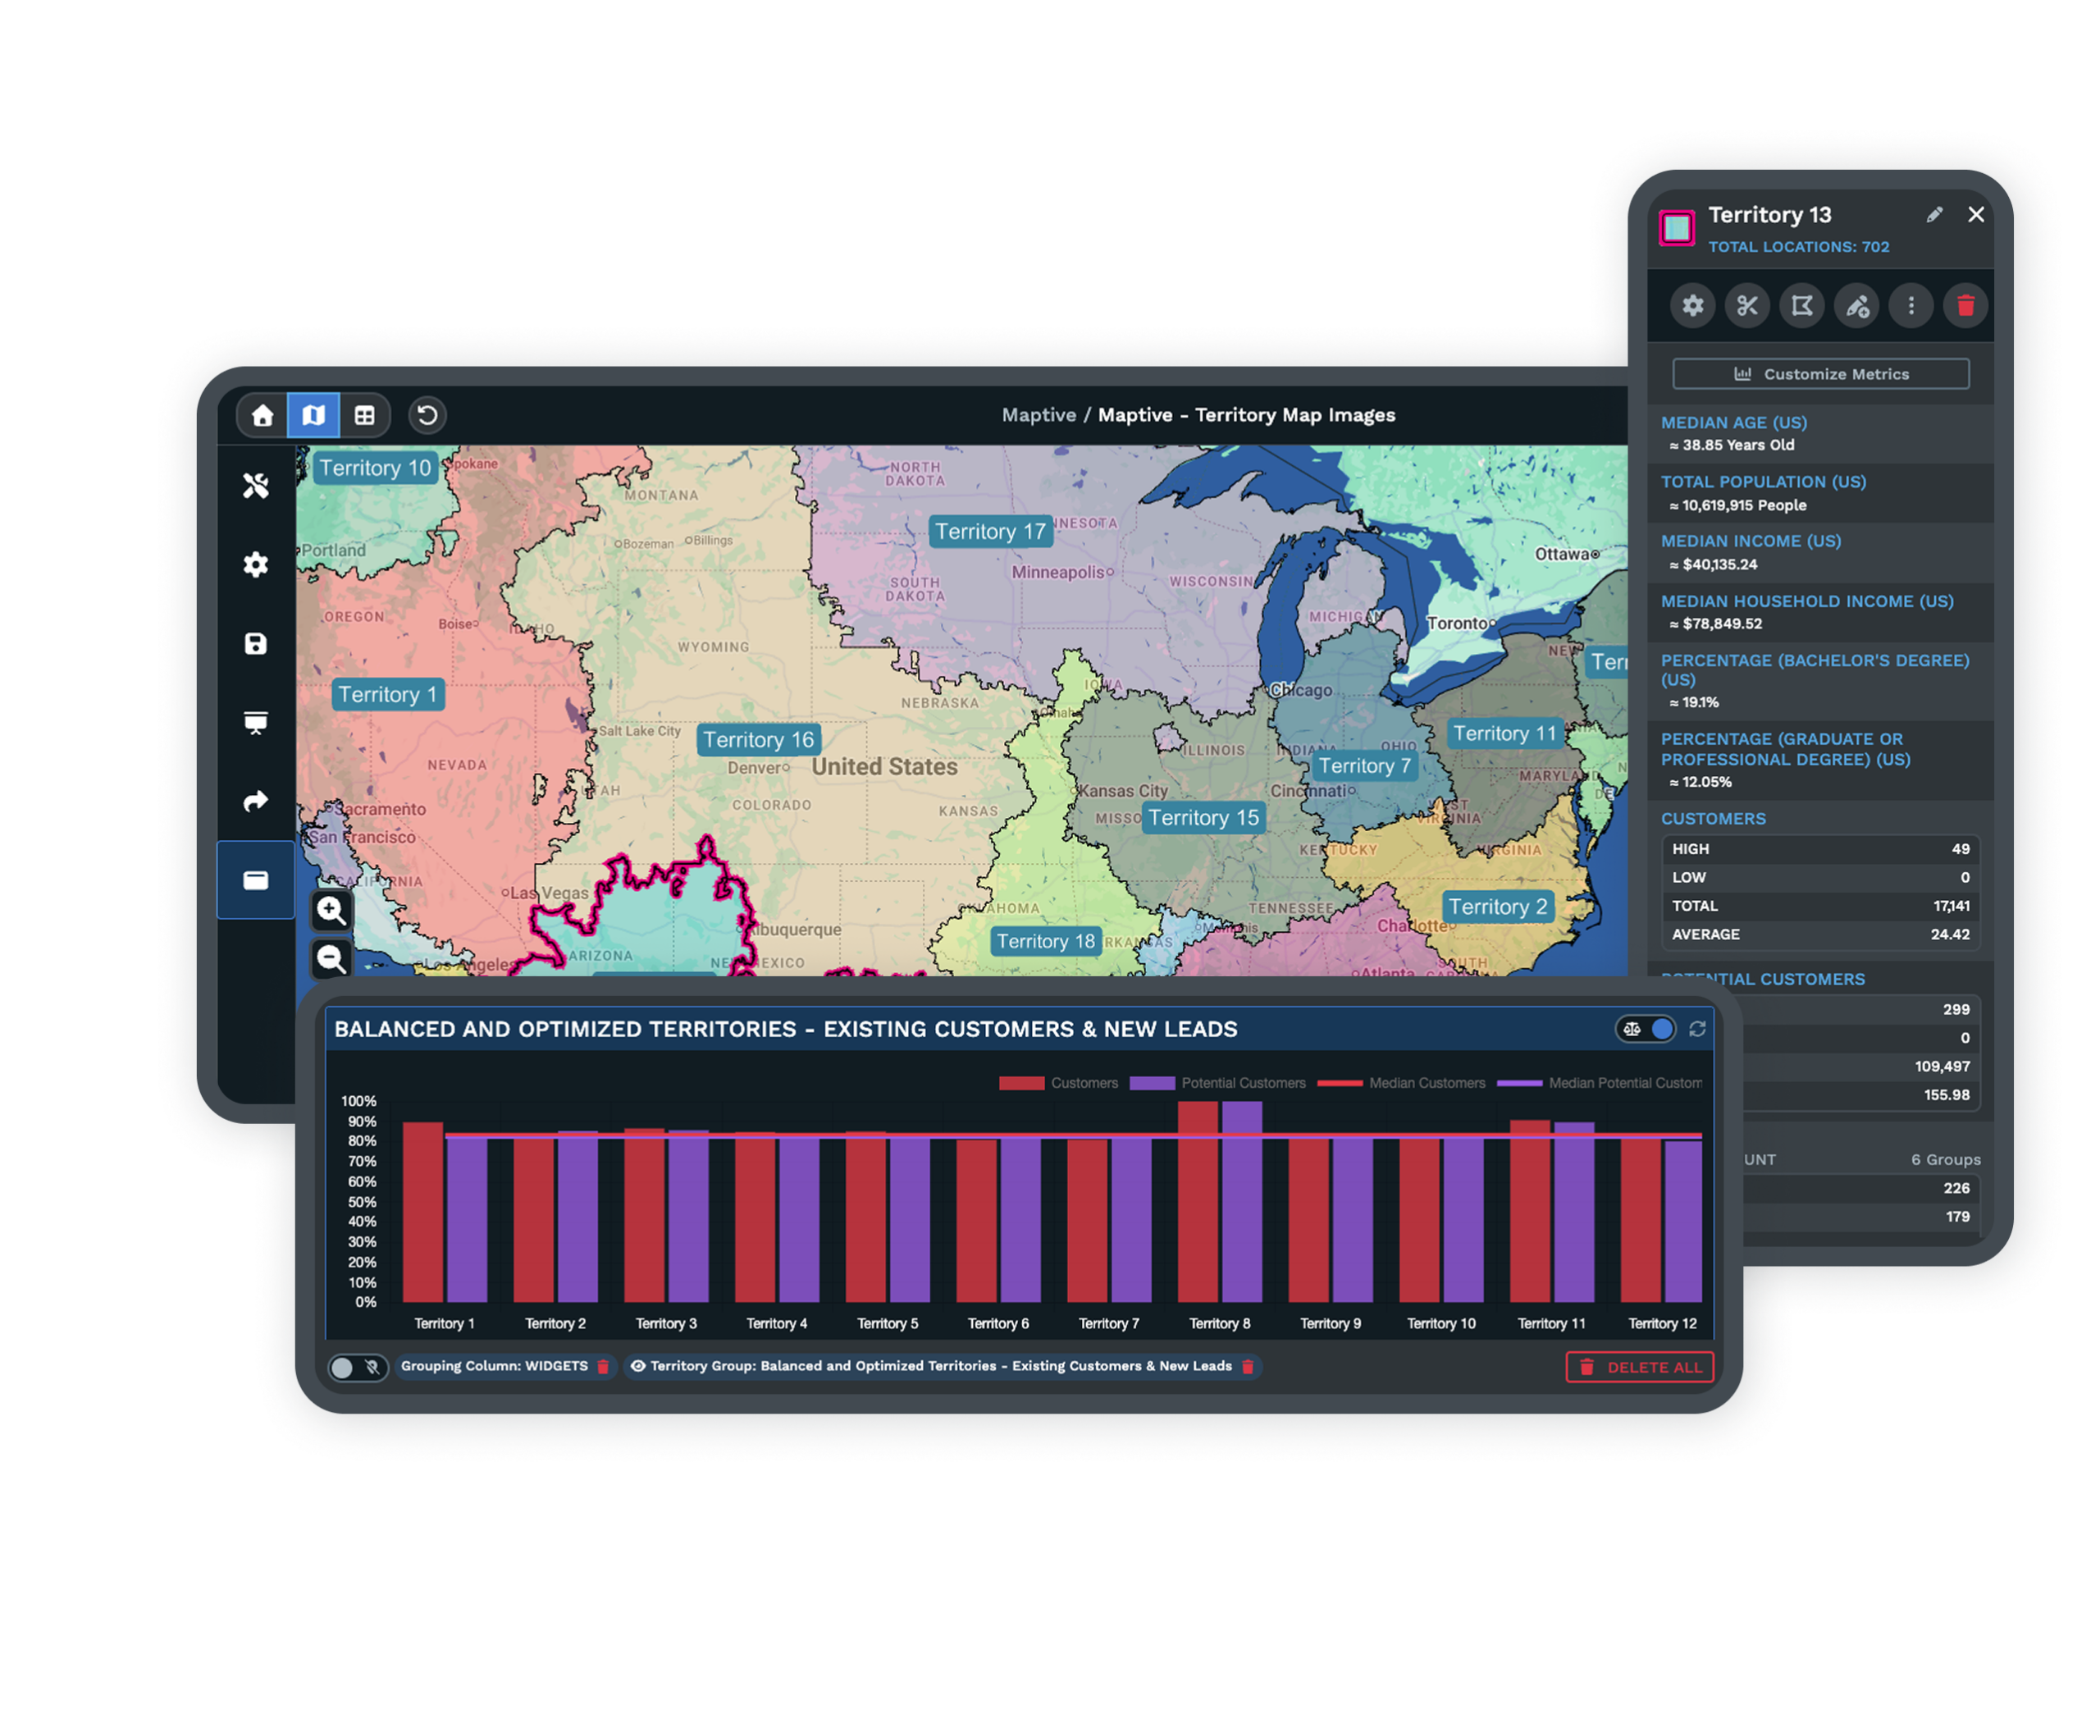
| 02 | Dealer and Distributor TerritoriesThe optimizer builds even territories from account density, revenue potential, and drive-time limits. A region that outgrows its rep gets rebalanced before sales or service slip. |
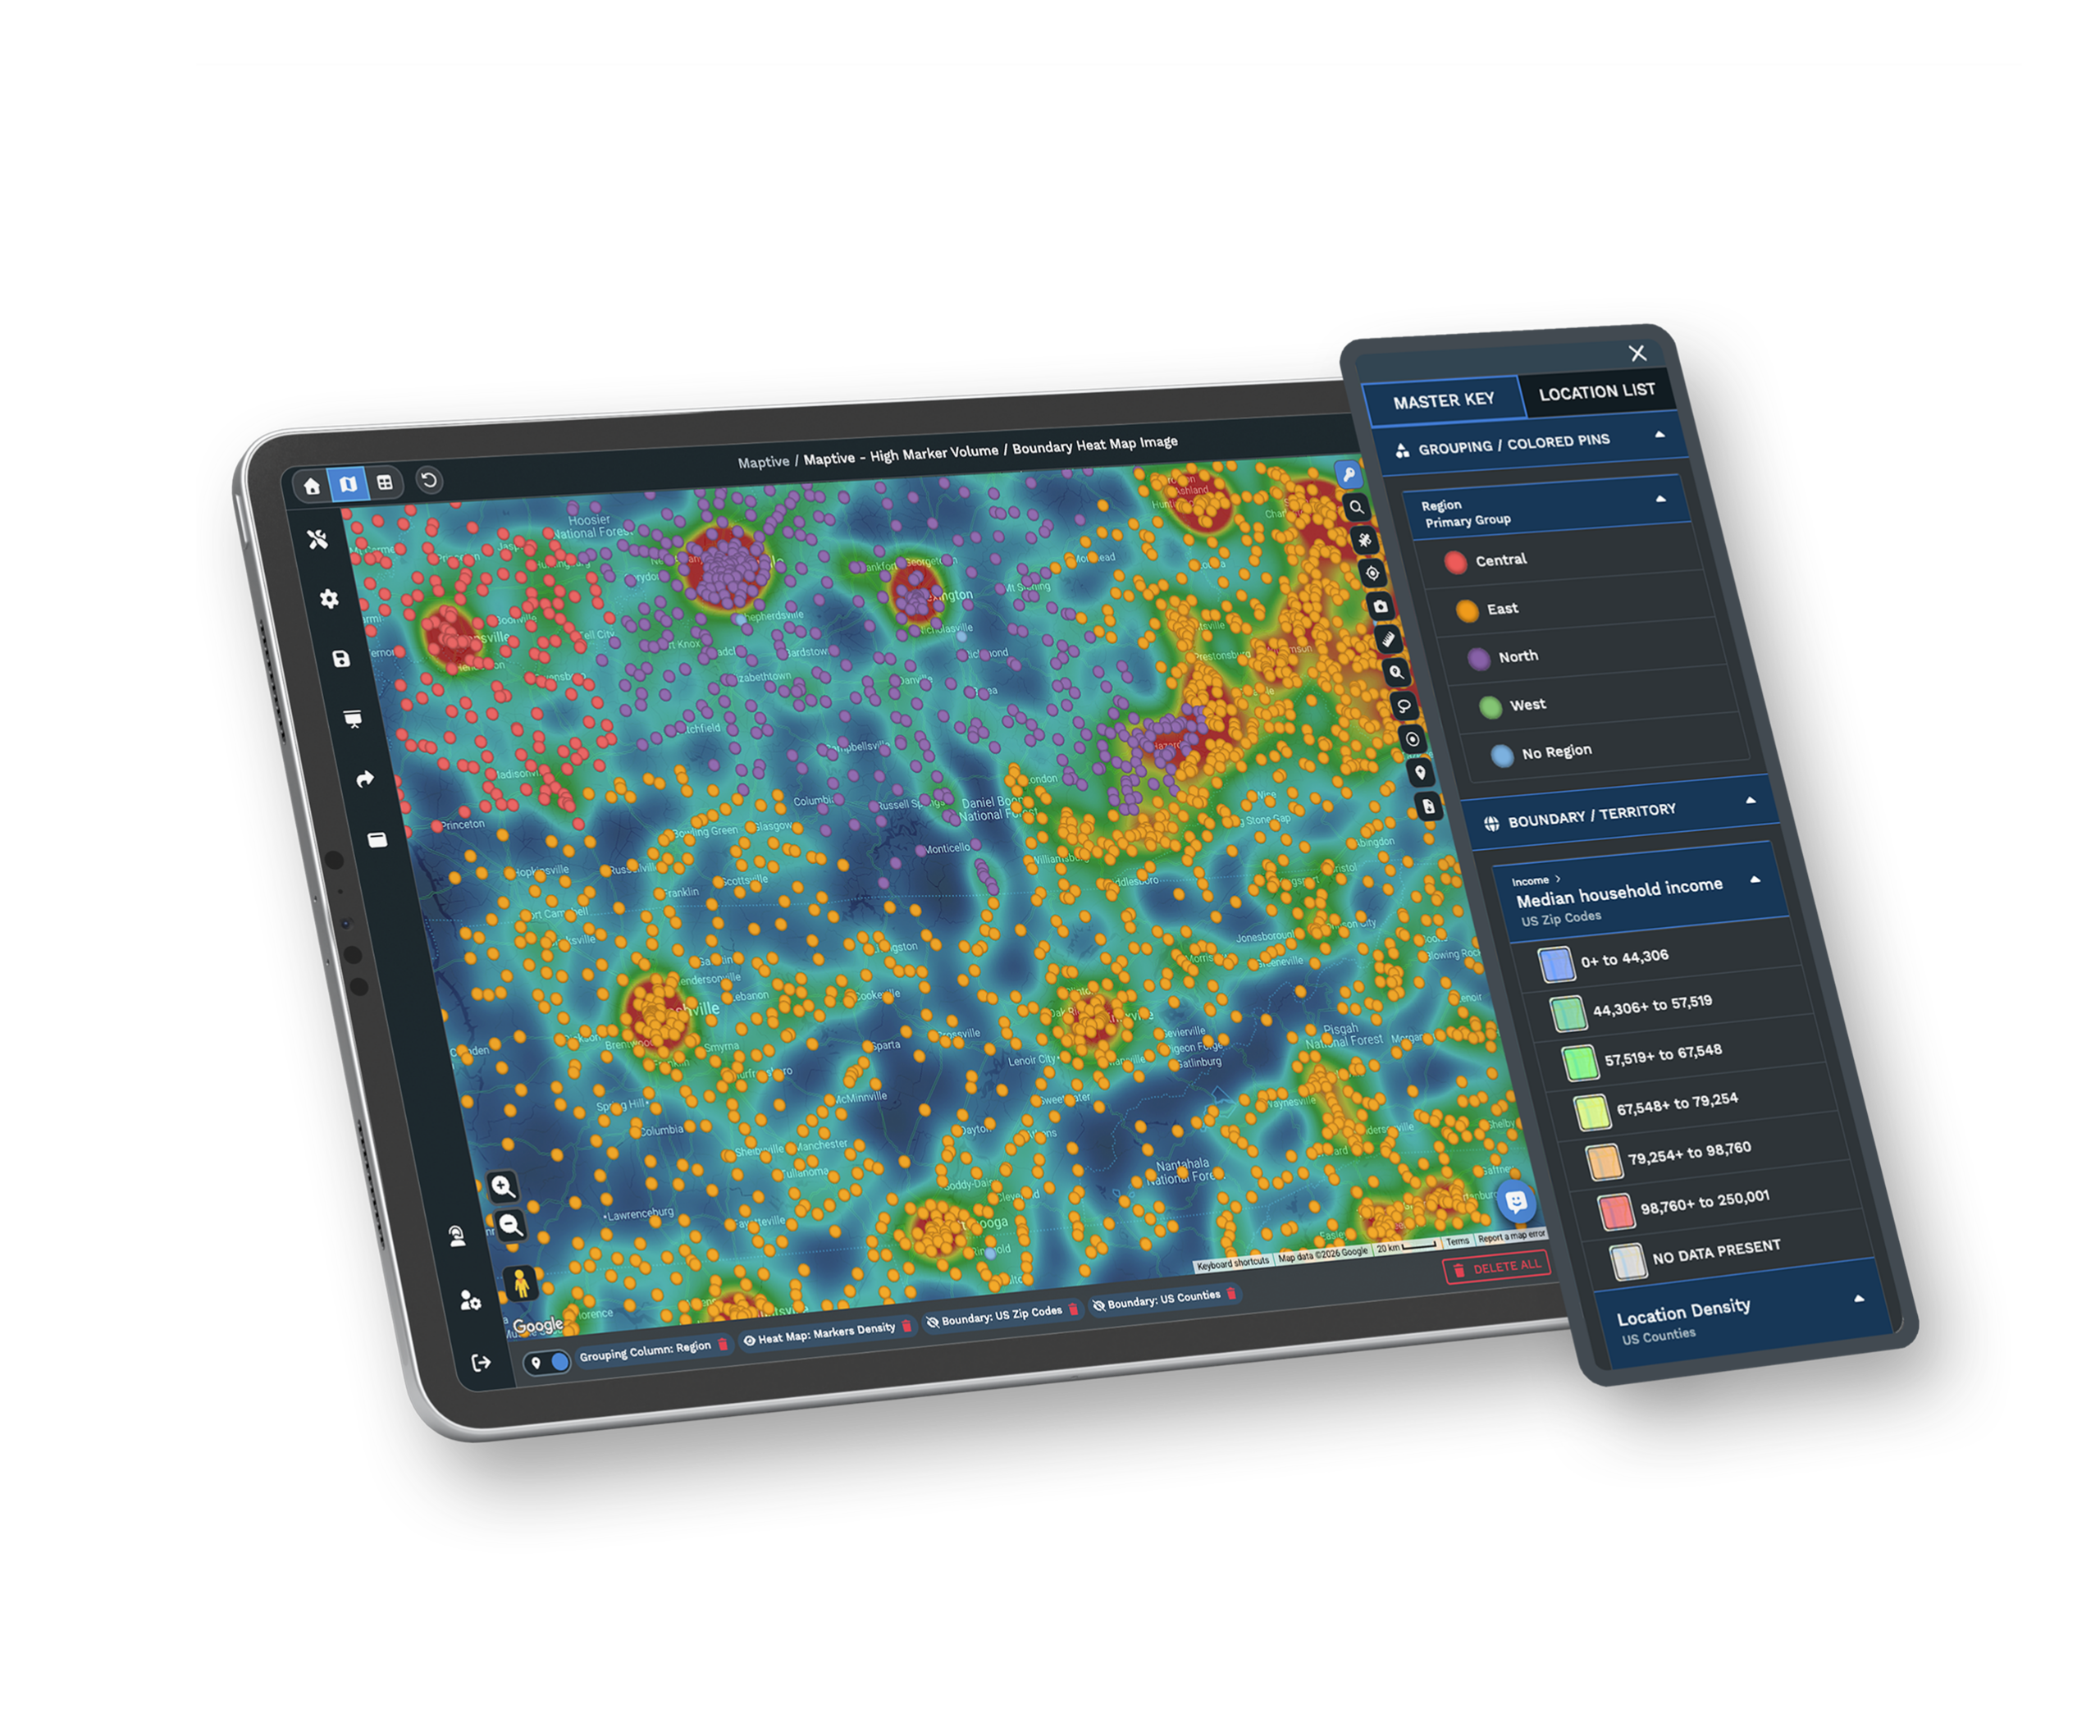
| 03 | Demand Heat MapsTurn sales volume, account count, or any numeric field into a weighted heat map. The concentration shows where demand is dense and where a new distributor belongs. |
| 04 | Drive-Time Distribution ReachDrive-time polygons show how far a plant, warehouse, or distributor reaches within a service window. Place the next point of distribution where it covers the most demand for the fewest miles. |
| 05 | Whole-Network CapacityUp to 200,000 markers load on a single screen, so the entire channel sits on one map. WebGL rendering holds up as the network grows. |
From Accounts to a Footprint
Turning an Account List Into Coverage
Most channel planning runs on internal numbers alone. A dealer that hit its target looks healthy, and one that missed looks like a problem, but neither number says anything about the demand around the partner. A distributor doing solid volume in a thin market is performing well, while one doing the same volume where the market is far larger is leaving sales on the table. Maptive puts performance and market data on the same map, so you see which regions need another partner, which dealers deserve more support, and where new distribution would open demand no one is reaching.
Planning the Distribution Footprint
Automated optimization balances coverage, drive-time, and demand across every territory at once, and scenario testing lets you add a distributor or split a region and see the effect on surrounding partners before anything is committed. Drive-time polygons show how far a plant, warehouse, or distributor reaches, so a new point of distribution lands where it covers the most demand for the fewest miles. The split-screen view holds the map and the data side by side, so a boundary change and its effect on coverage update together, and the question moves from who covers an account to what the footprint should be next year.
Distribution at National Scale
Distribution Brands on Maptive
General Electric, Volvo, Bridgestone, and Frito-Lay run distribution and location work on the platform, each after its own security review. A regional network and a national channel use the same tools, with capacity to scale.
Procurement-Ready Security
Maptive includes 256-bit SSL encryption, two-factor authentication, single sign-on, role-based access, and audit logging, with 99.9% uptime and a passed Salesforce AppExchange security review. It runs on Google Maps Platform infrastructure, so a national network stays responsive on one map.
Support for Channel Teams
The US and Canada support team responds in under 15 minutes, with a 9.7 out of 10 rating, and helps you load your account file and set up your first map. The specialists understand territory and coverage work, so the help is specific.
Free trial, full platform, no credit card
Map Your Coverage Free
Spin up a ten-day free trial, no credit card required. Upload your distributors, dealers, and accounts, layer the market data that defines demand, and draw drive-time coverage around your network. Every territory and analysis tool is unlocked from the first login, so you can test a real coverage plan against your own data.
See Your Channel in a Live Demo
For manufacturers and distributors that evaluate tools through a formal process, a Maptive specialist will map your partners and accounts and run the coverage, territory, and drive-time tools on them. This suits teams comparing platforms or needing sign-off before a trial. Bring your channel data, and the session works through your network rather than a sample.
Frequently Asked Questions
What is distribution mapping software?
Distribution mapping software plots a dealer or distributor network on a map and adds the demand and territory data needed to manage it. Maptive shows your distributors, dealers, and accounts together, layers market and demographic data underneath, and reveals where coverage overlaps, runs thin, or leaves demand unserved. Manufacturers and distributors use it to balance territories, decide where to add a partner or facility, and benchmark each location against its market, all from an account file they upload.
How does Maptive help manage a dealer or distributor network?
You upload your partners and accounts, and Maptive plots them on one map with market and demographic data underneath. From there you can see coverage at a glance, weight a heat map to find where demand concentrates, and draw drive-time polygons to measure how far each partner reaches. Territory tools then let you balance assignments and plan where to add distribution. The result is one view of the whole channel, instead of regional spreadsheets that never line up.
How do I find gaps in channel coverage?
Plot your dealers and distributors over demographic and market data, then use heat maps to see where demand concentrates. Where strong demand sits outside any partner's drive-time reach, you have a coverage gap and a case for adding distribution. Because the analysis runs on one map, a gap that would be invisible in a regional sales report becomes obvious, and you can quantify the demand inside it before deciding if it justifies a new dealer, rep, or facility.
Can Maptive balance distributor or rep territories?
Yes. The automated optimizer builds even territories from account density, revenue potential, drive-time limits, and the fields you upload, then rebalances when a region outgrows its rep or distributor. You weight the factors that define a fair territory, preview the split before publishing, and adjust any boundary by hand. Balanced territories keep one partner from being overloaded while another runs thin, and the plan recalculates against current data whenever your accounts or assignments change.
How does benchmarking a partner against its market work?
You put each partner's performance number beside the demand its territory can support. Maptive layers census and market data under every location, so a dealer doing solid volume in a thin market reads differently from one doing the same volume where the market is far larger. The first is performing well against its ceiling, the second is leaving sales unclaimed. Seeing both on one map reorders priorities around opportunity, not raw volume that ignores the market around them.
Can Maptive help decide where to place a new distributor or facility?
Yes. Draw drive-time polygons around a candidate plant, warehouse, or distributor to see how far it reaches within a service window, then layer demand data underneath to find where a site covers the most customers for the fewest miles. Scenario testing lets you add the location and watch how it shifts coverage for surrounding partners before anything is committed. That turns a placement decision, which often rests on a rough map, into a measured comparison of reach and demand.
What data is included for measuring demand?
Maptive includes more than 50 US Census variables at state, county, ZIP, tract, and block-group levels, covering income, density, age, and household composition, on every plan. A growing library of market data categories adds spending and industry detail alongside the census data. You map this against your own dealer, distributor, and account data, so demand is measured in the same view as your coverage, and a planning decision rests on the market rather than on internal sales history alone.
Can Maptive sync with our CRM?
Yes. You can import accounts and partners from any CRM through an Excel or CSV export, and Maptive also offers direct integrations that keep maps current as records change. Your CRM stays the system of record for account details, while Maptive becomes the layer that shows where those accounts and partners sit and what the demand around them looks like. The two work together, so the channel on your map matches the accounts your team manages day to day.
How large a network can one map hold?
A single Maptive map holds up to 200,000 markers, rendered with WebGL so the view stays responsive. Every plant, distributor, dealer, and account loads together rather than across separate regional files. That capacity is what lets you analyze coverage and demand at the network level instead of region by region, and it supports the territory and drive-time tools, since gaps and overlaps only appear when the whole channel sits on one screen at the same time.
Do I need a GIS background to use Maptive?
No. Maptive is built for sales, operations, and channel teams, not GIS specialists. You upload a spreadsheet of partners and accounts, the platform geocodes it, and the coverage, territory, and drive-time tools work through a plain interface. Most teams produce a usable coverage or footprint map in their first session, and support is on hand to set up the first map. The point is to put channel planning in the hands of the people who own it.

