
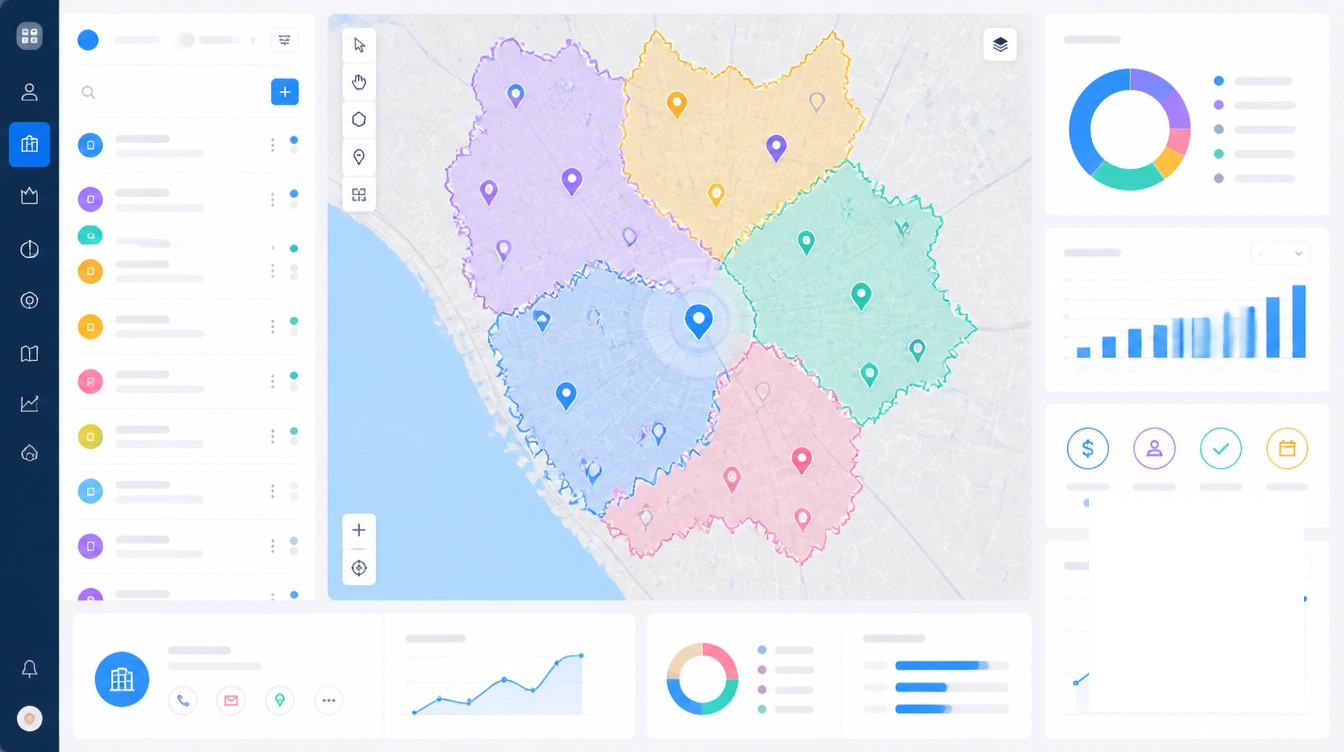
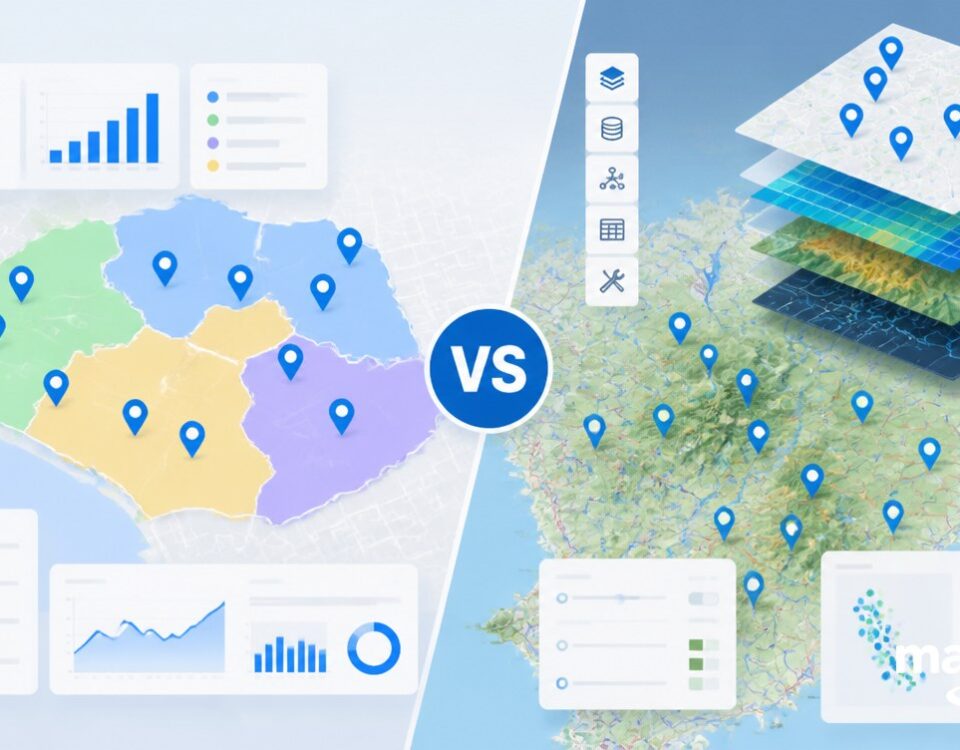
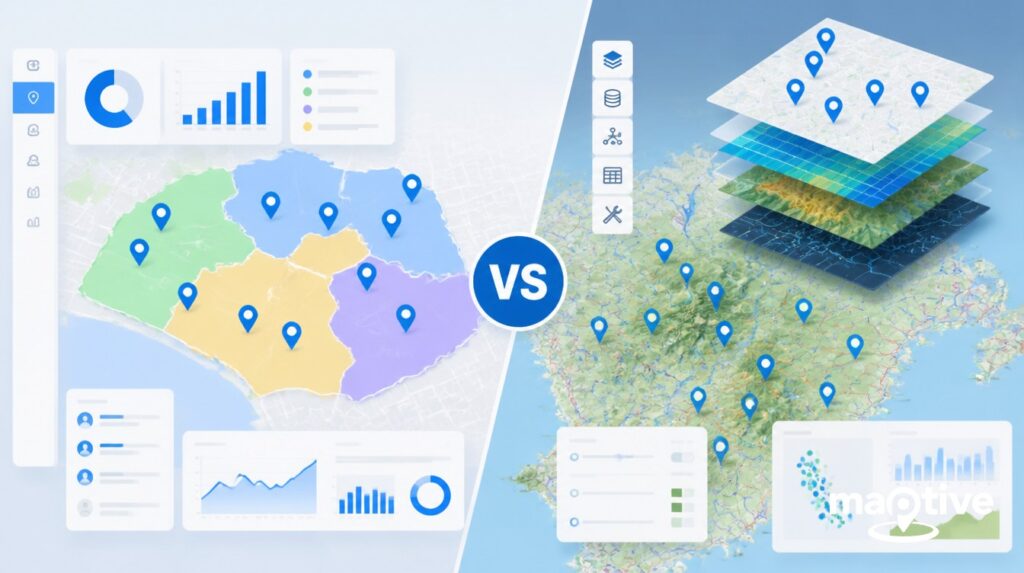
The value of pairing a CRM with mapping software comes from joining two different views of the same customer, the lifecycle record on one side and the spatial record on the other, so a sales team can act on both at once instead of choosing between them.
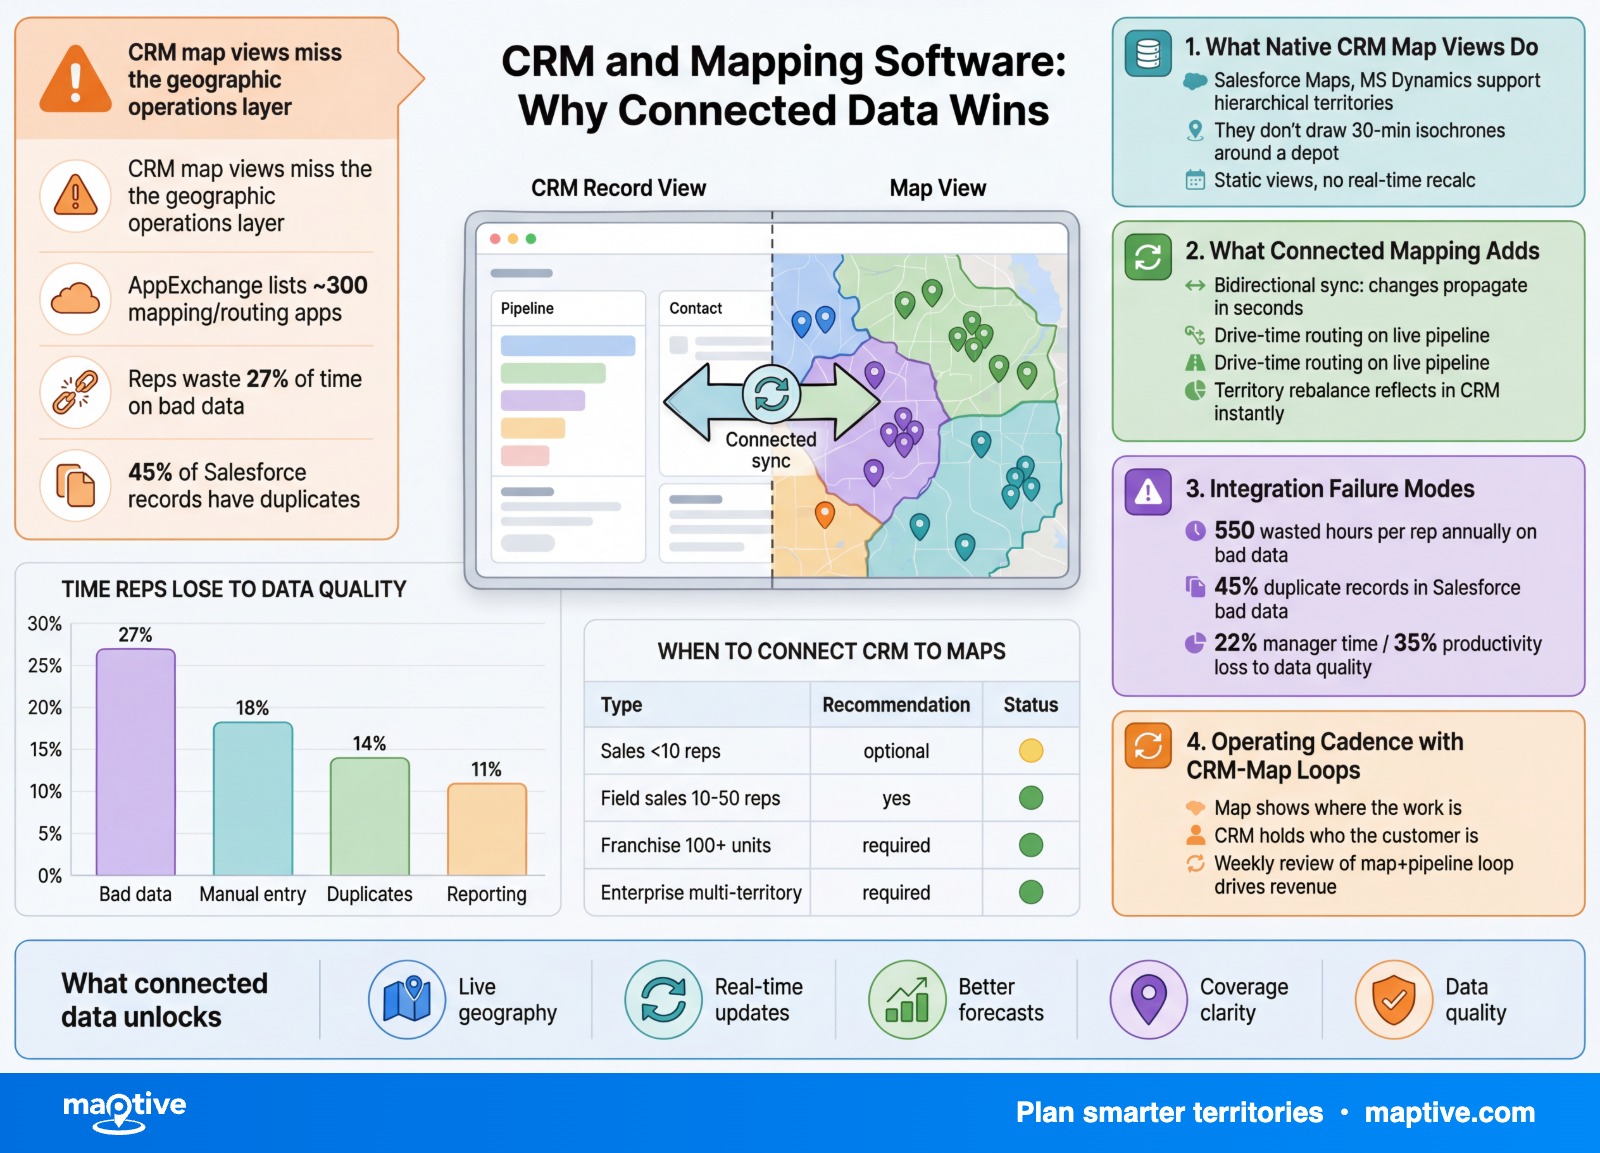
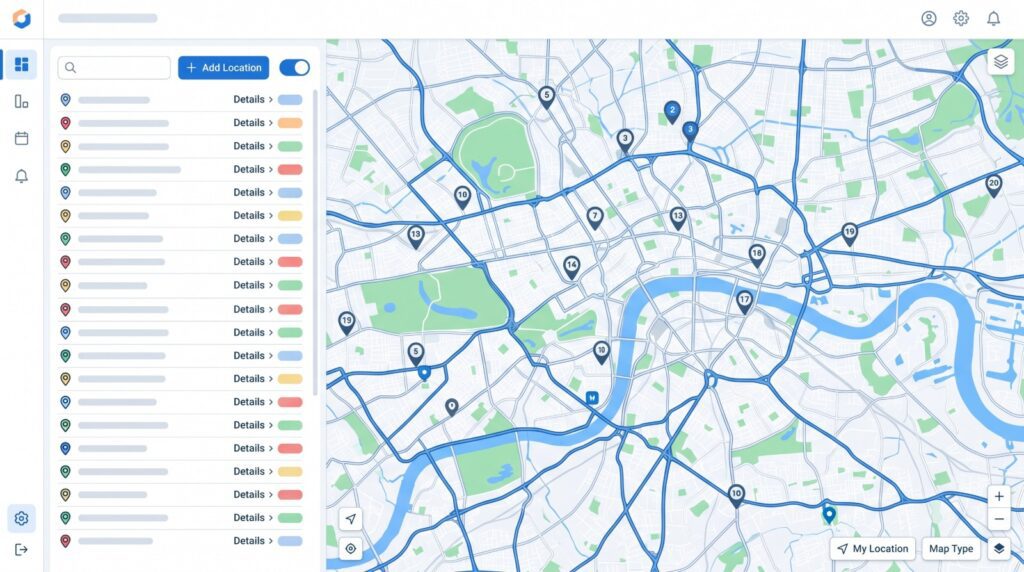
Most CRMs were built around accounts, contacts, deals, and activities, not around streets and zip codes. The native map view in Salesforce, HubSpot, Microsoft Dynamics, Zoho, and Pipedrive amounts to a pin-drop on a base map. It plots an address. It does not balance a territory, optimize a multi-stop route, render a heat density, or write a drive-time isochrone back to the account record.
That gap between data and decision is the entire reason teams add analytical mapping on top of their CRM. The rest of this article walks through what the native tools do, what connected mapping adds, how the integrations actually wire together, and the cadence that keeps both systems pointing at the same reality.
What Native CRM Map Views Actually Do
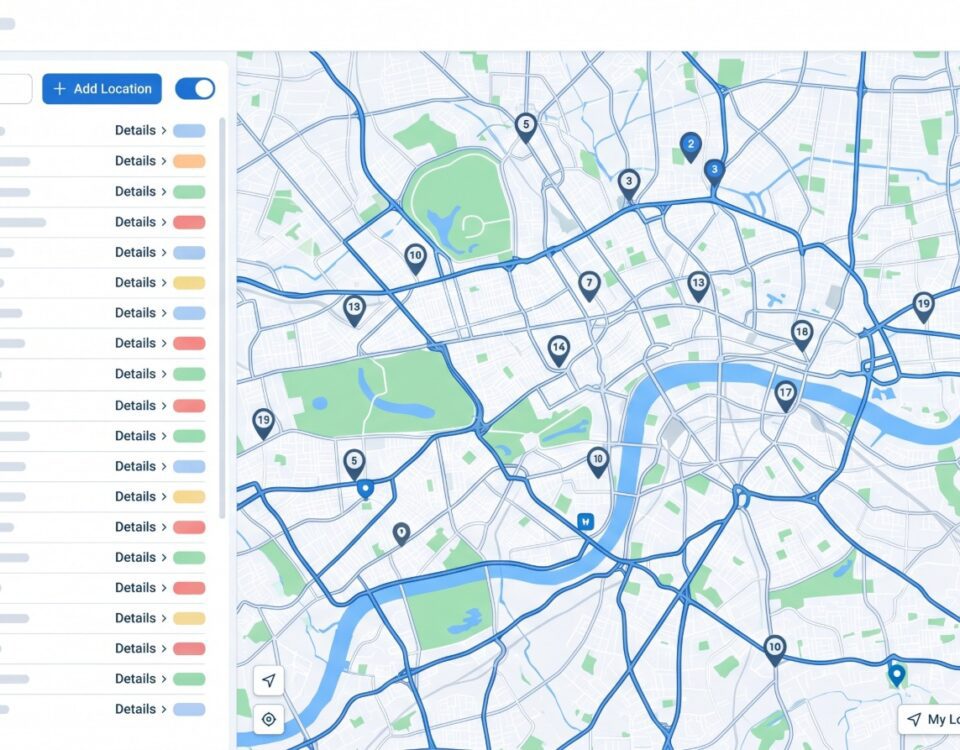
The native mapping surface inside a CRM is built for a single question, where are my accounts. Salesforce Maps, sold as a paid add-on to Sales Cloud, is the most capable of the built-in options. It supports basic territory planning, route building, and field visit logging. Customization is limited compared with third-party AppExchange apps, and users with non-Salesforce data sources resort to manual workarounds, which becomes time-consuming once a team grows past a handful of users. The AppExchange lists roughly 300 mapping and routing apps, a market size that exists because the native product is thin.
HubSpot has no built-in territory mapping at all. Teams handle territory assignment with workflow rules on country, state, or postal-code fields, or in Operations Hub Pro and Enterprise through a custom-code action that pulls a JSON file of territory definitions. Anything beyond rule-based assignment requires a Marketplace app.
Microsoft Dynamics 365 Sales supports hierarchical territory creation in the native CRM data model, but the hierarchy is administrative, not geographic. It has no native heat density, drive-time isochrone, or balancing algorithm. Pipedrive ships a Google Maps integration that surfaces pins inside the deal record and supports search, with no analytical layer at all. Zoho CRM has a similar Google Maps tie-in plus basic territory definitions, again without spatial analysis.
What none of these native views do is the math. They do not balance a territory by account potential, drive time, or rep capacity. They do not draw a 30-minute isochrone around a depot. They do not produce a heatmap of pipeline value by zip code, or flag a coverage gap by overlaying customer density on demographic data. That is the analytical layer that integrated mapping adds.
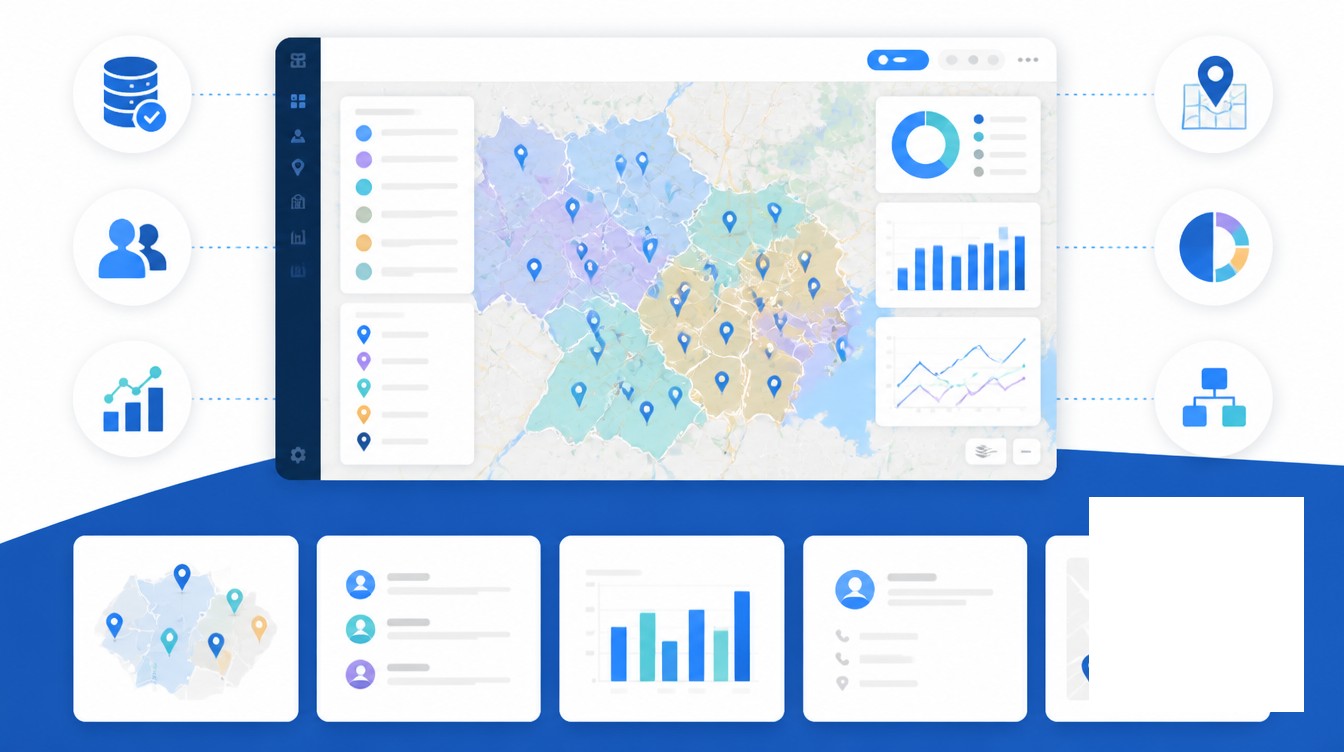
What Connected Mapping Adds to CRM Data
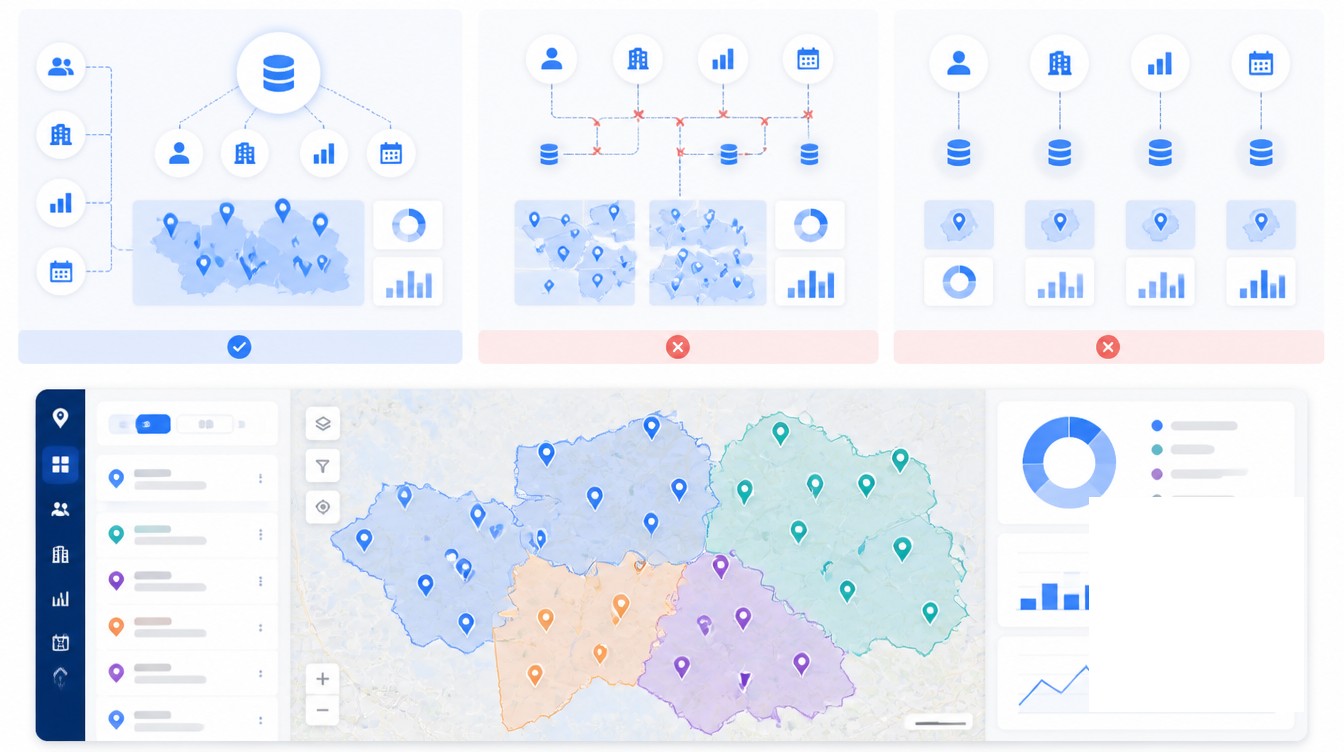
Connected mapping is bidirectional. Addresses on contacts and accounts are geocoded on import. Territory assignments calculated on the map are written back to a CRM field so workflow rules can route emails by territory. Visit logs, photos, and check-ins from the mobile mapping app post to the CRM activity timeline so managers see field reality without rep double entry. A change on either side reaches the other within seconds. Without that two-way sync, reps log visits twice, territory rosters drift, and reconciliation overhead piles up.
The use cases below all depend on that connection. Each one starts with a CRM filter and ends with a CRM update.
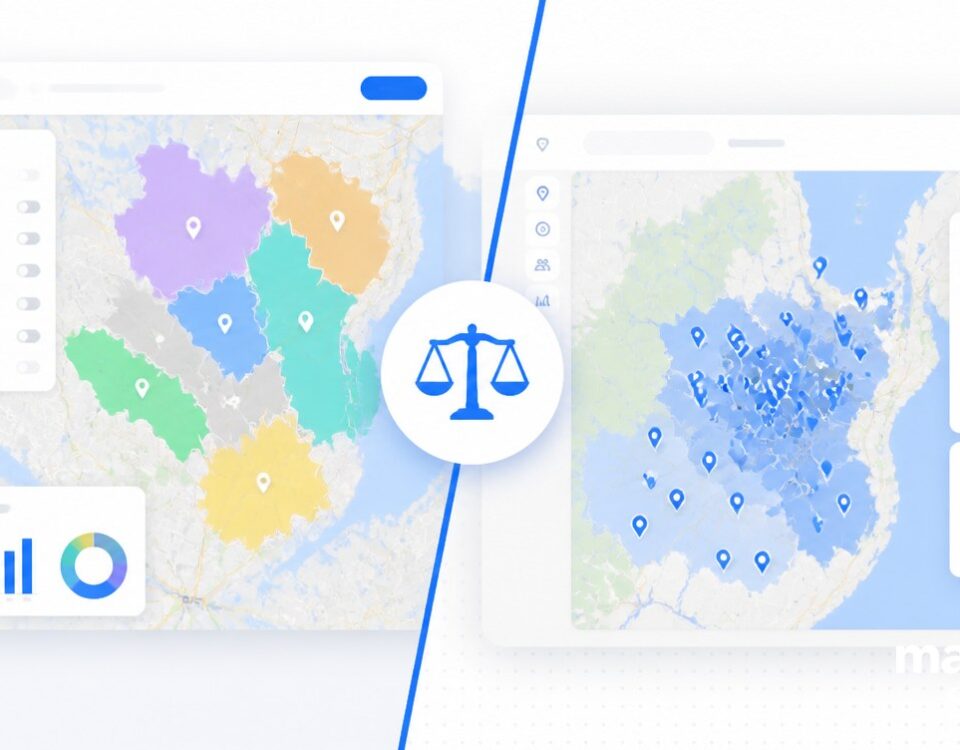
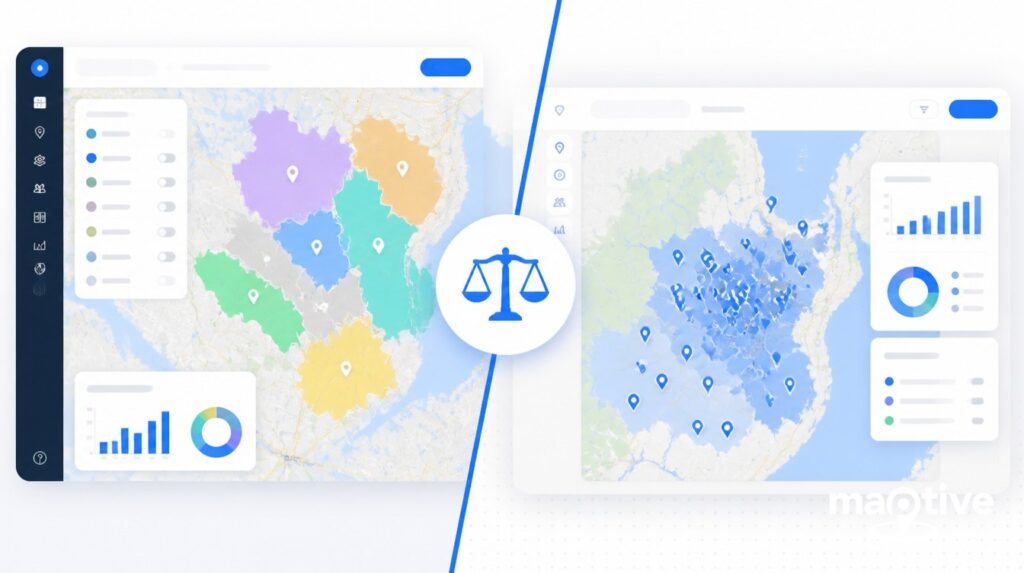
Territory Assignment and Balancing
Territory work inside the CRM alone is administrative, assigning a state code to a rep and trusting the workflow. Mapping software lets a manager draw or auto-balance territories using actual account density, revenue weighting, and drive-time constraints. Optimizing territory alignment is linked to a 7-14% increase in sales goal attainment, and as high as 30% improvement in some cases. A regional sales team that redrew boundaries by zip-code performance saw a 12% bump in average close rate.
Route Planning from CRM Filters
A rep planning a day in the field starts from a CRM filter, top accounts in a region with no visit in 60 days, or open opportunities above a certain stage. Connected mapping turns that filter into an optimized multi-stop route that respects appointment windows, meeting lengths, and live traffic. Documented results from route optimization include 20-40% more visits per day and 3-5 additional customer calls daily. A consumer packaged goods brand with 10 field reps cut average drive time per day by 30%, freeing up 1.5 hours per rep.
Pipeline and Deal Heatmaps
A heatmap of won deals, lost deals, or open pipeline by geography exposes patterns that disappear in a list view. A franchise chain used a heatmap to identify customer-demand zones with no nearby location and saw a 15% lift in quarterly sales after opening units in those zones. The same pattern applies to lost-deal heatmaps, which often reveal a competitive cluster or a service-radius problem rather than a sales-execution problem.
Whitespace and Coverage Analysis
Whitespace analysis cross-references CRM accounts against total market to find geographic regions with low penetration. External whitespace work is where mapping does the most lift, overlaying customer pins on demographic, firmographic, or business-count data to flag zip codes, DMAs, or counties where the company has weak coverage relative to opportunity. The CRM provides the customer list. The map provides the comparison set.
Field Activity Tracking
Mobile mapping apps record check-ins, visit duration, notes, and photos. With bidirectional sync, those activities post to the CRM contact or account timeline as logged calls or meetings. Reps stop entering the same visit twice. Managers see actual coverage against planned coverage in the same place they review pipeline. Mobile CRM users hit sales targets 65% of the time compared with 22% for those without mobile access, and businesses using mobile CRM are 150% more likely to exceed sales goals.
Lead Density for Marketing
Marketing pulls a different value out of the same connection. Lead origination heatmaps overlaid on the CRM lead object show which DMAs deserve paid spend, event sponsorship, or local landing-page builds. Geographic lead routing, where inbound leads auto-assign to the rep covering the prospect’s location, drives 15-25% higher conversion rates and 30-50% higher contact rates from time-zone alignment. Speed is part of that math. Contacting a lead within 5 minutes makes qualification 21 times more likely than waiting 30 minutes, and 78% of customers buy from the first business to respond.
Integration Patterns and Common Failure Modes
Five integration patterns cover most deployments. On Salesforce, a managed package installed from the AppExchange runs inside the org with field-level permissions and OAuth, which keeps data inside the Salesforce trust boundary. On HubSpot, a Marketplace app uses OAuth plus the native API and typically syncs companies, contacts, deals, and activities. For CRMs without a managed option, a REST API or middleware build pulls addresses, pushes geocoded coordinates, and writes territory assignments back. An iframe embed surfaces a map view inside the CRM record but does not write back, which limits it to read-only use. Low-code triggers through Zapier or Workato cover the edges, such as a closed-won deal creating a stop in the mapping tool.
The failure modes are predictable and almost always sit at the data layer rather than the software layer.
A pinned-only view without an analytical layer is the most common starting point. Reps see their accounts on a map and stop there. No routing math, no territory math, no heat density. The team gets a slightly nicer list view, not a sales-operations system.
Addresses imported but never geocoded show up as either zero pins or pins placed on a centroid of the postal code. That is the data problem mapping providers refer to when they require all five address fields, street, city, state, ZIP, and country, for rooftop geocoding. Major geocoding providers added millions of new rooftops and unit-level U.S. addresses across 2024, which raised the baseline for precision, but the input quality still governs the output.
One-way sync is the second-most common failure. Territories live in the mapping tool but never reach the CRM territory field, so workflow rules cannot route emails or assignments by territory and the map becomes a separate analytics product instead of an operating layer.
Stale geocoding is the third. A geocode performed once at import is never refreshed as accounts move or addresses are corrected. The dirty Salesforce data problem compounds this. An analysis of 12 billion Salesforce records found 45% were duplicates across organizations, jumping to 80% on API integrations. Every duplicate becomes a phantom pin on the map, and the heatmap gets read as truth.
The cost of dirty data flows directly into the field. Companies with poor data quality lose up to 22% of manager time and 35% of potential revenue. Sales reps waste 27% of their time dealing with bad data, the equivalent of 550 hours or about $32,000 per rep annually. Cleaning the address layer before connecting it to a map is rarely the exciting part of the project. It is the part that decides if the rest of the work returns anything.
Operating Cadence with CRM-Mapping Loops
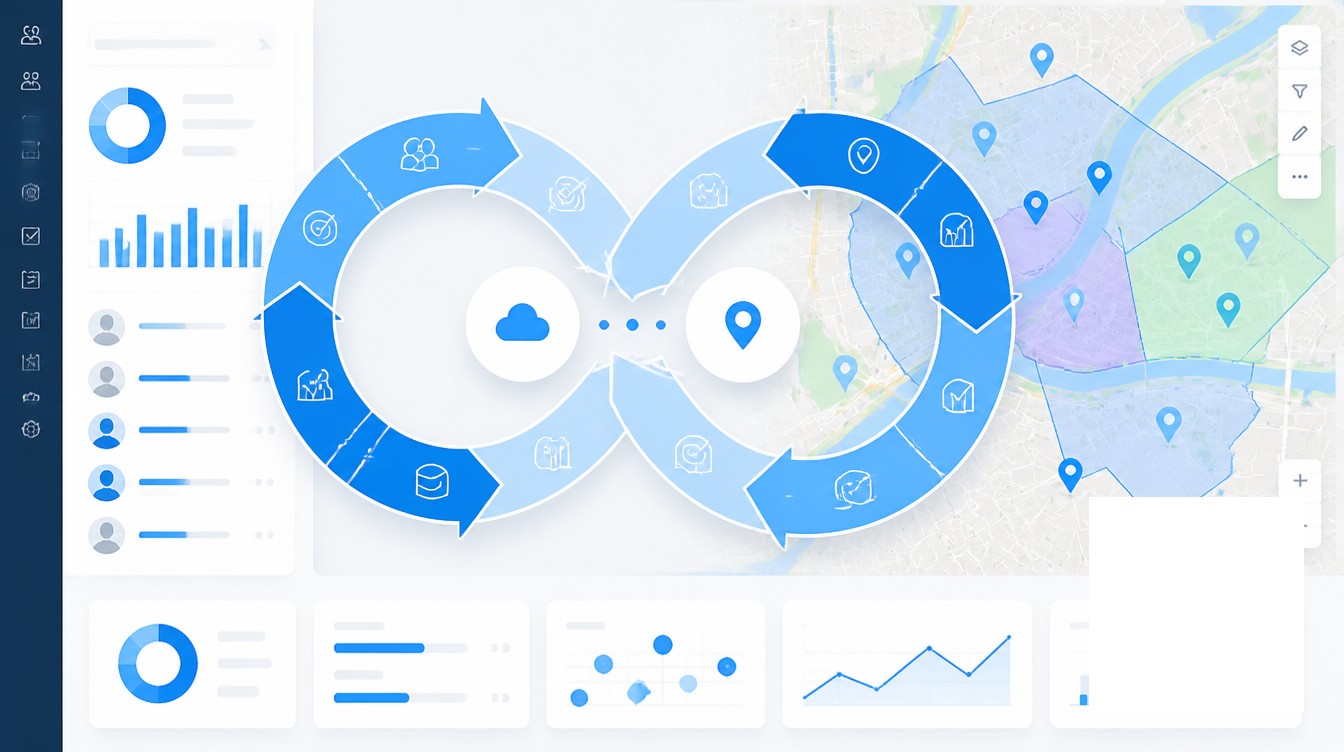
The integrations above are infrastructure. The cadence is what produces revenue. A connected CRM-and-mapping system pays back at three time scales, each with a different audience and a different decision.
Daily, Route and Visit Rhythm
Each morning, reps pull a route from a CRM filter applied to their territory, then push visit logs back into the CRM as they go. The point of the daily loop is to keep the map and the activity timeline in step with each other. Reps in the field with mobile access to the CRM hit quota 65% of the time compared with 22% without that access, and field-mapping integrations that write activities back to the timeline are the mechanism that keeps managers from chasing reps for visit reports.
Weekly, Pipeline and Coverage Reviews
Once a week, managers review pipeline and coverage on the map rather than in a list. The heatmap of open opportunities by stage flags clusters that need help and zones that are starving for activity. A planned-versus-actual visit overlay flags coverage gaps inside a territory before they show up in the forecast. The weekly cadence is where lost-deal heatmaps, whitespace flags, and rep-load comparisons get reviewed against the prior week, and where small territory tweaks happen without a full rebalancing exercise.
Quarterly, Territory Rebalancing
Once a quarter, or sooner after a material event such as team growth, a product launch, an acquisition, or a large customer win or loss, the territory map gets a formal review. Account density shifts, drive-time assumptions stop matching live traffic, and new whitespace appears. Rebalancing on a real map with real account weights is faster than rebalancing in a spreadsheet, and connected mapping pushes the new assignments back into the CRM as field values, which keeps lead routing, opportunity ownership, and reporting aligned with the new boundaries on the same day. Among teams treating revenue operations as a formal function, Gartner expects 75% of high-growth B2B companies to operate with a RevOps model by 2026, up from under 30% a few years earlier. Companies with a RevOps function report 36% higher revenue growth and up to 28% more profitability. Connected mapping inside the CRM is one of the operating layers under that growth.
The pattern across all three cadences is the same. The CRM holds who the customer is. The map shows where the work is. Connecting them turns customer data into a daily, weekly, and quarterly operating loop instead of a static report. Tools such as Maptive sit on top of the CRM rather than replacing it, which keeps the customer record canonical and the spatial work analytical.
Frequently Asked Questions
What is CRM mapping software?
CRM mapping software is a tool that connects to a customer relationship management system, geocodes the customer and account records inside it, and plots them on an interactive map. Sales and marketing teams use it to visualize territories, plan routes, build heatmaps, and analyze geographic patterns that are invisible in a list view. The mapping tool typically syncs bidirectionally with the CRM so changes to addresses, deals, and visits move between the two systems automatically.
Does Salesforce have built-in mapping?
Salesforce offers Salesforce Maps as a paid add-on that integrates geographic data with CRM records and supports territory planning, route optimization, and field visit logging. It is not included in the base Sales Cloud license, and its customization is limited compared with third-party AppExchange mapping apps. The AppExchange lists roughly 300 mapping and routing apps because of that gap.
How does HubSpot handle sales territories?
HubSpot has no native sales territory mapping. Teams assign territories with workflow rules based on country, state, or postal-code fields, or use a custom-code action in Operations Hub Pro or Enterprise to pull territory definitions from a JSON file. Most HubSpot users who want real territory mapping install a Marketplace app and connect it through OAuth.
How do I map customer data from my CRM?
Export contacts, companies, or accounts from the CRM as a CSV, or connect the CRM through an integration that pulls records directly. Make sure addresses include street, city, state, ZIP, and country for rooftop geocoding. Run the sync, let the mapping tool geocode the addresses, then choose how to visualize the data as pins, heatmaps, territories, or clusters. Push assignments and visit data back to the CRM through a bidirectional sync where supported.
What is sales territory mapping?
Sales territory mapping is the process of dividing a market into defined geographic or account-based regions, plotting customers and prospects from a CRM on a map, and assigning each region to a specific rep or team. It balances workloads, prevents coverage gaps, and is linked to a 7-14% increase in sales goal attainment when done well.
What is bidirectional CRM sync?
Bidirectional sync, or two-way sync, is a setup where any change in one system is reflected in the other within seconds. For CRM and mapping, that means a territory drawn on the map updates the CRM territory field, a new account in the CRM appears on the map within minutes, and a visit logged in the mobile mapping app writes back to the CRM activity timeline. Without it, data drifts and reps log the same information twice.
How accurate is CRM address geocoding?
Accuracy depends on address completeness. When all five fields are populated, providers can return rooftop geocoding accurate to the building. Junk data, abbreviated fields, missing postal codes, and stale addresses place pins hundreds of meters off. Confidence scoring and revalidation passes flag low-confidence results for manual review.
How does mapping software help field sales reps?
Mapping software combined with CRM data lets reps plan routes from CRM filters, gain 20-40% more visits per day, cut drive time by 25-30%, log visits from mobile that sync back to the CRM, and see customer context such as last visit, open deal value, and pipeline stage on the map before walking in. Sales reps using mobile CRM hit quota 65% of the time compared with 22% without.
What is geographic lead routing?
Geographic lead routing automatically assigns inbound leads to the rep covering the prospect’s region, based on location captured at form submit or enriched after. Companies using it report response times dropping from hours to single-digit minutes and 15-25% higher conversion rates from geographic matching. Five-minute response is 21 times more likely to qualify than a 30-minute response.
What is whitespace analysis in CRM?
Whitespace analysis is the practice of examining CRM data to find revenue opportunities that are not yet captured. Internal whitespace covers cross-sell and upsell into existing accounts. External whitespace covers geographic regions, industries, or segments where the company has low penetration. Mapping software makes external whitespace visible by overlaying CRM accounts on geography to show zip codes, states, or DMAs with weak coverage.
How does CRM data quality affect mapping accuracy?
Mapping is only as good as the underlying CRM data. Companies with poor data quality lose up to 22% of manager time and 35% of potential revenue. Sales reps waste 27% of their time on bad data, the equivalent of 550 hours or roughly $32,000 per rep annually. An analysis of 12 billion Salesforce records found 45% were duplicates across organizations, and every duplicate becomes a phantom pin on the map.
How often should sales territories be reviewed?
Most organizations benefit from a formal territory review during annual planning, with quarterly check-ins through a mapping tool tied to the CRM. Material events such as team growth, product launches, M&A, or large wins and losses should trigger an immediate reassessment. Connected mapping pushes updated assignments back into the CRM the same day, which keeps lead routing and opportunity ownership aligned with the new boundaries.


