
Every franchise candidate sitting through Discovery Day is asking one question, phrased a dozen ways. Will I make money in MY territory. Not if the brand makes money, not if the system works in aggregate, not if the unit economics in the FDD pencil out. The prospect wants to know about a specific polygon they plan to operate inside, and they want the answer in front of them, on a screen, before they sign.
Most franchise development teams answer a different question. They show the system. They show 312 dots on a national map. They walk through brochure demographics, average-unit-volume ranges, and a list of available zip codes printed in 11-point Calibri. The map a dev team brings to a closing conversation is a sales tool, not an analysis tool, and the teams that close treat it that way. The mismatch between the map a development team wants to show and the map the candidate wants to see is where qualified deals leak.
The 2024 Annual Franchise Development Report puts the leak in numbers. Leads convert to sales at 2.3%. Qualified leads convert at 10%. Applications at 28%. Discovery Days at 65%. The cost of acquiring a single signed franchisee in 2024 was $11,639, on a per-lead cost of $253. The leaks late in the funnel, after a brand has already spent $10,000 chasing a candidate, are the expensive ones. Almost all of them route through a map the candidate either could not read or could not see themselves inside.
Five Moments Where a Map Decides the Outcome

A map is not a single Discovery Day artifact. It appears five times in a franchise sale, each time answering a different question. The brands that close use a map at every one. The brands that lose late-stage candidates have usually skipped two or three.
Territory Availability Check (Pre-Qualification)
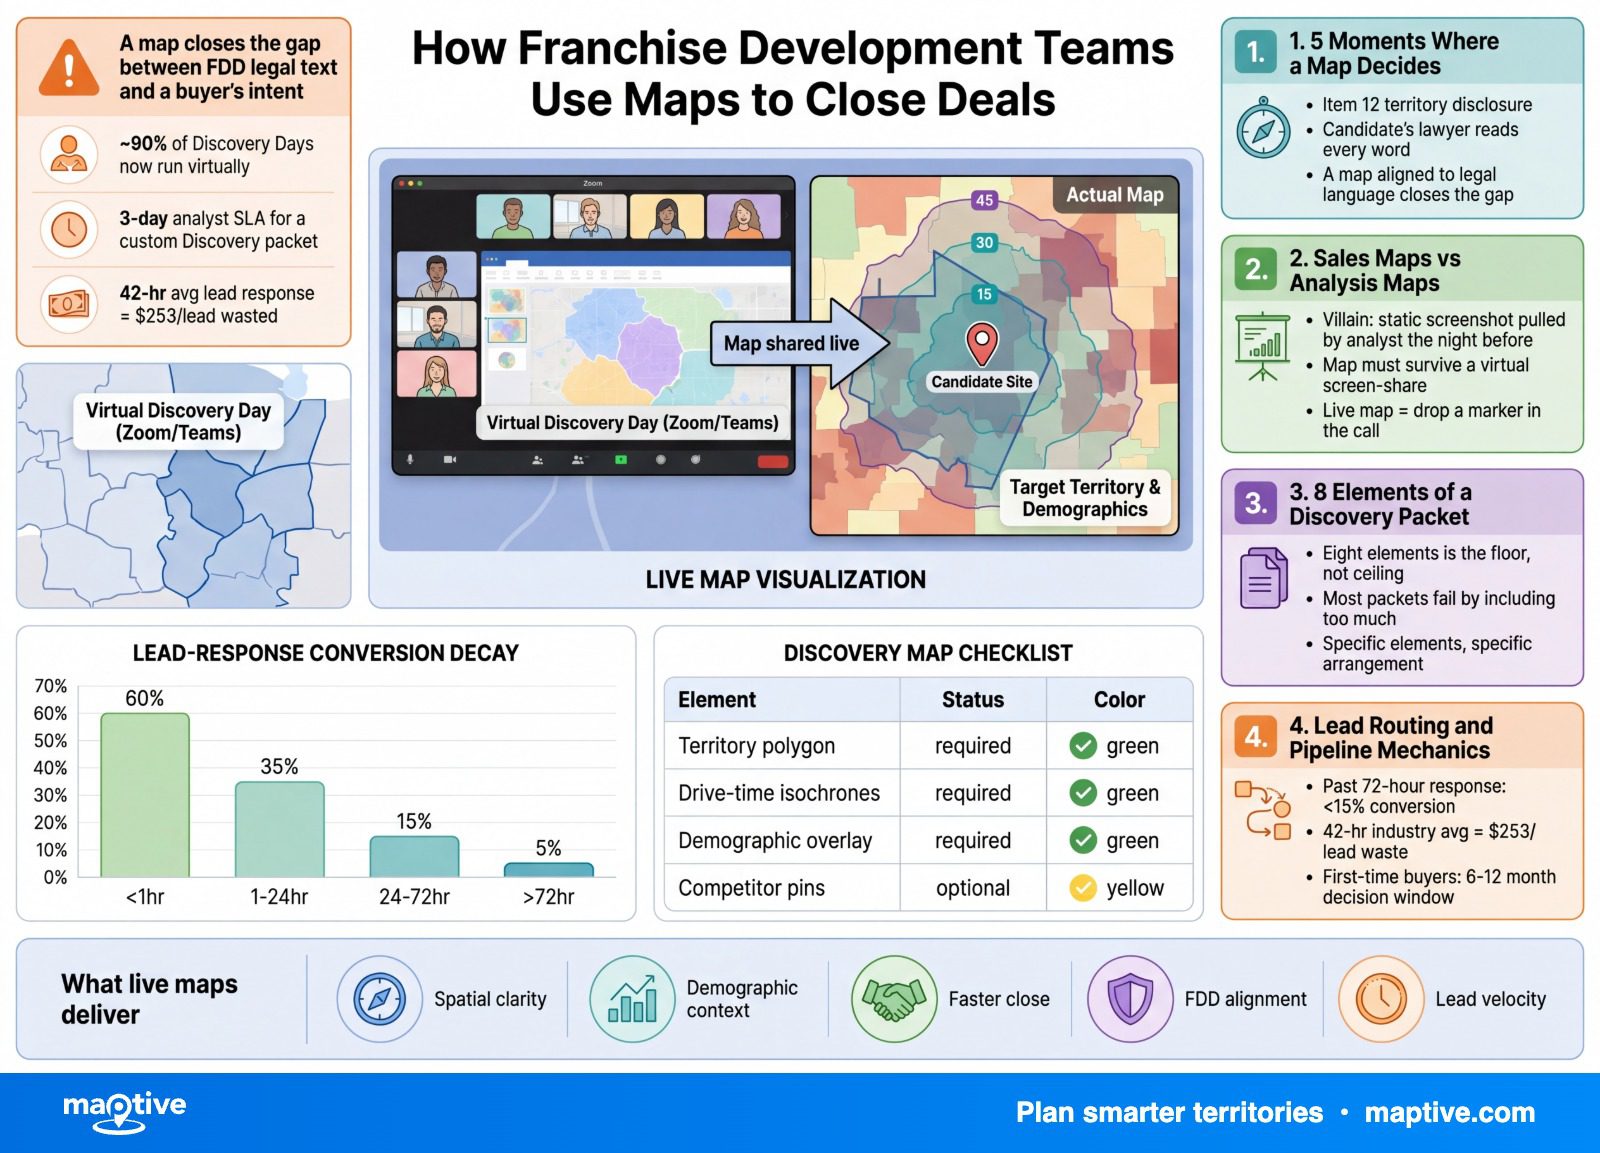
The candidate submits a zip code through a form fill. The development rep has a window of minutes to answer “is this open.” The MIT speed-to-lead research is unambiguous, and the franchise-specific data agrees. A response inside 5 minutes is 21x more likely to qualify than one at 30 minutes. A response inside 1 minute can lift conversion by up to 391%. Average B2B response time is 42 hours. Gravitas Consulting’s franchise data shows conversion drops below 15% past 72 hours.
A development rep cannot answer “is this open” in under a minute by checking a spreadsheet. They can answer it from a map layer that updates against the franchise CRM in real time. The territory-availability check is the first place the candidate decides if the brand has its operation together or if they are talking to a small business with an inbox.
Program Review Overlay (Mid-Funnel)
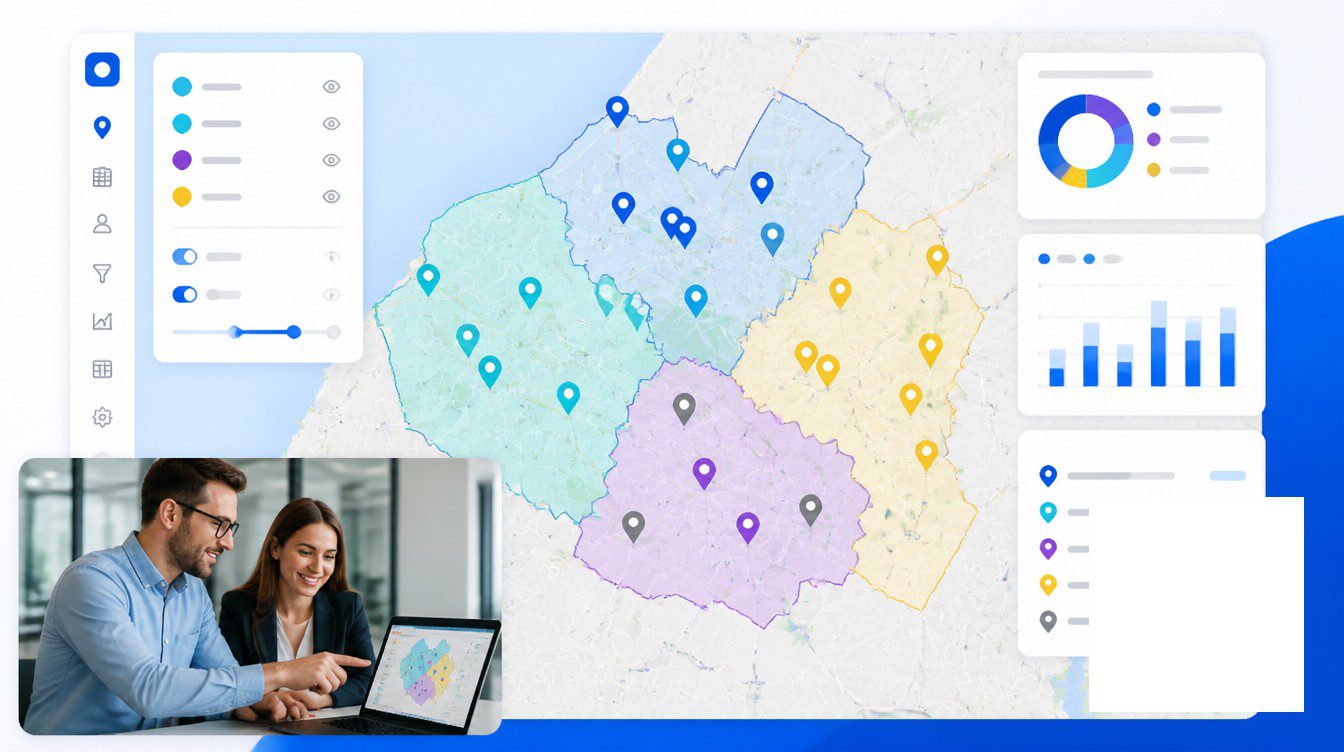
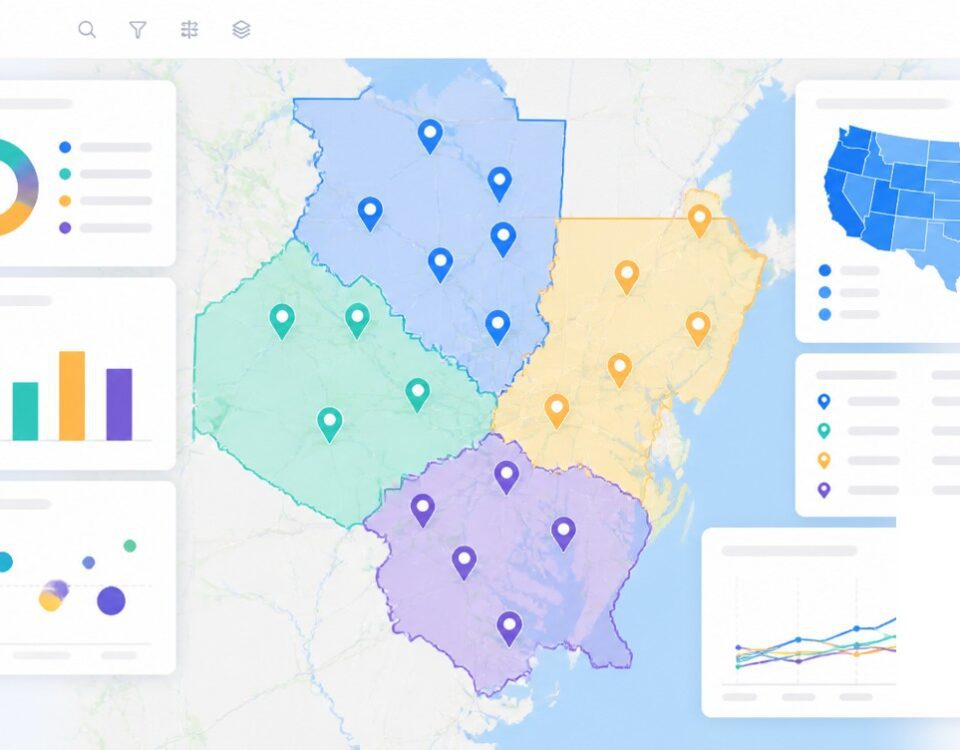
After the introductory call, the candidate names a target market. The program review is where the question shifts from “how does this franchise work” to “would it work for me, here.” A map that overlays the candidate’s named metro with available territory, existing franchisee locations, and a demographic snapshot moves the conversation into specifics. A brochure cannot.
Discovery Day Territory Packet (Late Funnel)
Discovery Day is where most franchisors invest their map budget, and rightly so. The 2024 closing ratio at Discovery Day stage was 65%. The candidate has cleared every other gate and is now sitting in front of leadership, in person or over video, evaluating a commitment of hundreds of thousands of dollars. The territory packet presented here is the artifact the candidate will photograph and send to their spouse, their lawyer, and their accountant. It needs to be specific, current, and legible without a guided tour.
FDD Item 12 Walkthrough
Item 12 of the Franchise Disclosure Document covers territory under the FTC Franchise Rule. It discloses if the franchise is sold for a specific location or an approved one, the method used to define size, the territory’s exclusivity status (exclusive, non-exclusive, or protected), and any carve-outs the franchisor reserves. The legal text takes 10 minutes to read aloud. A shaded polygon answers the same question in 10 seconds.
Item 12 is also where a development rep can lose a sophisticated candidate by skipping detail. The candidate’s lawyer will read every word. A map that aligns precisely to the Item 12 language closes the gap. A map that contradicts the FDD creates a compliance problem the franchisor will pay for later.
Validation Call Sample Selection
After FDD delivery the candidate calls existing franchisees. Best practice is 3 to 5 calls, 45 to 60 minutes each, with franchisees representing different market sizes and regions. A geographic view of the validation roster, with annotated tenure and demographic similarity to the candidate’s market, gives the candidate better calls and the development rep better outcomes. Validation is the stage where an undecided candidate makes up their mind. Calls with franchisees who operate in materially different markets do not move that decision.
Sales-Tool Maps Versus Analysis-Tool Maps
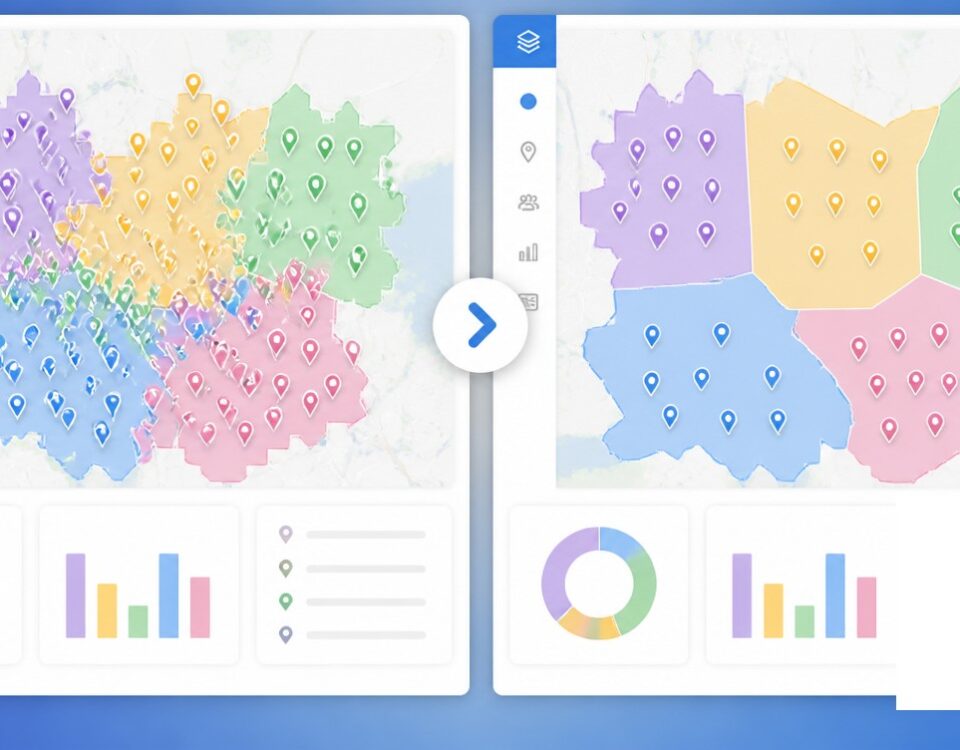
The dev team’s map and the real estate analyst’s map are different artifacts with different jobs. Most franchise development teams default to the analyst’s map because the analyst’s team already built one. That choice is why so many candidates leave Discovery Day with a copy of a deck they cannot read on their phone.
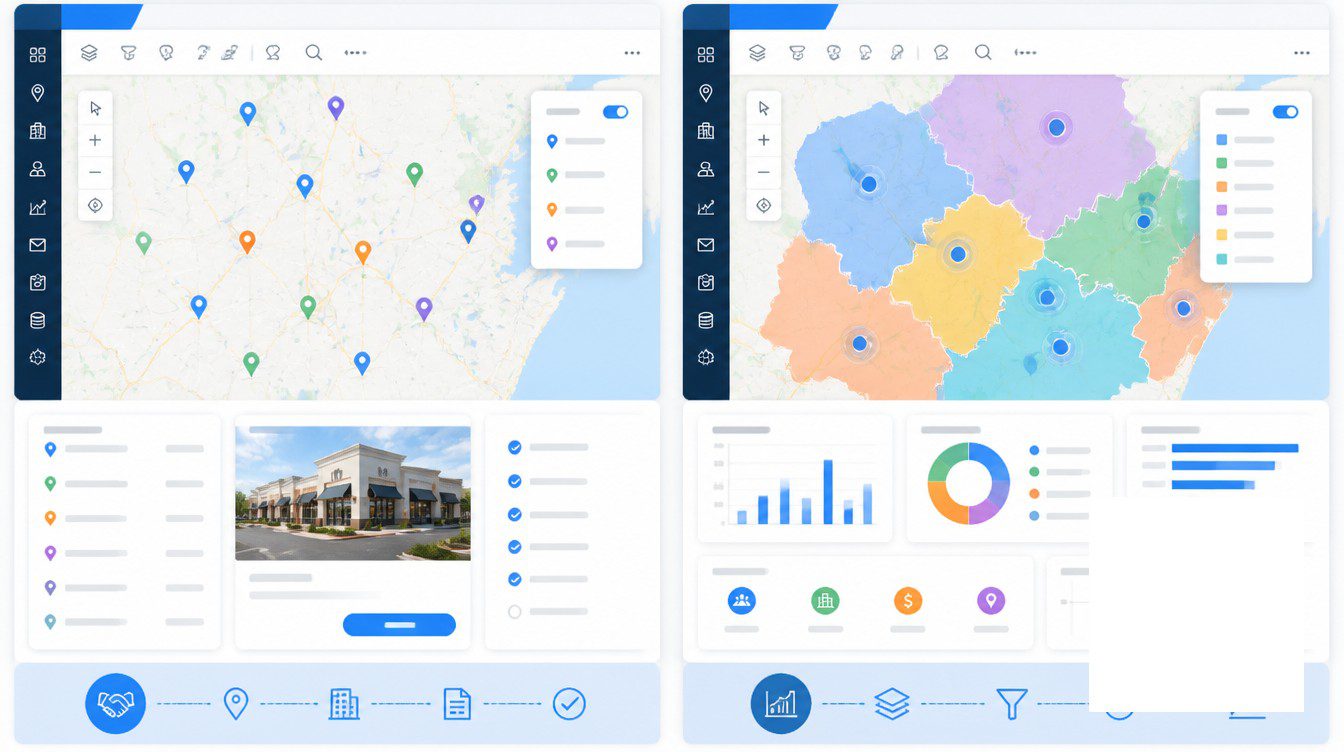
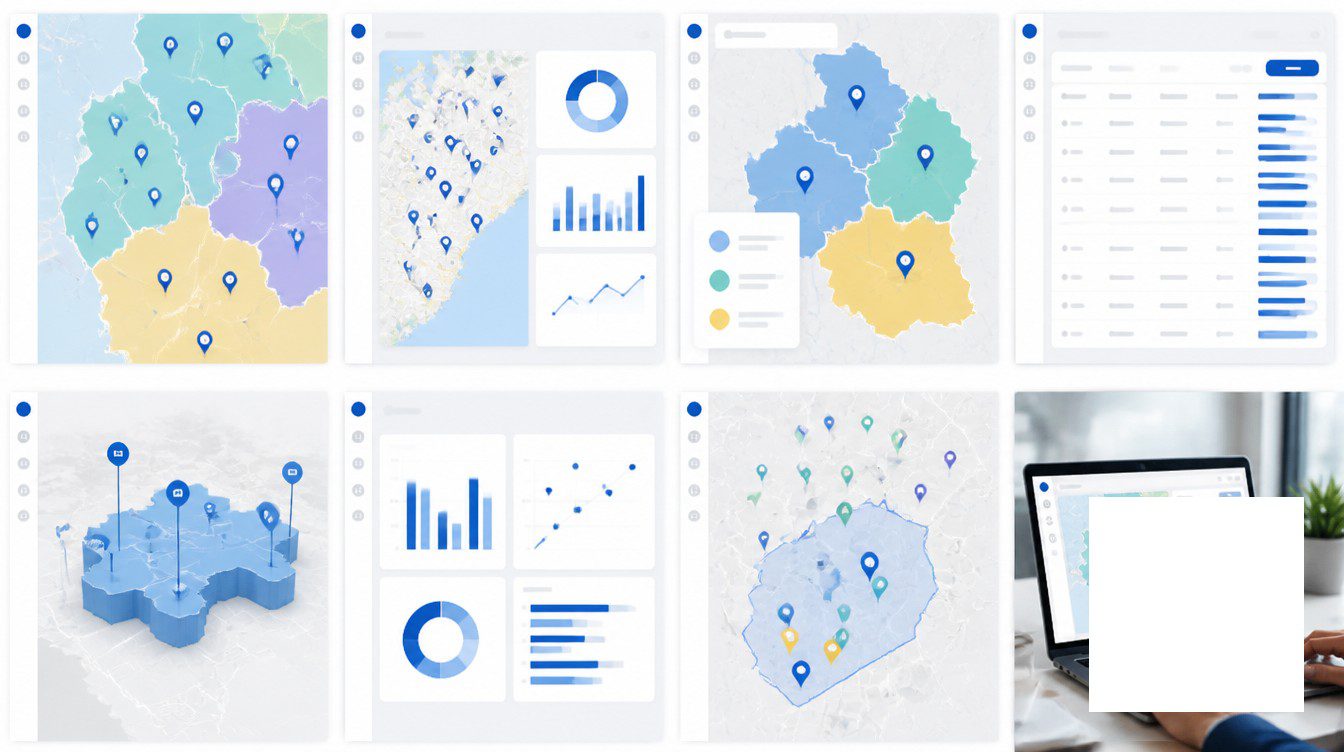
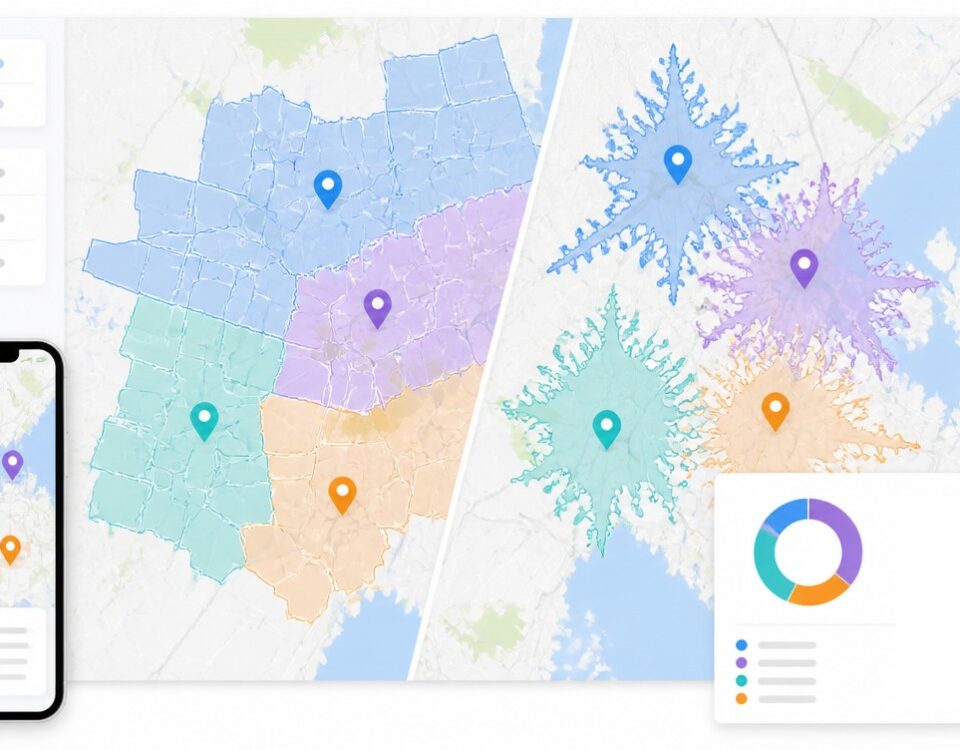
An analysis-tool map stacks layers. It is dense by design. It assumes a trained reader who knows how to toggle a competitor overlay against a household-income heatmap and read the result. It runs on a 3-day analyst SLA because every layer is computed against a back-end. It is built for the operations team that designed the territory system, not for the candidate evaluating a single territory.
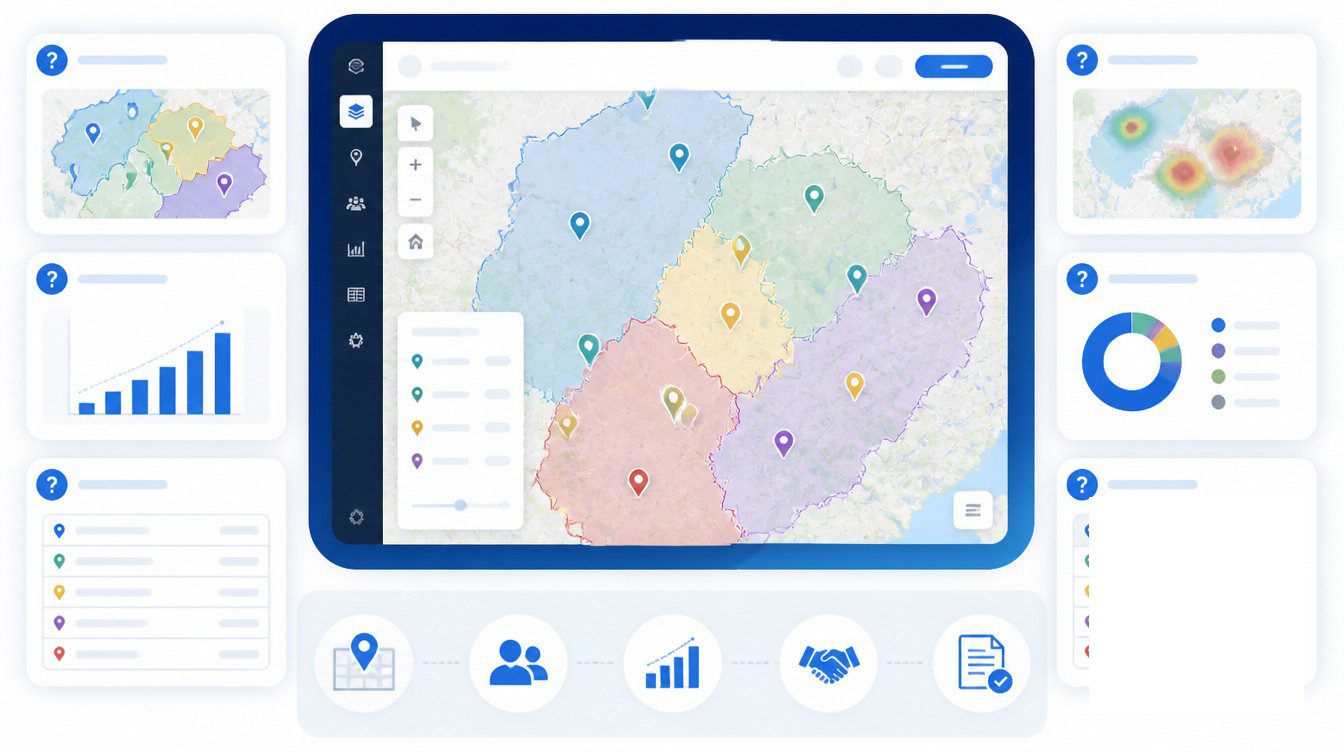
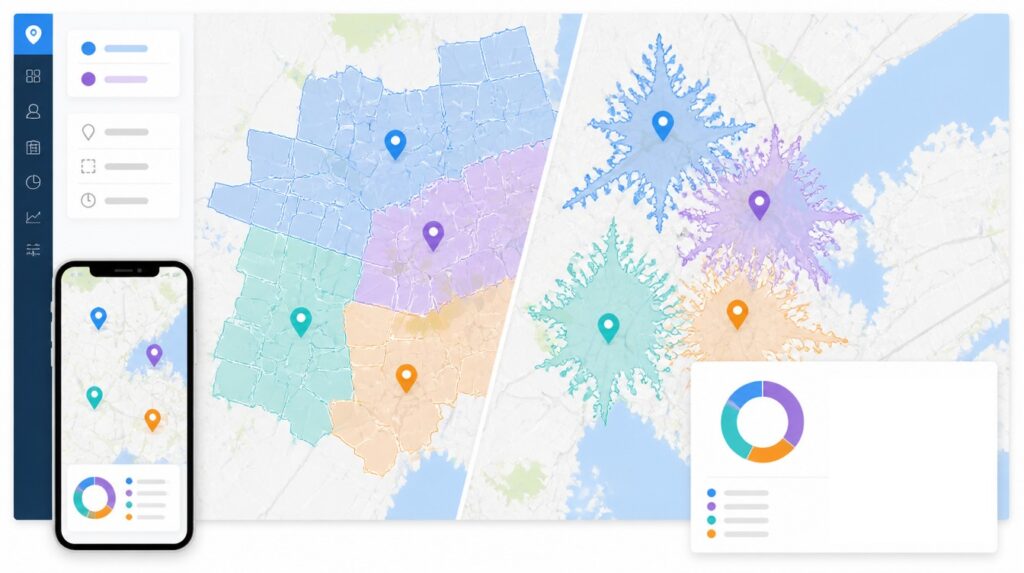
A sales-tool map answers one question per view. The candidate’s territory pops. Everything else is context. The map runs live in the call, which means the development rep can drop a marker on a candidate site, redraw a 20-minute drive-time, and answer “what if I added Frisco” without rebuilding anything. Since roughly 90% of Discovery Days now run virtually, the map has to survive a screen-share on a tablet held by the candidate’s spouse while the candidate follows on a laptop. It has to look like the brand, not like a generic GIS export with a logo stamped in the corner.
The villain of the franchise development map is the static screenshot pulled by an analyst 72 hours before Discovery Day. It cannot answer a follow-up question. It cannot adjust to a candidate who walks in with a different city than the one they wrote on the application. It puts the development rep in the position of saying “I’ll have to get back to you,” which is the sentence a candidate has been waiting for to confirm their suspicion that the brand is not as buttoned-up as the website implied.
Eight Elements of a Discovery Day Territory Packet
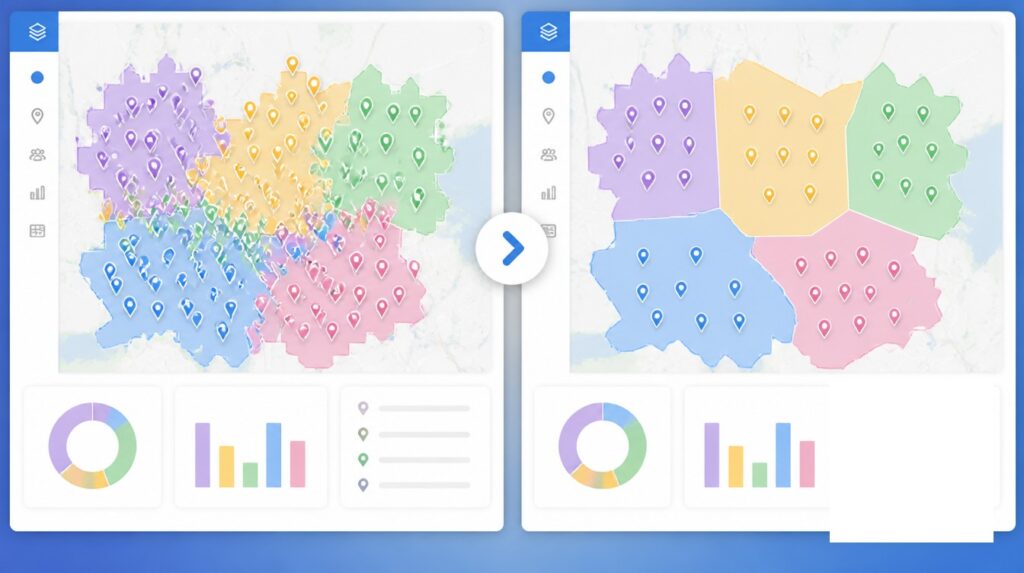
A Discovery Day map that closes contains specific elements arranged in a specific hierarchy. Most packets fail because they include either too much, every demographic layer the analyst can pull, or too little, a polygon with no context. The eight elements below are the floor.
Boundary and Drive-Time Geometry
The first four elements define what the candidate is actually getting.
Territory polygon, the exact boundary the franchise agreement will grant. It must match the FDD Item 12 language word for word. A polygon shaded one way on the map and described another way in the legal exhibit is a problem the candidate’s lawyer will catch.
Drive-time isochrones at 10, 20, and 30 minutes from the most likely candidate site. Straight-line radii misrepresent real catchment, and any candidate who has driven the market will notice. Drive-time better reflects how customers actually move through a metro.
Reserved or unavailable territory, meaning the zip codes or polygons the candidate cannot have, with a brief reason. Carve-outs for non-traditional venues, ecommerce, or house accounts belong here. Industry data indicates 91% of successful new franchises were granted exclusive territories, and a map that shows exactly what is and is not reserved removes the “what is the catch” worry that kills deals at signing.
Exclusivity status, a visible marker for the territory’s status as exclusive, protected, or non-exclusive, with the FTC-required disclaimer text adjacent if applicable.
Demographic and Performance Context
The next four elements turn a boundary into a forecast the candidate can defend to their accountant.
Demographics inside the polygon, meaning total population, target-customer count, median household income, and daytime population. Four numbers, not forty.
Existing franchisee locations, every operating unit within the region, with annotations for any unit the candidate should not contact during validation.
Top-performing unit overlay, an anonymized sister unit with comparable demographics, paired with Item 19 subset data if the franchisor discloses it. The candidate is benchmarking themselves against a real comparable, not against a system average that includes units in unrelated markets.
Competitor analog, the geography where competing brands are clustered, with a note on density relative to the candidate’s polygon.
The map that contains these eight elements, no more and no less, gives the candidate the information their advisors will ask for and stops short of overwhelming a first-time franchisee. A multi-unit operator may want a development schedule layered on top, three sites over five years with shared trade-area analysis. That is an addition for sophisticated buyers, not a replacement for the eight.
Lead Routing and Pipeline Mechanics
Maps inside the franchise CRM are not a presentation concern. They are a pipeline-velocity concern. Auto-routing inbound leads against territory polygons in under a minute is the highest-leverage map use case a development team has, and the brands that do it well convert at multiples of the brands that route manually.
The routing pattern is simple in principle. A form fill captures zip code. The CRM matches against a territory polygon table. The system fires an alert to the assigned development rep with the candidate’s location plotted on a map and the territory shaded as open, reserved, or contested. Franchise-specific platforms like FranConnect, Naranga, FranFunnel, and Process Peak handle the workflow layer. The geographic layer feeding them, built in Maptive or another mapping platform, decides if the routing logic is accurate. A polygon that no longer matches the current FDD will route a candidate to the wrong rep, or worse, to a territory that has already been awarded.
Speed-to-lead is the lever. The 5-minute and 1-minute thresholds are not soft. A development team running at the 42-hour average is paying $253 per lead to lose most of them. A team that responds in 1 minute, with the territory check already attached to the first email, is acquiring candidates at a unit economics the slow brands cannot match. The 72-hour cliff is where the math goes from inefficient to actively destructive. Past 72 hours the conversion rate is below 15%, which means the brand is funding the candidate’s serious conversations with a competing franchisor.
The multi-unit operator segment is where this matters most. Multi-unit candidates evaluate systems, not narratives. They want to see development schedules, three units across a metro over five years, with a map that shows how their sister units will share or carve trade areas. They will ask for Item 19 subset data covering the top quartile of multi-unit operators. The brand that hands them a single territory polygon and a list of available zip codes is not in their consideration set. The brand that hands them a routed lead alert with a multi-site development overlay is. Multi-unit deals close in 2 to 4 months. First-time buyers take 6 to 12. The map is the difference between which one a development team can scale.
A franchise development team has two artifacts in front of every candidate, the FDD and the map. Brands that close treat the map with the same discipline they apply to the FDD. Brands that lose late-stage deals treat it as a deck slide.
Frequently Asked Questions
What is a franchise development team?
A franchise development team is the group inside a franchisor responsible for recruiting, qualifying, and awarding franchise territories to new franchisees. It functions as a B2B sales organization, typically led by a VP or Director of Franchise Development, with franchise sales reps managing pipeline. The team owns the process from lead generation through signing the franchise agreement, then hands the new franchisee to onboarding.
How do franchise development teams use maps in the sales process?
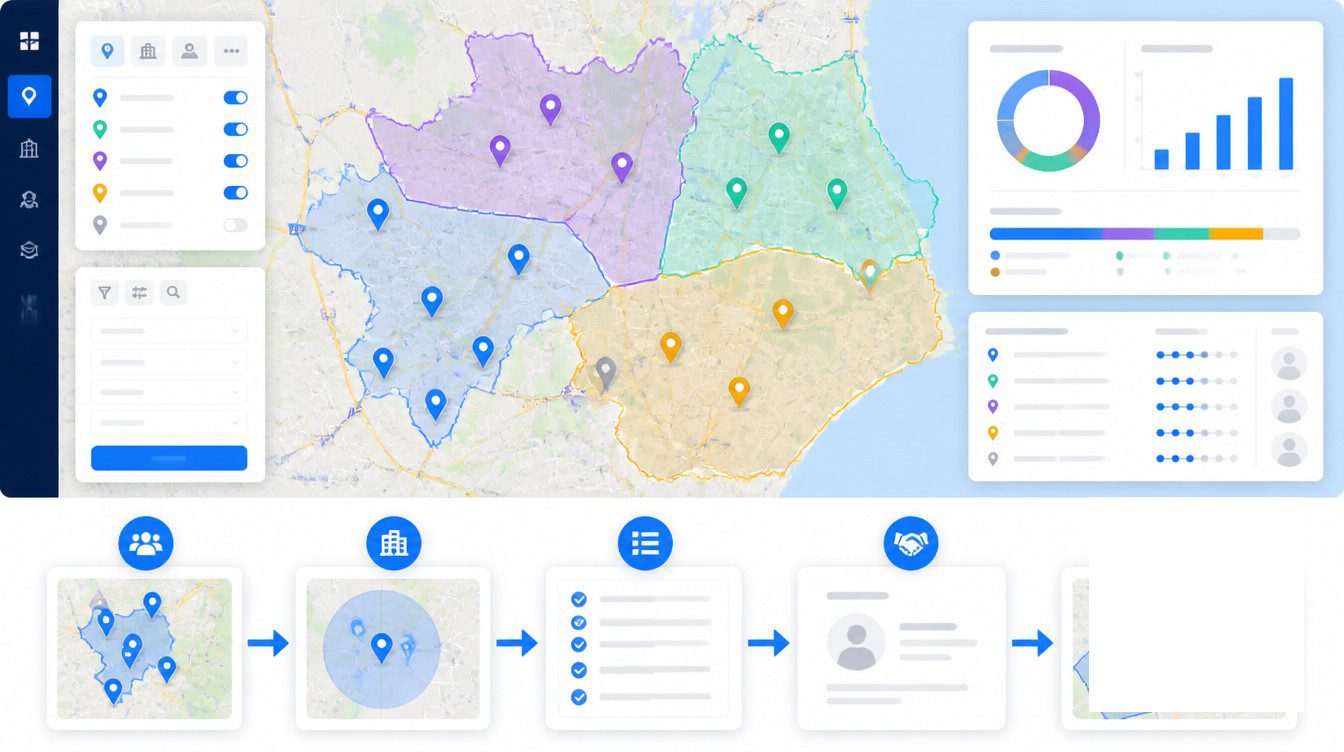
Maps appear at five points in a franchise deal. The initial territory-availability check after a prospect submits a zip code, the program-review call that overlays the candidate’s target market with available territory and demographics, Discovery Day where a custom territory packet is presented, the FDD Item 12 walkthrough where a polygon makes the legal text concrete, and the signed franchise agreement, which attaches a map as the official territory grant.
What is a franchise Discovery Day?
Discovery Day is a visit by a serious franchise candidate to the franchisor’s headquarters, in person or virtual, that runs one to two days. It includes facility tours, leadership meetings, franchisee panels, financial modeling, and territory review. Both sides evaluate each other. It is the final substantive interview before a franchise agreement is signed.
How long is a franchise Discovery Day?
Typically one to two days, though some franchisors run weekend or multi-day formats. Since the pandemic, many brands run virtual Discovery Days compressed to a single full day on video conference. One major franchise group reported approximately 90% of Discovery Days conducted virtually as of 2024.
Who pays for a franchise Discovery Day?
It varies. Some franchisors pay for everything, including travel, lodging, and meals, to attract higher attendance. Some require the candidate to pay everything as a screening filter. Many split costs. A 2024 industry trend is franchisors offering up to $1,500 toward travel expenses as a Discovery Day incentive.
What is FDD Item 12?
Item 12 of the Franchise Disclosure Document covers territory. It must disclose if the franchise is sold for a specific location or an approved one, the methods used to determine territory size, the minimum territory size, the territory’s exclusivity status (exclusive, non-exclusive, or protected), and any conditions under which the franchisor may operate competing units in the territory.
What is the difference between an exclusive and protected franchise territory?
Exclusive territory means the franchisor contractually promises not to open company-owned or franchised units in the area. Protected territory limits competitive placement but allows certain reservations, typically non-traditional venues, ecommerce, or national accounts. Non-exclusive territory means the franchisor reserves the right to compete. Industry research indicates 91% of successful new franchises were granted exclusive territories.
How long is the franchise sales cycle?
Fast-moving qualified deals close in 45 to 75 days. Standard professionally managed deals run 90 to 150 days. Complex or new franchise opportunities take 180 days or more. By buyer type, first-time buyers take 6 to 12 months, experienced investors 3 to 6 months, and multi-unit developers 2 to 4 months.
How do franchisors route inbound leads geographically?
Most modern franchise CRMs match the prospect’s zip code against a territory polygon table and auto-route to the assigned franchise development rep. Routing rules can use zip code, radius, drive-time, or custom polygon membership. Speed to first human contact is the critical metric. Conversion drops below 15% after 72 hours from inquiry.
What is a franchise validation call?
A validation call is a phone conversation between a franchise candidate and an existing franchisee, conducted during due diligence after FDD delivery. The candidate asks about real-world economics, training, support, and operating realities. Best practice is to speak with 3 to 5 franchisees representing different market sizes, regions, and tenure, spending 45 to 60 minutes per call.
What conversion rates are typical in franchise development?
The 2024 Annual Franchise Development Report, drawn from 120 surveyed brands, reports leads-to-sales of 2.3%, qualified leads-to-sales of 10%, applications-to-sales of 28%, and Discovery-Days-to-sales of 65%. Average cost per lead was $253 and average cost per sale $11,639.
How are franchise territories typically defined?
Territories are most commonly defined by zip codes, radius around a designated address, or drive-time isochrones. Some franchisors use county or census tract boundaries, or custom polygons drawn around qualified-household counts. Drive-time better reflects real customer catchment than straight-line radii and is increasingly preferred for new franchise programs.


