




A territory restructuring business case wins when the cost of doing nothing is the first number on the page. When the redesign cost lands first, the finance committee compares it to zero. When the leak lands first, the same committee compares the redesign to a number the company is already paying every quarter. Same evidence, different decision.
The base rate for organizational redesigns is unforgiving. McKinsey’s research found only 23% of redesigns met their objectives, and 44% stalled in implementation and were never finished. A territory case has to pass two tests at once. The math has to work, and the case has to read as a plan rather than a wish list.
What follows is the structure that survives executive committee, the math that prices the status quo honestly, the upside framing that CFOs do not discount, and the four objections that have to be answered before they are asked.
Why Most Territory-Redesign Cases Fail the CFO Test
The standard case opens with the proposed change. The new map, the rationale, the implementation cost, the expected lift. The CFO listens, calculates payback in real time, and mentally compares the implementation cost to a baseline of $0 because the status quo never got a line item. Under that comparison, almost any redesign loses on arithmetic that was never the real arithmetic.
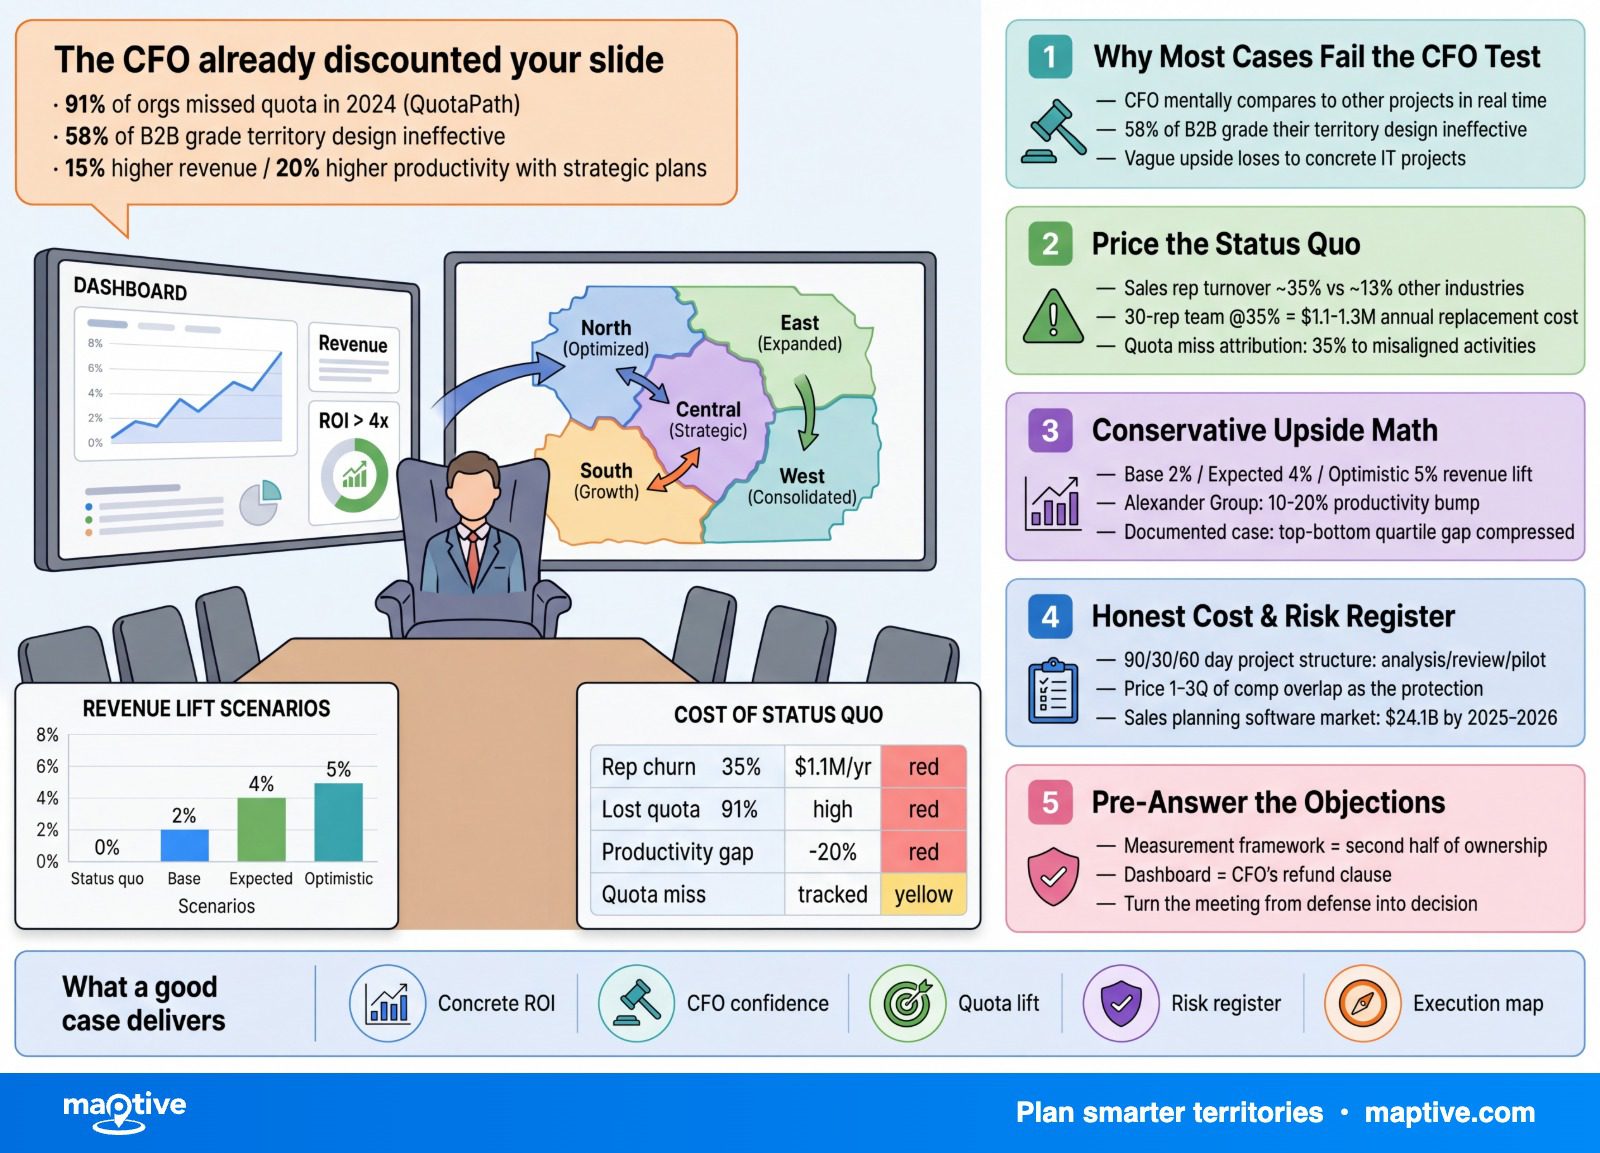
The framing inversion is the persuasive move. The status quo is not free. It is a leak the company is funding every fiscal quarter, every quota period, every customer renewal cycle. The case that wins prices the leak first, which shifts the comparison from “should we spend $X on a redesign” to “should we keep spending $Y on a problem we can fix for $X.” That second question is the one the committee can actually answer.
The leak is industry-wide and already on the P&L. The Sales Management Association’s 2024 research found 58% of B2B companies grade their own territory design as ineffective. QuotaPath reported 91% of organizations missed quota expectations in 2024, with 35% of leaders attributing the miss to misaligned sales activities. Roughly a third of every missed quota dollar traces back to coverage and territory design. The numbers exist. The work is putting them on the slide.
A business case that opens with “here is what we want to change” has lost the room before the third slide. The opening line has to be the size of the leak the company is funding right now.
Pricing the Status Quo (the Half Most Cases Skip)
A defensible status-quo cost has four line items, each with a published industry benchmark behind it. The case that wins builds a status-quo P&L, names a dollar figure per line, and totals the four. The redesign cost then gets compared against that total rather than against zero. Almost always, the redesign is the cheaper number.
Lost Revenue from Capacity Imbalance
Misaligned territories cut sales capacity by 15-25%, a range Alexander Group has put on the record and that has stood in industry coverage from 2024 forward. On a $40M sales team, the conservative end of that range is $6M of selling capacity the company has already paid for and is not using. The capacity is in the org chart. It is in headcount. It is in salaries already authorized. The only thing missing is account coverage that produces revenue from it.
Companies with strategic territory plans show roughly 15% higher revenue and 20% higher productivity than ad-hoc approaches in 2024 industry data. The number to put on the slide is the conservative end of the capacity loss multiplied by current bookings. Anything more aggressive invites discounting before the committee finishes reading the line.
Turnover the Company Is Already Paying
The DePaul University Center for Sales Leadership study landed on a per-rep replacement cost of $114,957 for outside sales, broken down as $29,159 to hire, $36,290 to train, and $49,508 in lost productivity during ramp. Industry research summaries through 2025 confirm the figure regularly tops $115,000 per departure.
Sales rep turnover runs around 35% versus around 13% across other industries per Xactly’s 2024-2025 compilation. A 30-rep team running at 35% loses 10-11 reps a year, or $1.1 to 1.3M in replacement cost annually before any pipeline impact. A 5% increase in attrition raises selling costs 4-6%. The replacement bill at current turnover is the second status-quo line. It is recurring, it is on the books, and it is almost never accounted for as a territory cost even though imbalance produces it.
Customer Churn from Coverage Gaps
Xactly’s 2024 data showed territories where revenue per account fell below $50,000 faced churn rates 23% higher than territories above $100,000 per account. Overstretched reps cannot maintain the relationship density a renewal needs. Frequent account-manager changes lift churn risk independent of rep skill, and the customer experiences a redesign before the rep does.
The CFO will discount soft churn numbers. Translate the churn rate into hard dollars at average customer LTV before bringing it to the meeting. Once the churn line has a unit of currency attached to it, the finance team can underwrite it. Before that, the line gets read as a soft benefit and discounted to zero.
Missed-Quota Drag on the Top Line
Q4 2024 average quota attainment was 43.14%, a slight improvement on Q2 2024’s 42.00%. 51% of sellers hit 75% or less of quota in 2024. McKinsey’s 2024 analysis of nearly 500 B2B companies found top-quartile sales organizations produce 2.5x higher gross margin per sales dollar than bottom-quartile peers.
The math to show is the gap between current attainment and the rate the company sets its quotas for, in dollars, recurring every quarter the design stays static. A company quoting reps at $1M and attaining 43% is funding the gap somewhere. The case names it.
The four line items totaled give a single status-quo number. That number is the cost of standing still, and it appears on the books in this fiscal year, not in a forecast.
The Upside Math, Pegged to Conservative Ranges
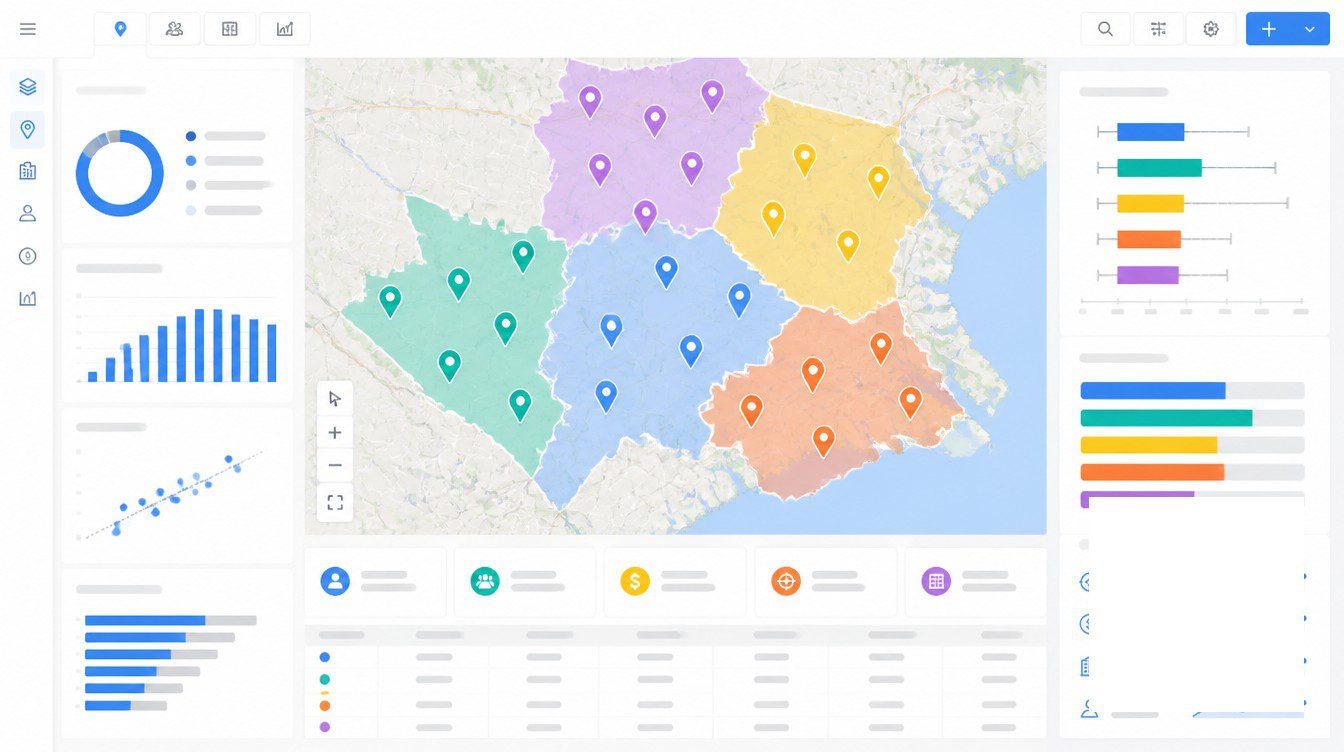
The upside math fails when the case overclaims. CFOs discount any forecast they sense is reaching, and the discount applied to a 7%+ revenue lift is far larger than the discount applied to a 2% lift. Lead with the conservative end of the published research and put the optimistic number nowhere near slide one.
Harvard Business Review’s frequently cited finding is a 2-7% revenue lift from optimized territory design with no change in headcount or strategy. Alexander Group reports a 10-20% productivity increase from well-designed territories. One documented rebalancing case compressed the top-to-bottom quartile gap from 2.3x to 1.6x and lifted average team productivity 32%. Those numbers are the upper boundary of what the literature defends.
The sensitivity table is what the CFO is actually reading on slide three. Base case at 2%, expected case at 4%, optimistic case at 5%. The optimistic case still does not reach the 7% upper bound of the published range. CFOs read that conservatism as discipline and stop discounting the forecast. Any case that opens with a 7%+ number has already invited skepticism that no later slide will dislodge.
There is a recurring upside that does not depend on the redesign math at all. Companies running formal territory rebalancing at least twice a year show 14% higher quota attainment than teams on static maps. The recurring number is the case for converting territory design into a quarterly process rather than a single one-time event. The committee approving a one-time redesign also approves the cadence that protects it.
The upside number on slide one should be the one the CFO can defend to the board if asked at the next meeting. That number is almost always the bear case.
The Honest Implementation Cost and Risk Register
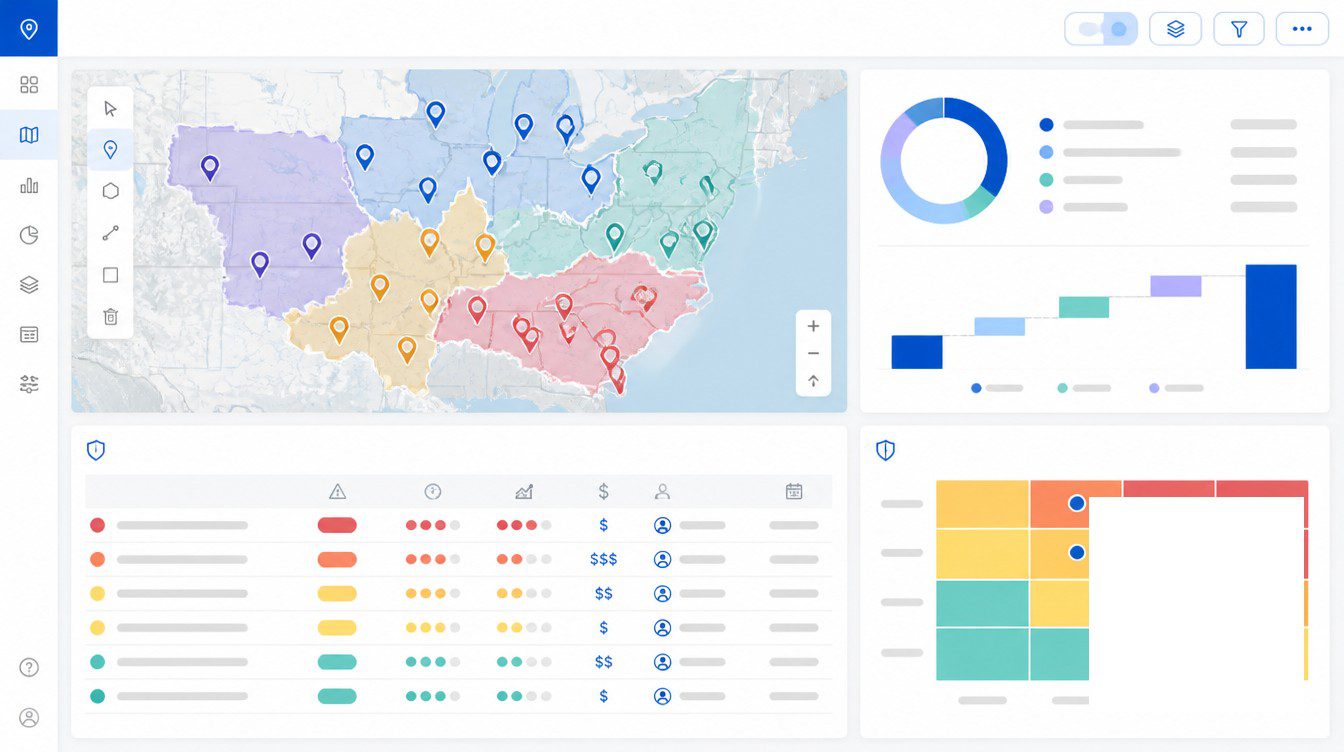
The case that survives committee is the one that prices its own costs honestly and lists its own risks first. CFOs respect a thorough cost list and a clean risk register because both signal that the team has thought past the slide deck.
The cost categories are software and tooling, consulting or external analytics support if used, change management and communications, compensation protection for in-flight deals, training, and internal time across analyst, sales-ops, and manager hours. The global sales planning software market reached $24.1B in 2025 by 2025-2026 market-size estimates, so the tooling line is a real number rather than a nominal one. Internal time often gets omitted from the case because it is fully-loaded already in salary. Include it anyway. The committee notices when it is missing.
The line item most cases under-spec is compensation protection. Standard practice through 2025-2026 is to protect originating reps’ commission on any deal already at proposal stage, with a documented cutover date for new pipeline and minimum 2-4 weeks notice before changes take effect. Price the protection as 1-3 quarters of partial commission overlap. Label the line as the price of trust, because trust is the variable that determines if the redesign actually takes hold in the field.
The risk register names the four standing risks of any territory restructure. Top performer flight risk. Customer relationship disruption. Forecast slip during transition. Internal political friction. Each risk gets a named mitigation, a named owner, and a defined trigger condition. A case with no risk register comes across as a sales pitch. A case with named risks and named owners comes across as an operating plan.
The timeline is the implicit de-risker. 90 days of analysis, 30 days of stakeholder review, 60 days of phased pilot rollout, 12 months of monitoring. McKinsey notes a typical reorganization runs around 10 months end-to-end and more than half of executives report productivity falling during the transition window. A pilot region absorbs that dip in one zone instead of compounding it across all of them. A 12-week pilot before company-wide rollout is the single most powerful risk-reducer the case can carry. CFOs almost always approve a pilot when they would reject a big-bang launch.
Pre-Answering the CFO’s Objections
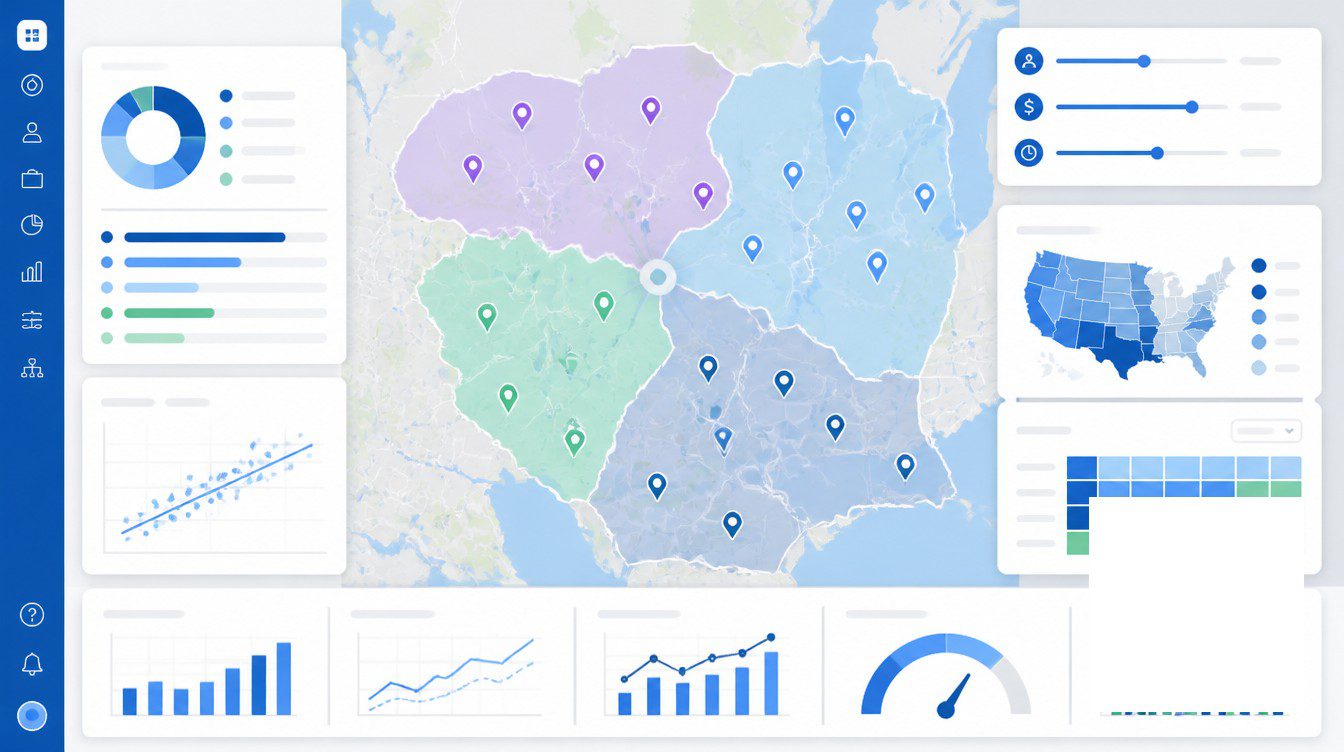
Every CFO has the same four objections to a sales reorg case, and the case that wins answers all four before they are asked. Pre-empting them turns the committee meeting from a defense into a decision.
“Your Lift Forecast Is Optimistic”
Bring base, expected, and optimistic scenarios with the base case still NPV-positive. The base case uses the 2% low end of HBR’s range rather than the middle of it. CFOs accept lift numbers they sense have been stress-tested at the bottom of the range. The sensitivity table belongs on slide three, not in the appendix. If the CFO has to ask for it, the case has already weakened.
“The Savings Are Soft”
Translate retention into hard dollars at $114,957 per rep. Translate churn reduction into LTV per saved account. Translate capacity recovery into bookings at current win rate. Once each soft saving has a currency unit attached to it, the finance team can underwrite it. Before that, every soft saving gets discounted to zero. The translation work is the case’s job, not the CFO’s.
“What Does Cash Flow Look Like During the Transition?”
Phase the comp protection window and show monthly cash burn on a separate line. The CFO needs to see if the protection bill compresses inside the quarter or trails into the next fiscal year. Anchor the assumption hierarchy explicitly. Pilot data first, CRM data second, industry benchmarks third. CFOs trust internal data more than any consulting figure, and stating the priority order on the slide signals the case knows which numbers matter in the room.
“Who Owns the Number?”
Name an executive owner on the recommendation slide. Not the project sponsor. Not the steering committee. One named person who reports against the measurement framework in quarterly cycles for the first 12 months. Deloitte’s 2025 organizational-design research found 75% of successful projects report high stakeholder involvement from the start. Ownership is what converts that involvement into accountability the CFO can hold someone to.
The measurement framework is the second half of the ownership answer. 8-12 KPIs tracked in the first 12 months, including median quota attainment (the median rather than the average, since dispersion is the point), top-versus-bottom quartile gap, revenue per rep adjusted for ramp time, pipeline velocity by territory, per-territory customer churn, voluntary rep turnover, and selling time as percentage of total time. The dashboard is the CFO’s refund clause. A measurement framework with a named owner is what makes a redesign case reversible if the numbers fail to move. Most cases ship without one and lose the room on the absence rather than the math.
The case that wins is the one where doing nothing comes across as the most expensive option in the committee. The mapping and capacity-modeling tools Maptive supports are what produce the status-quo P&L in the first place, and the slide that surfaces the leak is the one that changes the comparison the CFO is silently running. Until that slide exists, the redesign is being compared to zero, and the math the case actually depends on stays invisible.
Frequently Asked Questions
How do you build a business case for restructuring sales territories?
Open with the cost of NOT restructuring. Lost revenue from imbalance, turnover, customer churn, and missed quota go on the slide before any proposed change. The standard sequence is executive summary, problem statement (the status-quo P&L), proposed solution, implementation cost, expected benefit, risks, and recommendation. The executive summary fits one page because several decision-makers will read nothing else.
What is the ROI of territory optimization?
The widely cited Harvard Business Review range is a 2-7% revenue lift from optimized territory design with no change in headcount or strategy. Alexander Group reports a 10-20% productivity increase from well-designed territories. Conservative business cases use the 2% low end as the base scenario and run sensitivity to roughly 5% as the optimistic case.
How much does it cost to replace a sales rep?
DePaul University Center for Sales Leadership research puts the total cost at $114,957 per outside sales rep, broken down as $29,159 to hire, $36,290 to train, and $49,508 to replace lost productivity. Industry research summaries through 2025 confirm the figure regularly tops $115,000 per departure. Use the full number on the slide, not the hiring component alone.
How do you justify a sales territory redesign to leadership?
Anchor the case to four data points. Misaligned territories cut sales capacity 15-25%, 58% of B2B companies rate their territory design as ineffective, companies with strategic territory plans see 15% higher revenue, and rebalancing twice a year lifts quota attainment 14%. Frame the cost of inaction in dollars before introducing the redesign.
What should a sales territory business case template include?
The six required sections per 2026 CFO-approved guidance are a one-page executive summary, a quantified problem statement, an options analysis that includes “do nothing,” financial metrics (NPV, IRR, payback, ROI) with sensitivity, a risk assessment, and a single recommendation with a named owner. Sensitivity tables appear on the third slide rather than in the appendix.
How do you get buy-in for a sales reorganization?
Deloitte research summarized in 2025 organizational-design coverage shows 75% of successful projects report high stakeholder involvement from the start. Practical steps include identifying a small trusted group to fine-tune the plan early, customizing messages by audience (executives want strategic implications, reps want day-to-day impact), making communication two-way, and treating the post-announcement window as the most important phase.
Why do most sales reorganizations fail?
McKinsey found only 23% of executives reported their reorganization met its objectives, and 44% said the redesign stalled in implementation and was never finished. Top causes include focusing on the org chart while ignoring processes and people, applying equitable across-the-board targets that miss the reallocation goal, and productivity falling during the typical 10-month transition without a plan to manage through it.
What payback period should a sales territory business case show?
For SaaS-style investments, 6-12 months is typical, and 12-24 months is acceptable for enterprise platforms if NPV remains strong. CFOs run the payback calculation silently during the presentation, so the number belongs in the first 30 seconds of the pitch rather than buried in the appendix.
How do you protect sales rep compensation during a territory realignment?
Standard guardrails per 2026 compensation guidance include full commission to the originating rep for any deal already at proposal stage, a documented cutover date for new pipeline, minimum 2-4 weeks notice before changes take effect, and a written dispute resolution process. The protection is the price of trust, and trust determines if the redesign actually takes hold.
What is the cost of poor sales territory design?
Misaligned territories cut sales capacity 15-25%. Xactly’s 2024 data shows territories where revenue per account fell below $50,000 face churn rates 23% higher than those above $100,000 per account. Sales rep turnover runs around 35% versus 13% across other industries, and a 5% increase in attrition raises selling costs 4-6%. Multiplied across a 30-rep team, the status-quo cost runs $3-4M annually before missed-quota drag is added.
How do you present a territory redesign to a CFO?
Lead with the ask, the expected ROI, and the payback period in the first 30 seconds. CFOs want the numbers before the context. Bring a sensitivity table with base, pessimistic, and optimistic scenarios, with the pessimistic case still NPV-positive. Anchor every assumption in pilot data first, CRM data second, and industry benchmarks third.








