


Government Mapping Software
How many of your department's addresses fall inside a given district? If the records include locations, Maptive can plot them on a map any team or resident can open. Bring a spreadsheet to a live demo and see for yourself.
No credit card required
Trusted by teams at
















Mapping Software Built for Government Workloads
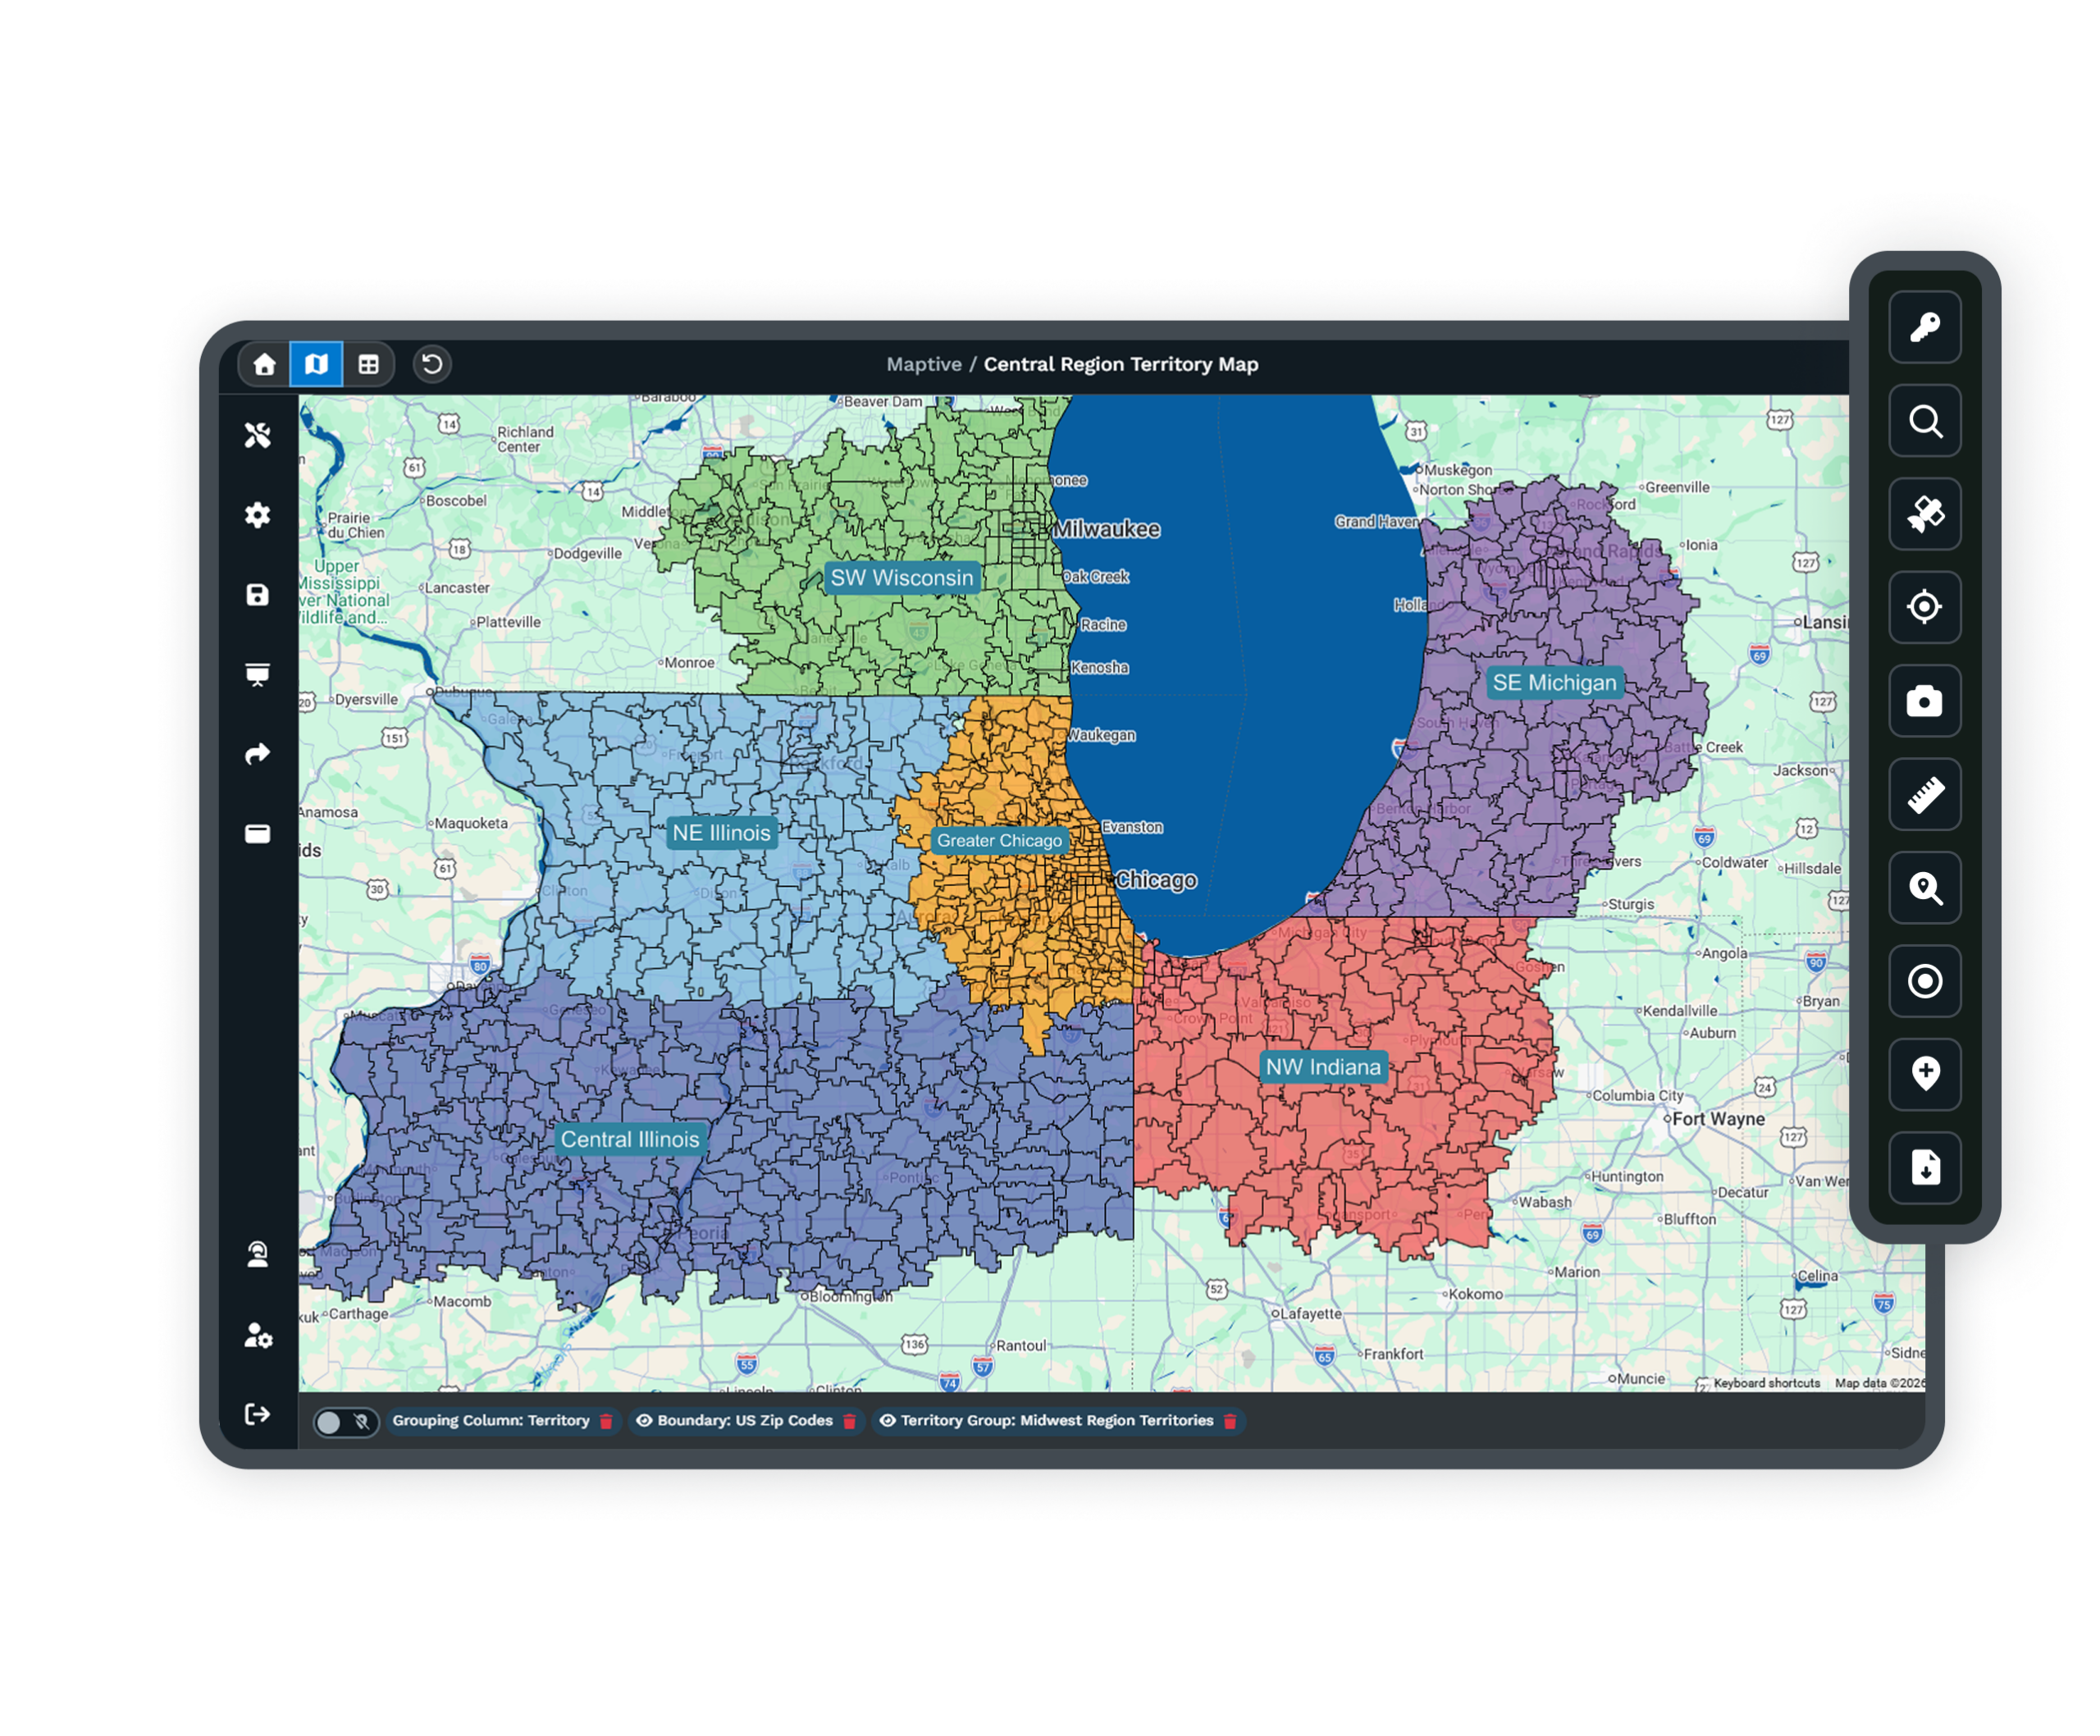
Upload a spreadsheet of your department's records and each address becomes a point on the map. From there you can shade districts and wards, then layer census data underneath to see who lives in each one. Residents and other teams can open the same map from a link. Every plan includes unlimited maps, so each program can keep its own.
Map Residents and Public Facilities
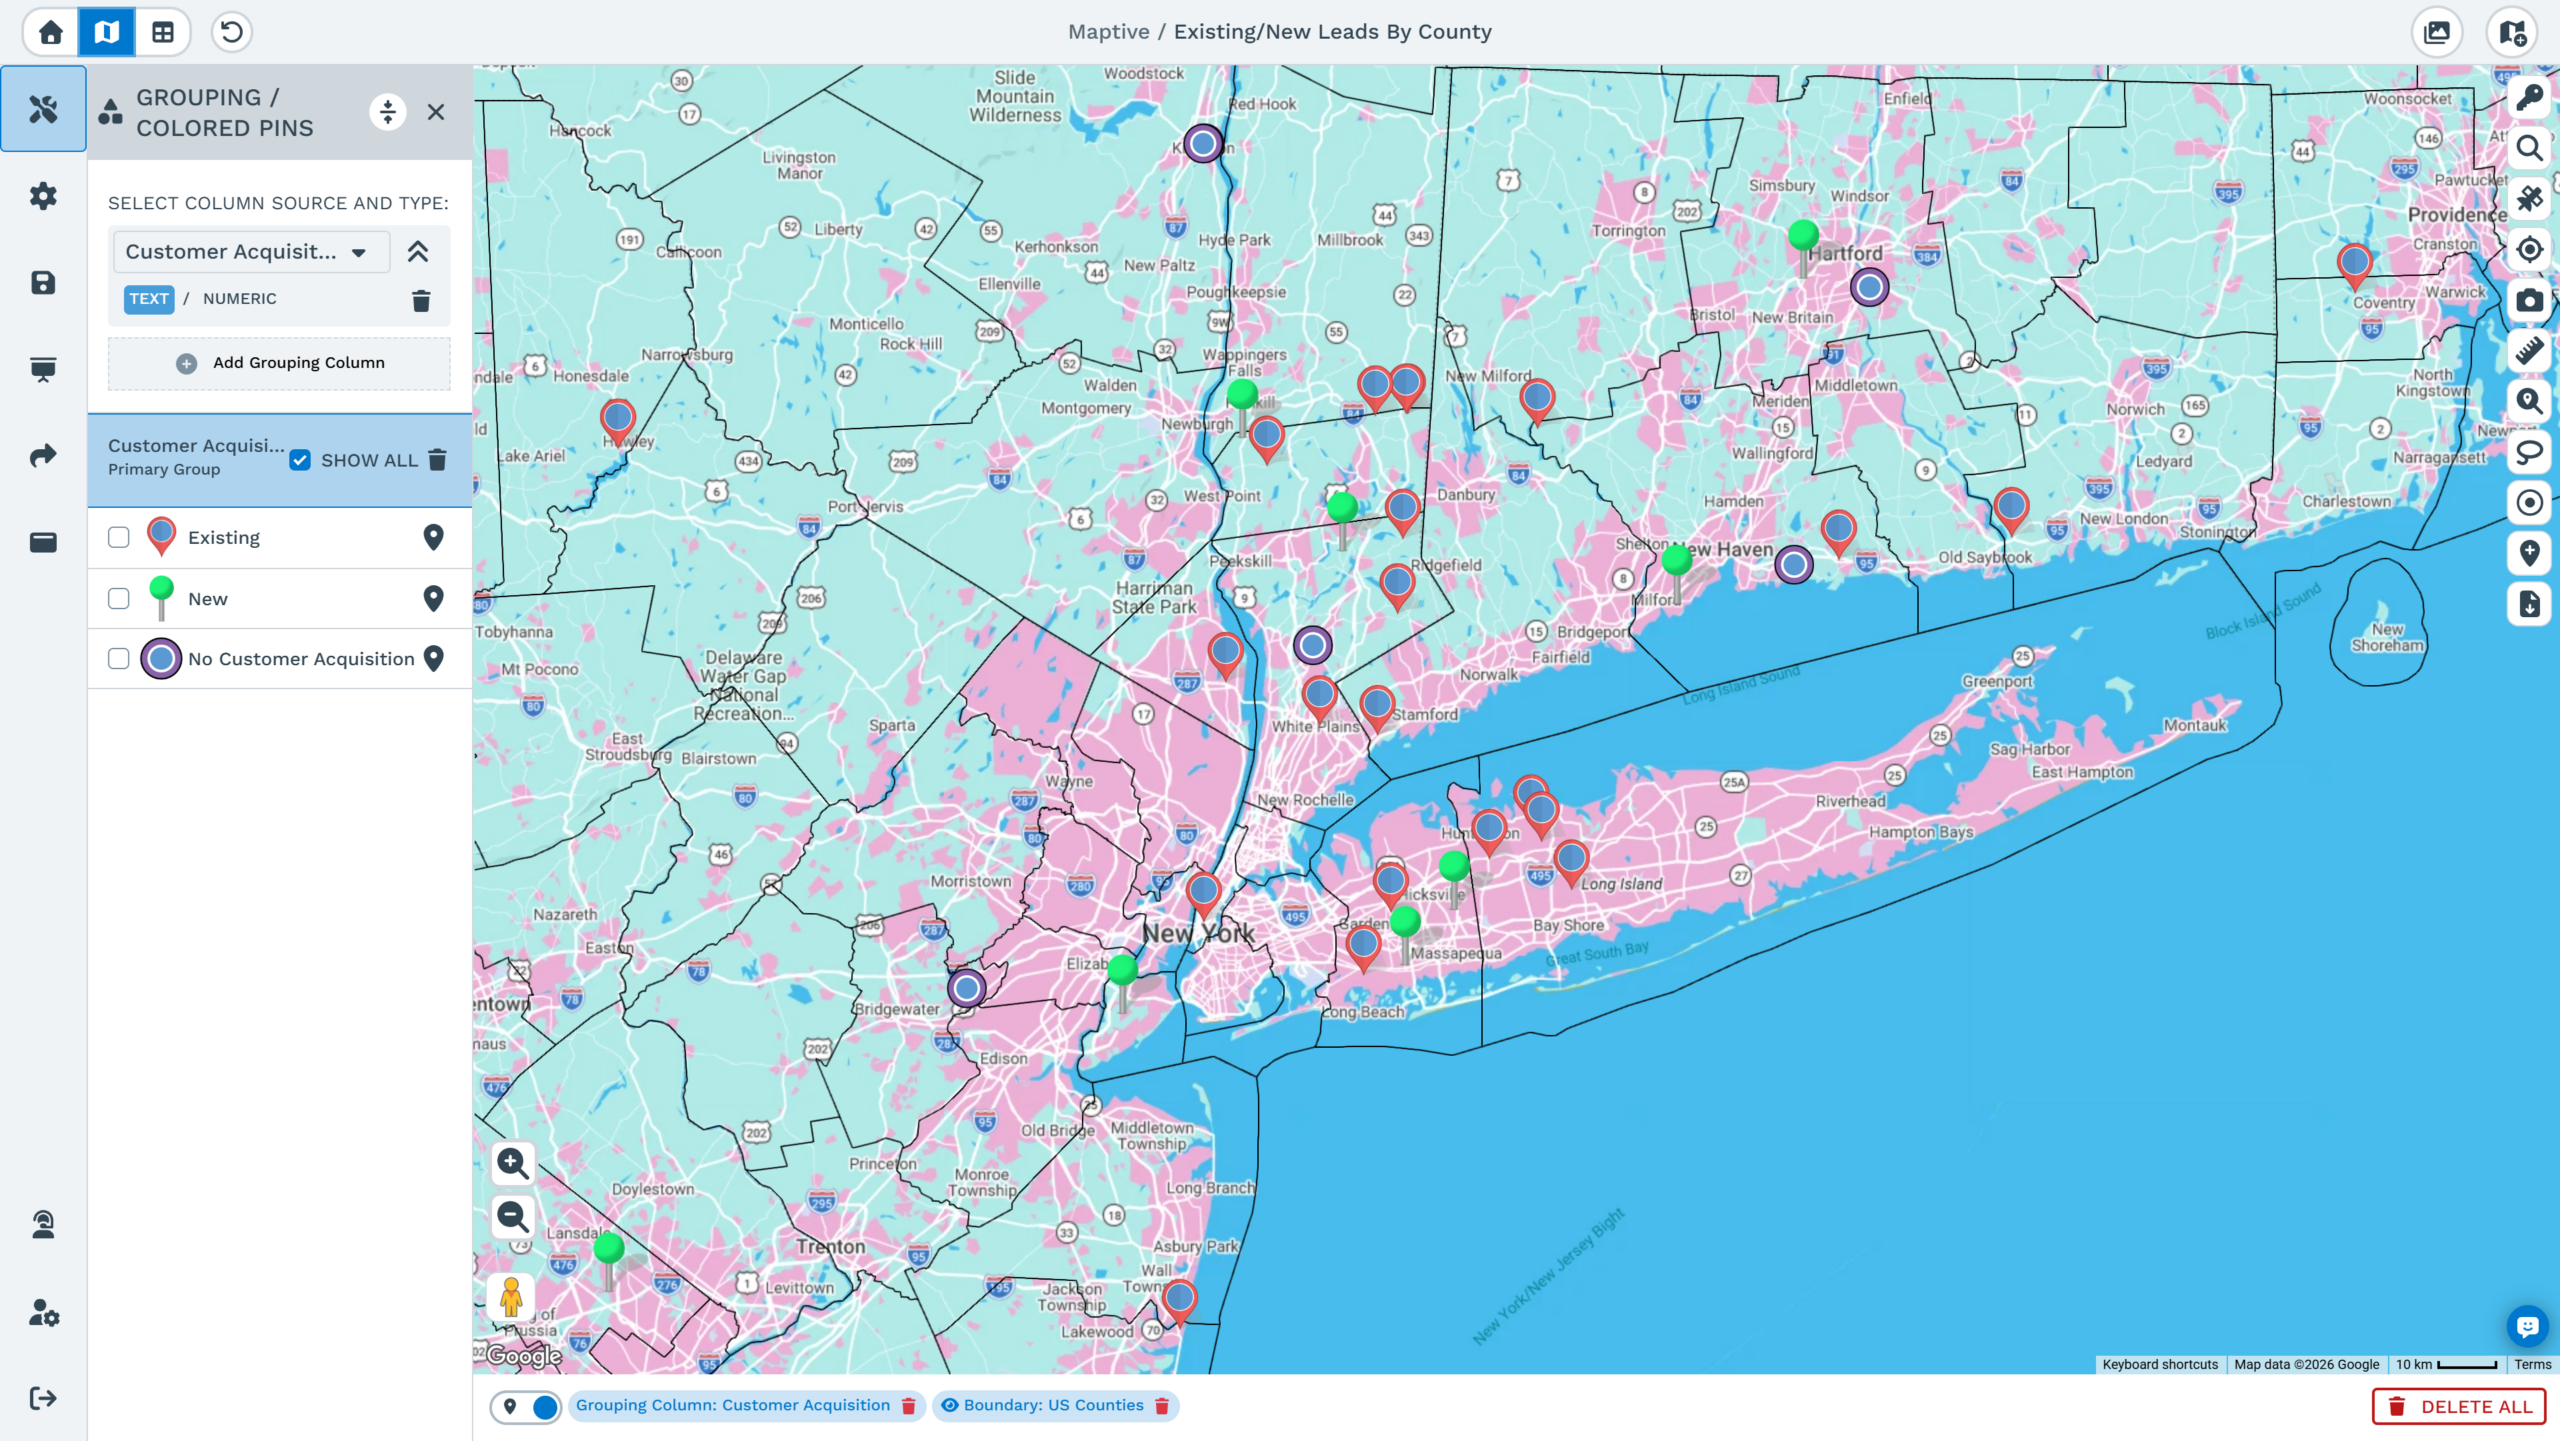
Offices and service points fit in one spreadsheet. Upload geocoding fixes missing ZIP codes and bad addresses, and color coding separates one department's markers from another's.
Define Service Areas That Match Jurisdictions
A service area that ignores jurisdiction lines creates work at reporting time. The boundary tool builds areas from county, ZIP or tract lines, so the map matches existing reports.
Analyze Demand With Census Data
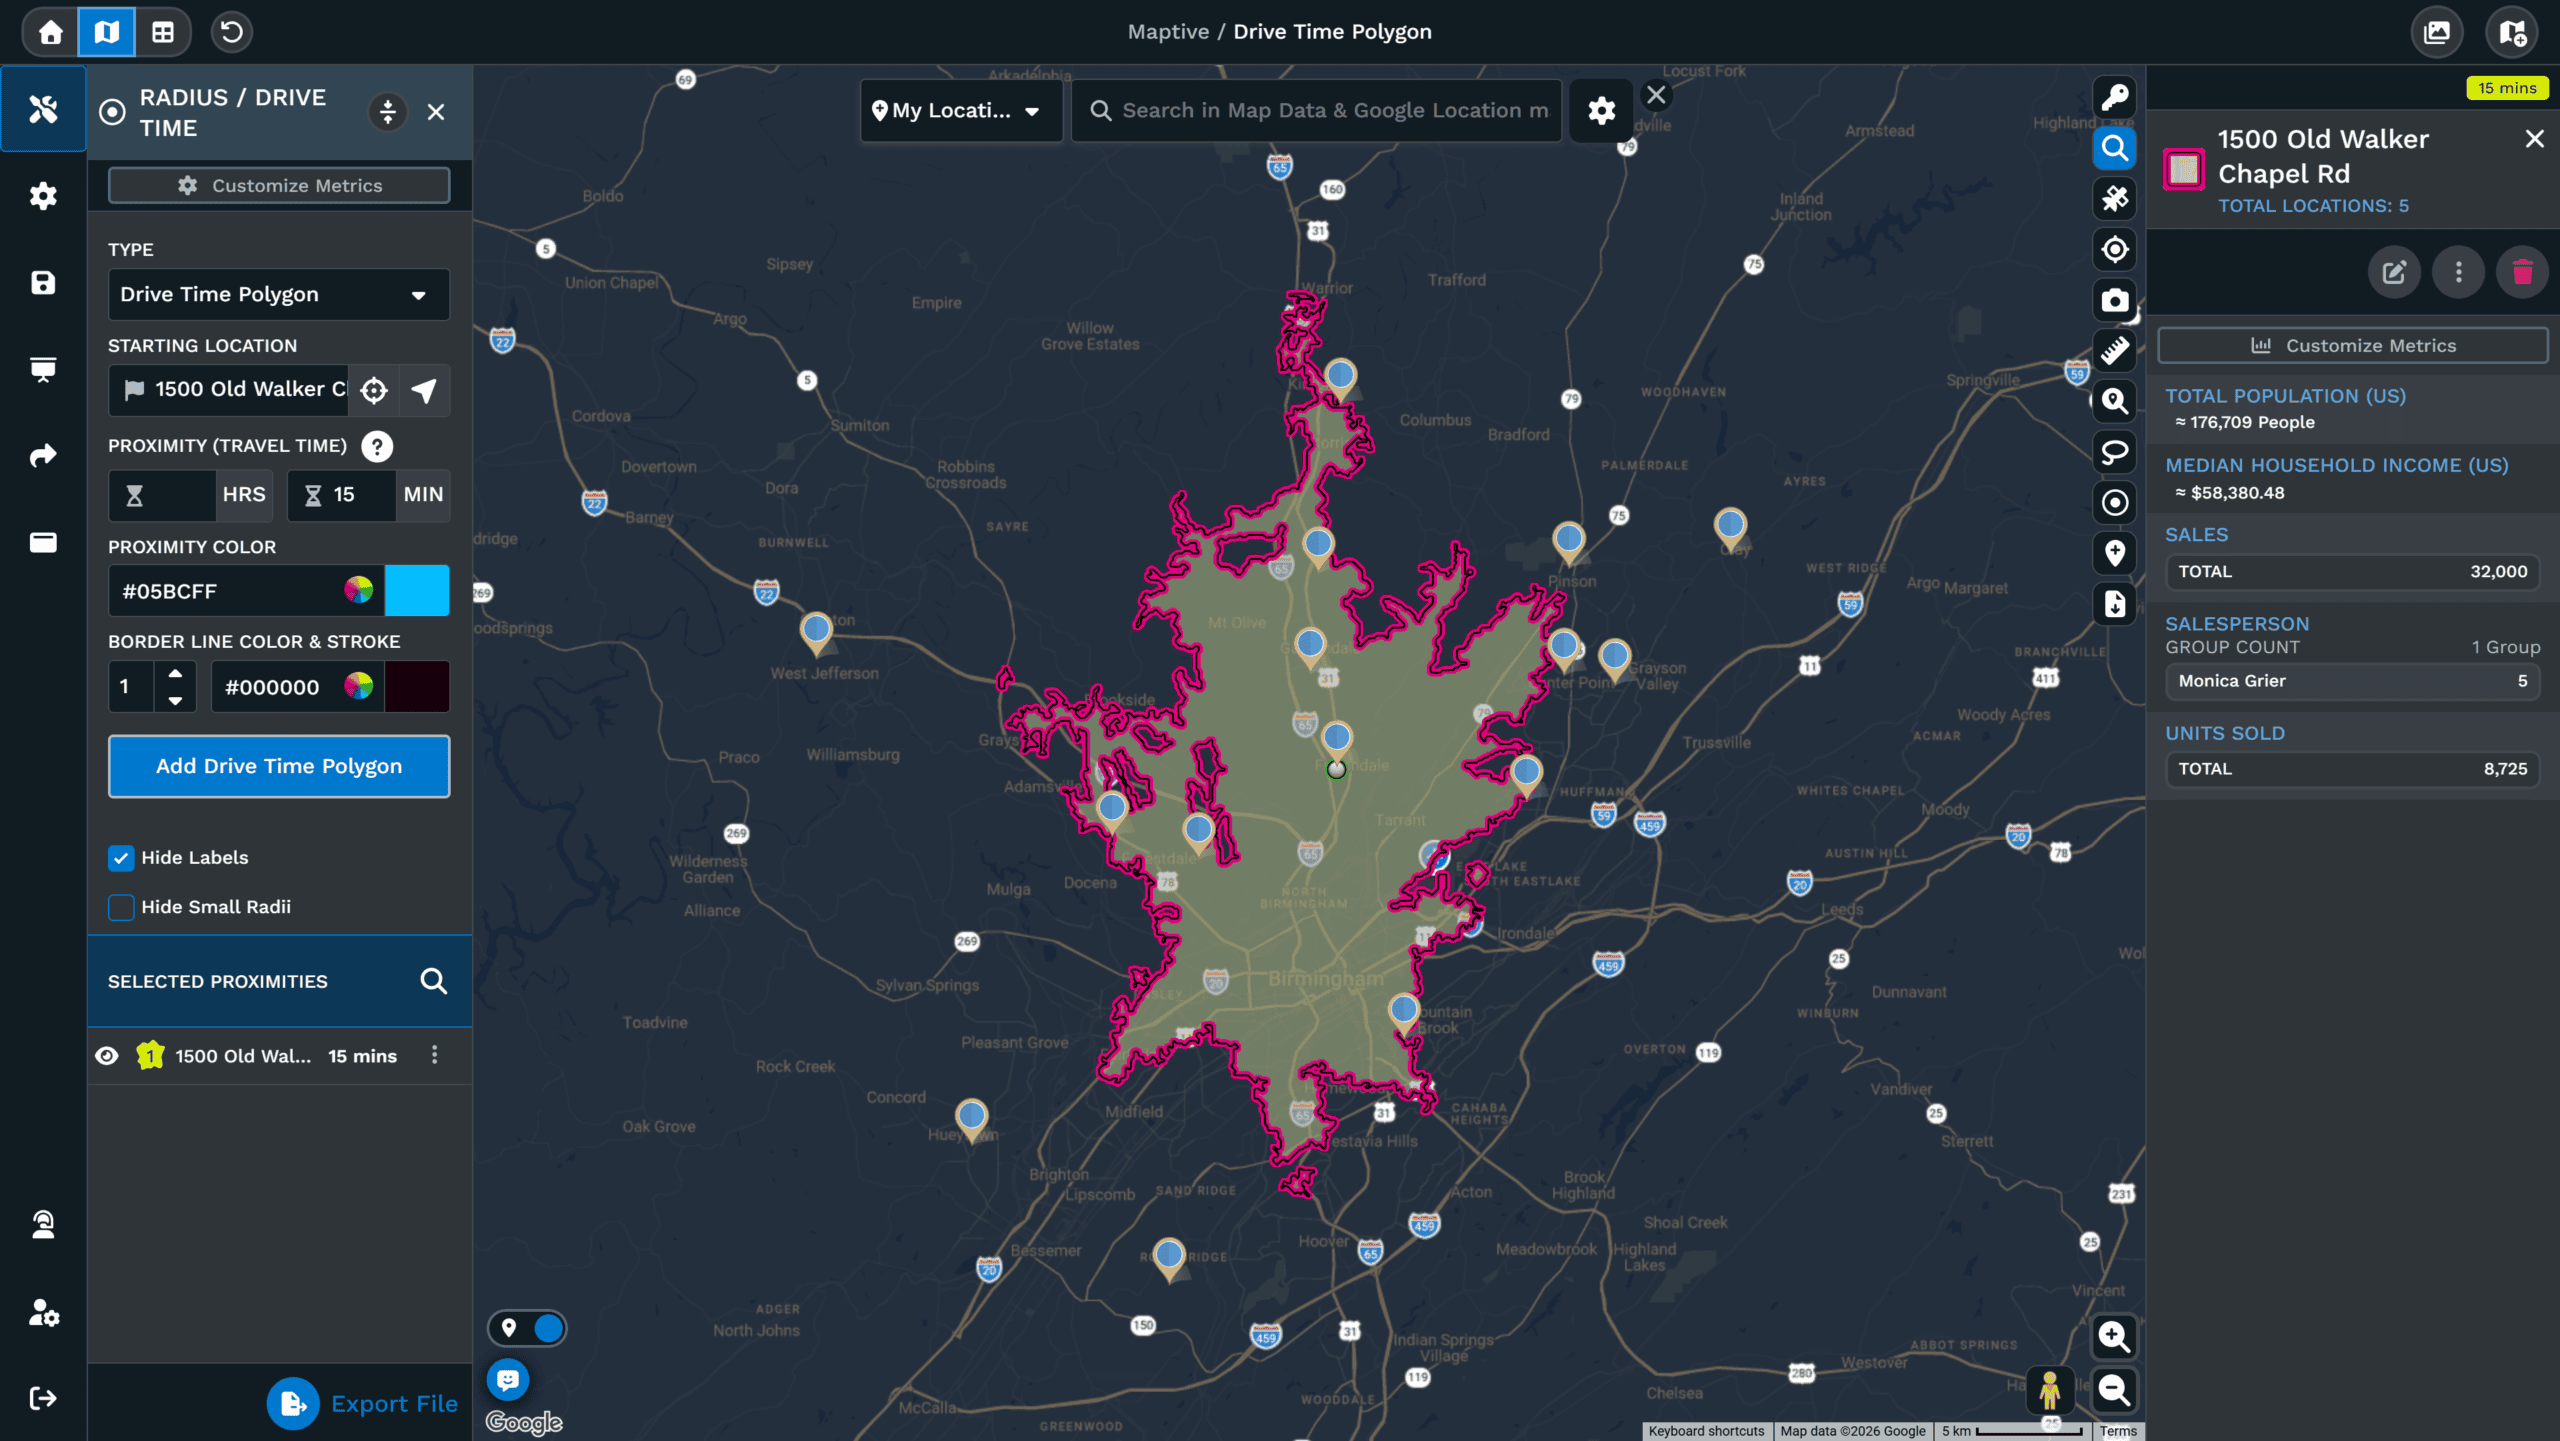
Census data tells who lives around a location, not only who contacted the department. More than 50 variables down to block-group level come with every plan, Canadian data included.
Plan Routes for Field Crews
A field crew's day is a routing problem. Stops are ordered along the road network and directions reach the driver's phone, so more inspections and home visits fit into one day.
One Upload, Every Question Answered
Departments rarely ask only one question of their data. Because heat maps and site comparisons read the same uploaded file, the next question costs nothing new at all.
Heat Maps of Service Demand
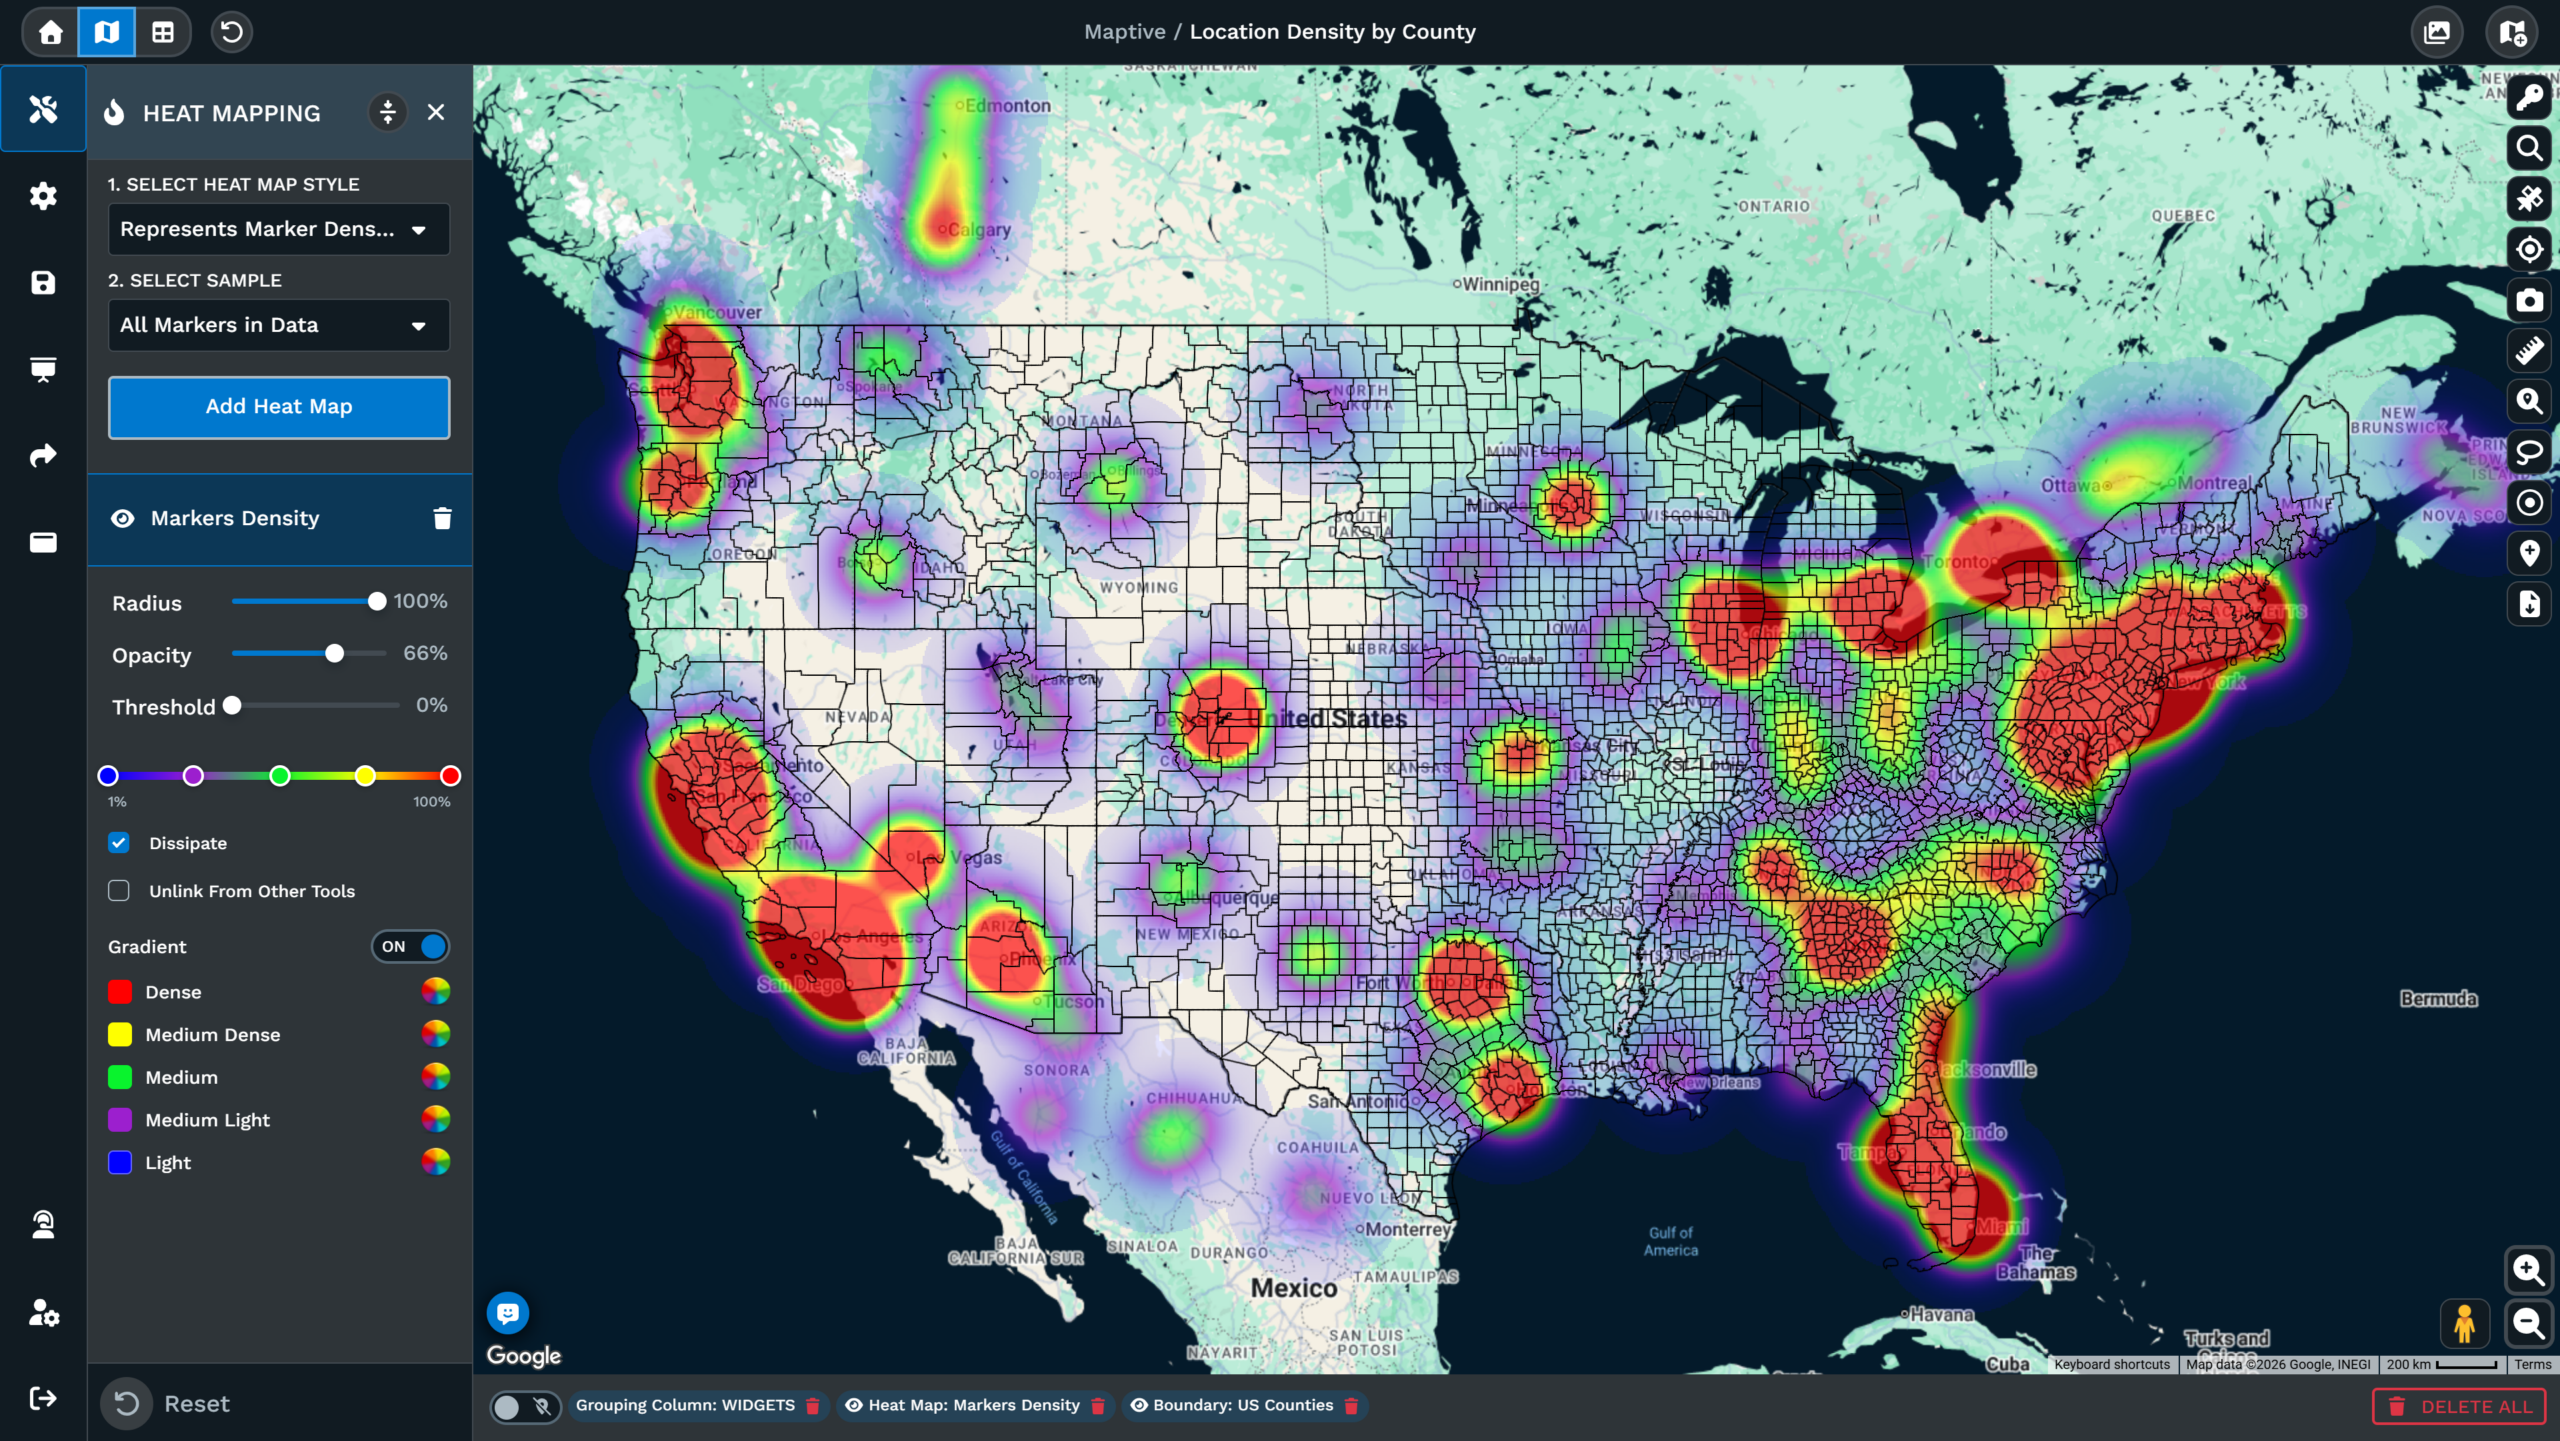
Request volume concentrates somewhere before anyone proves it, and a heat map of request counts shows where. Weighting by cost per case separates expensive areas from busy ones.
District and Ward Boundary Maps
Districts built from county, ZIP or tract lines recalculate their totals when a boundary moves, which turns redrawing into a what-if exercise. The final set exports for the record.
Site Selection for Public Facilities
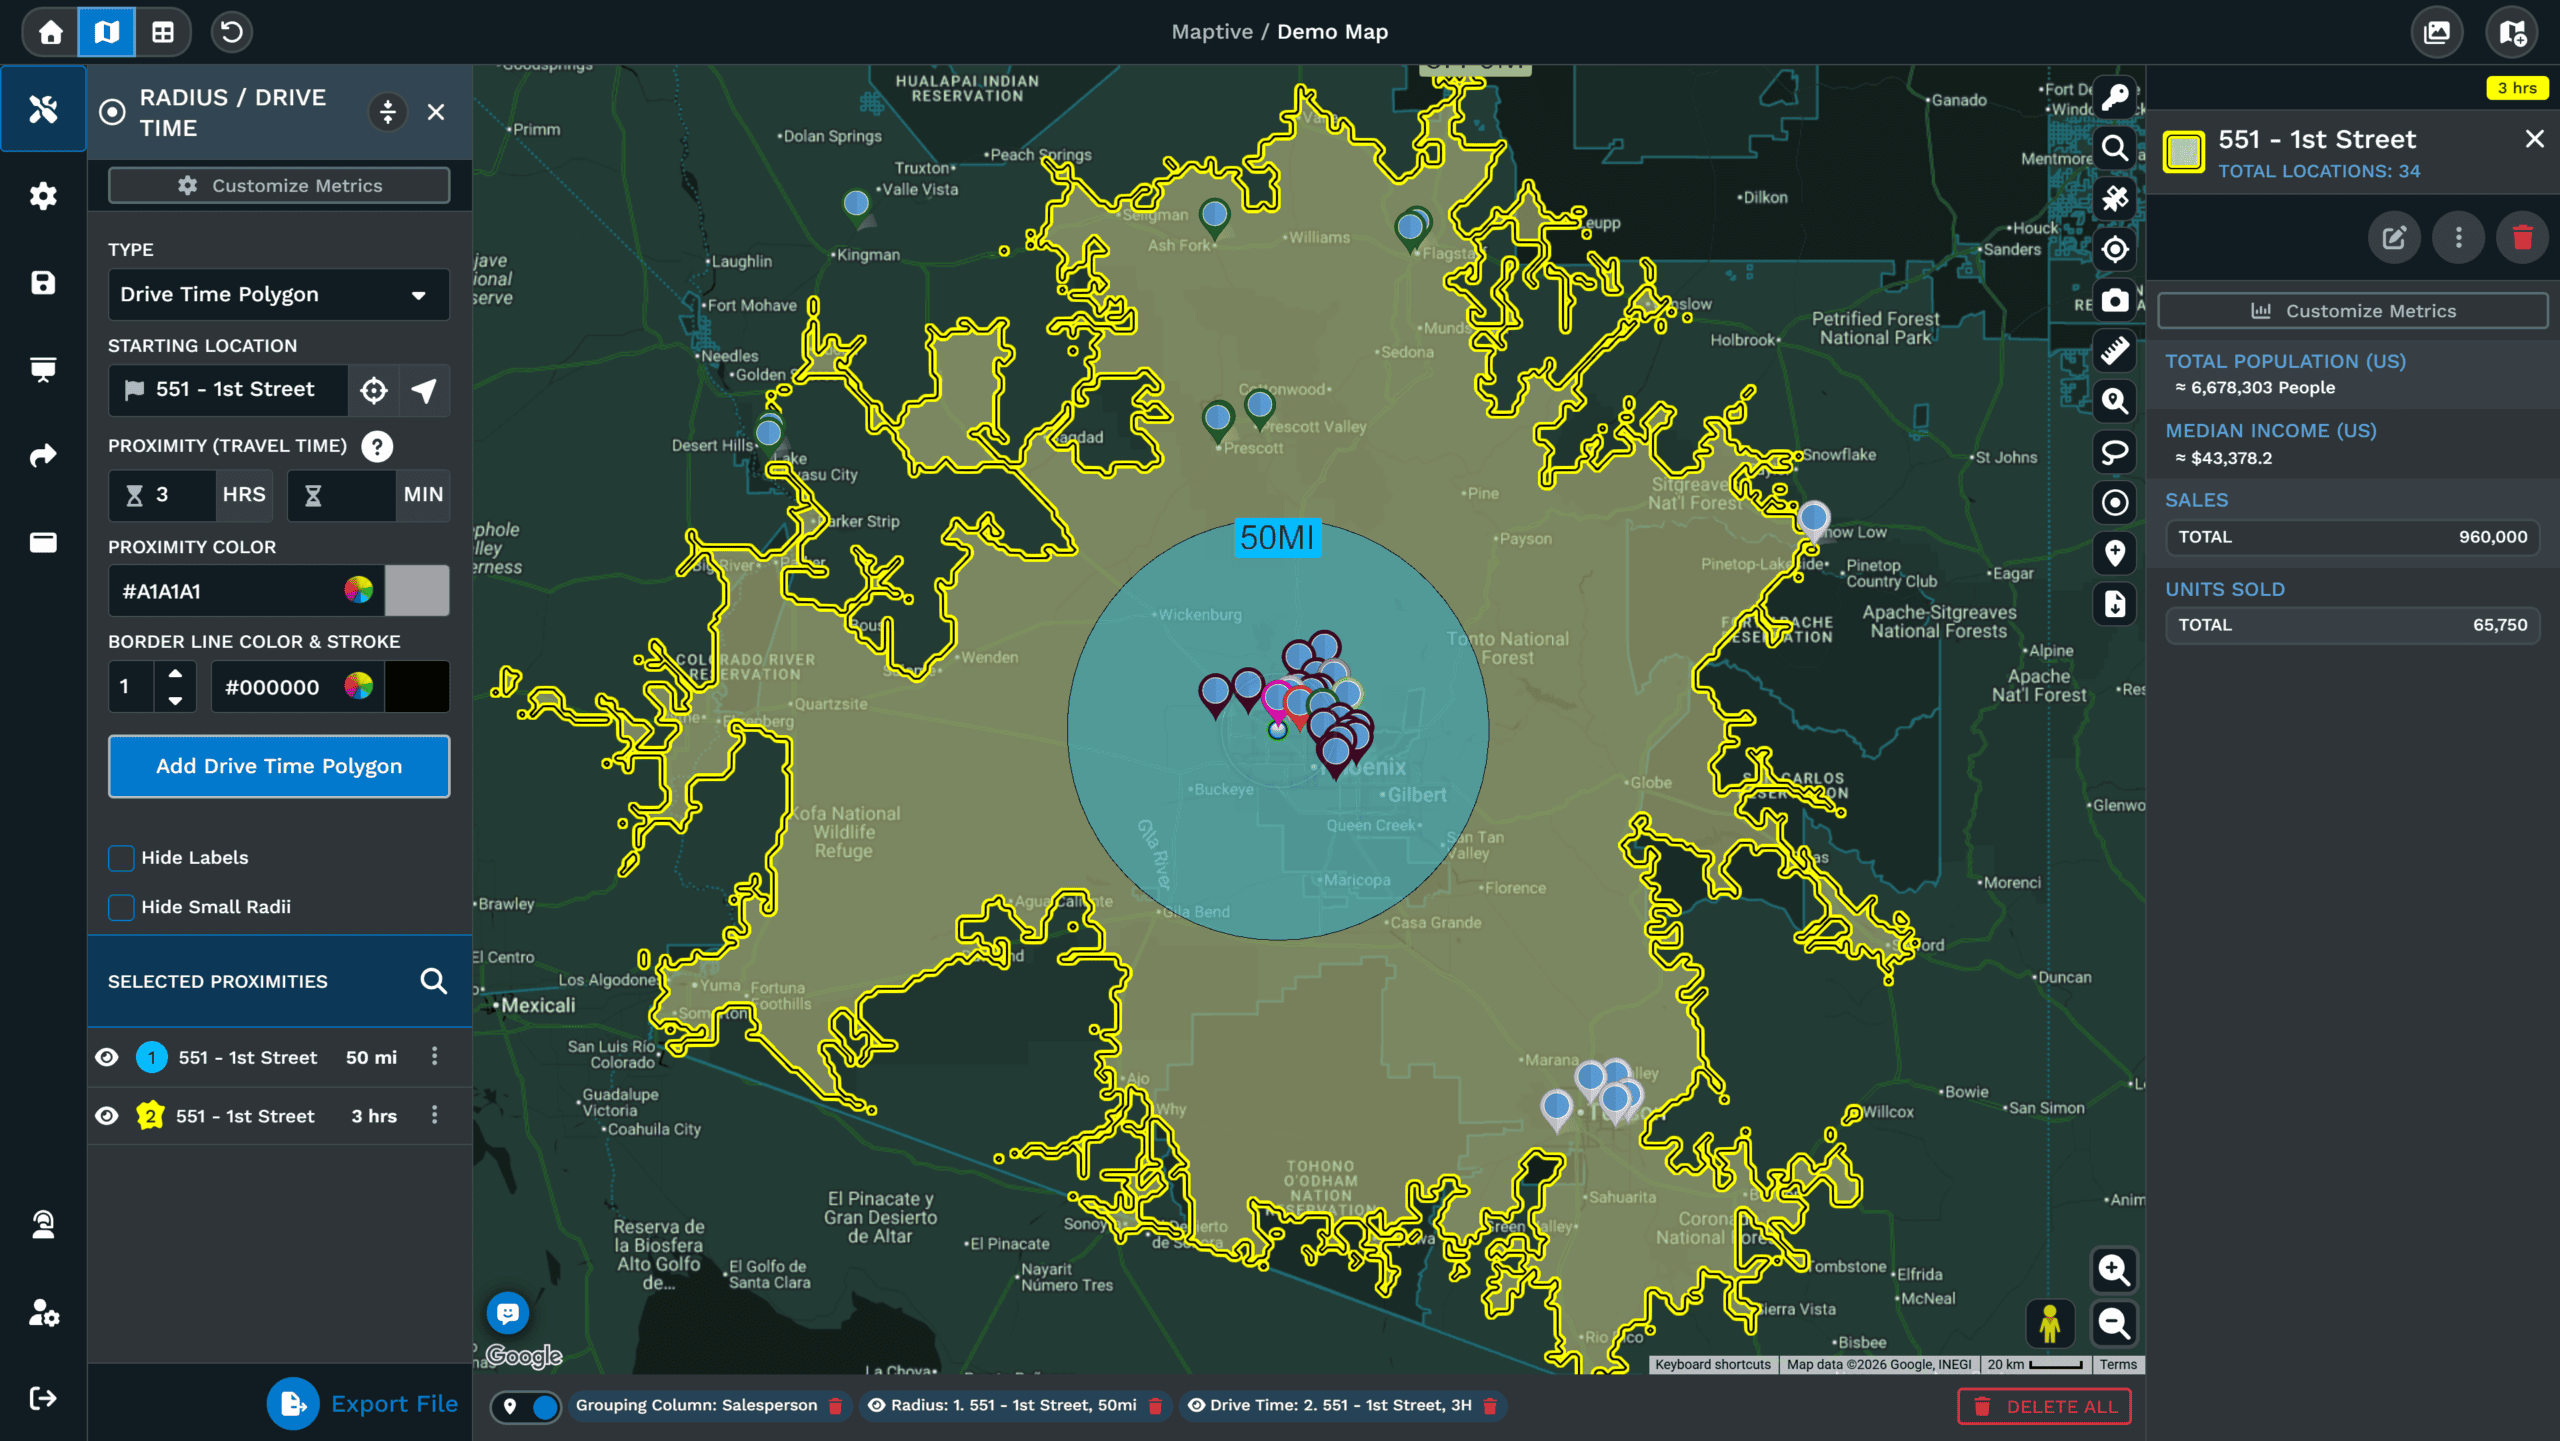
Siting a facility starts from the people it would serve. A radius circle around each candidate address counts the records inside, with census data profiling the surrounding area.
Public-Facing Maps for Your Website
A map residents can open without a login answers that question for everyone at once. Embed it on the department site or share the link, with viewer tools and columns set by you.
Cleared by the Department of Energy's Review
For government software, procurement is the test, and the US Department of Energy cleared Maptive through its own security review before adopting it. The platform also passed Salesforce's AppExchange review, with 99.9% uptime across 2025.
Every Mapping Tool on Every Plan
Budget requests name a number, and Maptive's number covers everything. Each tier includes all 60+ tools and the census dataset, differing only in users and capacity. Invoice or check payment fits offices that cannot pay by card.
See Your Government Data on a Map
Upload a spreadsheet and get a working map in minutes, with every tool unlocked from the first login.
Frequently Asked Questions
What is government mapping software?
It is software that turns the location records a department collects into a map staff can filter and analyze. Maptive opens in a browser and needs no GIS background, because the map builds from plain spreadsheet columns rather than spatial file formats. The toolset covers everything from heat maps and district boundaries to spreadsheet exports taken straight from the map. More than 60 tools come on every plan, and nothing is reserved for a higher tier, so a small department gets the same capability a federal agency uses.
How much does government mapping software cost?
Maptive's entry option is a 45 Day Pass at $250 for one user, sized for a defined project or a one-time study. Annual plans start with Pro at $1,250 a year, or $110 a month billed monthly. Team runs $2,500 a year, or $220 a month, for five users with collaboration and a dedicated success manager, and Enterprise pricing is volume-based for ten or more. All 60+ tools and the census data come with every tier, so the choice is about users and capacity rather than features.
Is there a free trial of Maptive for government teams?
Yes. Ten days, every feature unlocked, no credit card and no billing information collected at signup. Your department evaluates the platform on its own records rather than demo data, so anything built during the trial reflects actual workloads. Upload a spreadsheet or paste from the clipboard, and a working map is ready in minutes. A Google Sheet can also stay connected for data that changes. Support by phone and email is available during the trial. When the 10 days end, the account expires unless you choose a plan.
Can government staff use Maptive without a GIS background?
Yes, and that is the design goal. Maptive was built for people who have useful location data and no training in geographic information systems. The tools work through the map interface, and every change shows its effect as you click. Most users have a first working map within about thirty minutes. When a question comes up, the US and Canada support team answers by phone and email in under 15 minutes, and onboarding sessions can walk a whole department through its first maps.
How do I map addresses from a department spreadsheet?
An Excel or CSV file uploads directly, and rows can also be pasted from the clipboard or connected from a Google Sheet. Geocoding happens during the upload and reconciles what the file contains, including missing ZIP codes and inconsistent address fields. Every other column stays attached to its marker, so fields like program, status or case type become things to color by and filter on. For records that change often, a connected Google Sheet refreshes the map when the sheet does.
Can Maptive maps be shared with the public?
Yes. A published map opens from a link without a Maptive account, and it can be embedded on your website as an interactive map residents can explore. The map owner controls what viewers can do, from which tools appear to which data columns are visible, and a password can be required for internal audiences. The same map serves everyone it is shared with, so a correction made once reaches every viewer without the file being re-sent. No account or license is needed on the viewer's side.
What demographic data does Maptive include for government use?
Every plan includes more than 50 US Census variables at no extra cost, published at state, county, ZIP code, census-tract and block-group level, with Canadian data included as well. The variables cover population density and household income, among other measures, and they layer underneath your own records. That pairing lets a department compare where requests or cases come from against who lives in each area, which supports service-area planning and facility siting. It is included on every plan, with nothing extra to buy.
Is government data secure in Maptive?
Maptive encrypts data with 256-bit SSL in transit and at rest, and access controls include two-factor authentication and single sign-on, with role-based permissions set per user, so a viewer can be given one map and nothing else. Audit logging records what was accessed and by whom, and regional data-storage options are available where records must stay in a particular jurisdiction. Uptime across 2025 was 99.9%. The platform passed the Salesforce AppExchange security review, and the Department of Energy cleared it through its own review.
Does Maptive support government procurement and invoicing?
Yes. Payment by invoice or check is available, and monthly invoicing can be arranged through the sales team for plans that need it. The Enterprise plan covers ten or more users with volume-based pricing, a dedicated success manager and white-glove onboarding that includes data cleaning, map setup and team training. At the federal level, the Department of Energy adopted Maptive after its own procurement and security review. Reach the sales team to set up the option that fits your finance process.
How many locations can fit on one government map?
One map can show over 200,000 markers, and a data set can include up to 100,000 locations on the Pro and Team plans, or 50,000 on the 45 Day Pass. Enterprise capacity is volume-based for larger holdings. Every marker has the columns that came with it, so filtering and heat weighting work at full volume rather than on a sample. For very large files, the filter tool is the practical way to work, since one segment can be isolated and shared on its own.








