

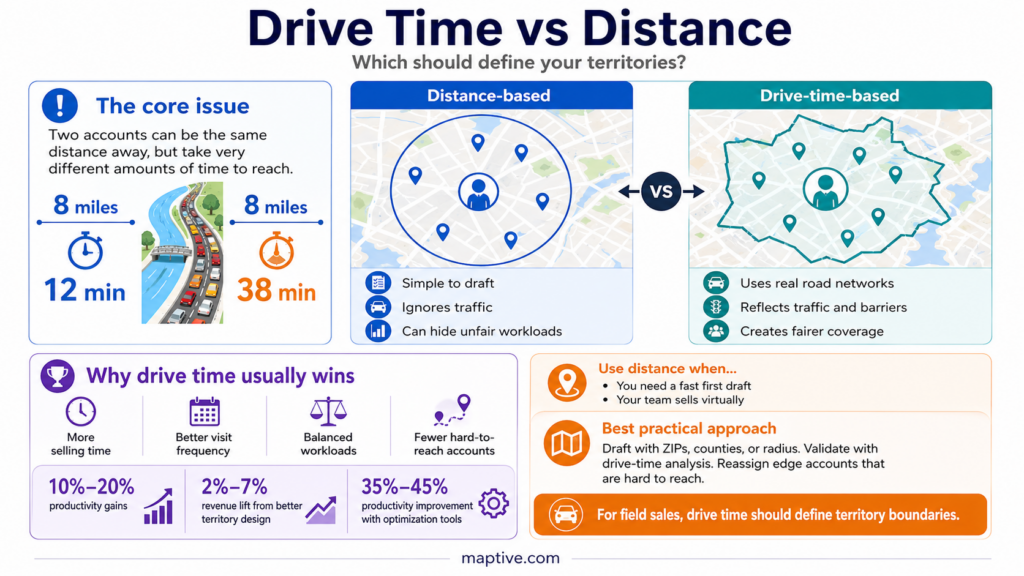
Two accounts sit 8 miles from your rep’s office on the map. One takes 12 minutes to reach. The other, separated by a river crossing and a stretch of congested surface streets, takes 38 minutes. If both accounts were assigned to the same rep based on a 10-mile radius, the planning math would treat them as equivalent. The reality of selling to them is anything but.
Territory planning has historically relied on distance-based methods because they are simple. Draw a radius, assign the ZIP codes, move on. But straight-line distance tells you how far apart two points are on a map. It does not tell you how long it takes a rep to get from one to the other, which is the metric that determines how many accounts a rep can work in a day, how frequently they can visit, and how much windshield time eats into their selling hours.
Drive time accounts for roads, traffic patterns, speed limits, and physical barriers. Distance does not. The difference between these two approaches changes territory boundaries, workload balance, and ultimately revenue output.
How Straight-Line Distance Misleads Territory Planners
What a Radius Circle Gets Wrong
A 10-mile radius drawn from a central point covers everything within 10 miles in every direction, producing a perfect circle on the map. The problem is that no real-world territory works like a circle. Rivers, highways without exits, mountain passes, railroad crossings, and one-way street grids all distort actual travel patterns away from that neat geometric shape.
A neighborhood 1.5 miles from a rep’s office may take 20 minutes to reach if a river separates the two and the nearest bridge is 3 miles upstream. The radius includes that neighborhood in the territory as if it were a short drive away. It is not. The rep either skips those accounts because the travel time is not worth it, or they burn 40 minutes round-trip to make a visit that looked like it should take 10.
Where Radius-Based Planning Creates Unequal Workloads
When territories are built using distance, reps in different geographic settings receive vastly different actual workloads despite appearing balanced on paper. A rep in a grid-pattern metro area with a 15-mile radius territory might reach any account in 20 minutes. A rep in a suburban sprawl territory with the same 15-mile radius might spend 45 minutes reaching accounts on the far edge because the road network does not cooperate.
The quota for both reps is the same. The number of accounts may be the same. But the available selling hours after travel time are dramatically different. One rep has time for 6 client meetings a day. The other can fit 3.
Over a full quarter, that gap compounds. The metro rep completes roughly 264 meetings. The suburban rep completes 132. Both are working a full schedule and putting in equal effort. The difference is entirely structural, built into the territory design by a distance-based methodology that treated both zones as equivalent because the radius size was the same.
This is why organizations that redesign territories around drive time rather than distance see productivity gains of 10% to 20%, according to research and other field sales analytics sources. The gain does not come from reps working harder. It comes from reps spending a larger portion of their day in meetings rather than in transit.
| Planning Method | What It Measures | Accounts for Traffic | Accounts for Road Layout | Best Used For |
|---|---|---|---|---|
| Straight-line radius | Distance between two points | No | No | Quick estimates, initial scoping |
| ZIP code grouping | Administrative boundaries | No | Partially | Rough territory segmentation |
| Drive time polygon | Actual travel time via road network | Yes | Yes | Field sales territory design, workload balancing |
| Drive distance (road miles) | Actual road distance traveled | No | Yes | Delivery and logistics planning |
How Drive Time Produces More Accurate Territory Boundaries
What a Drive Time Polygon Reveals
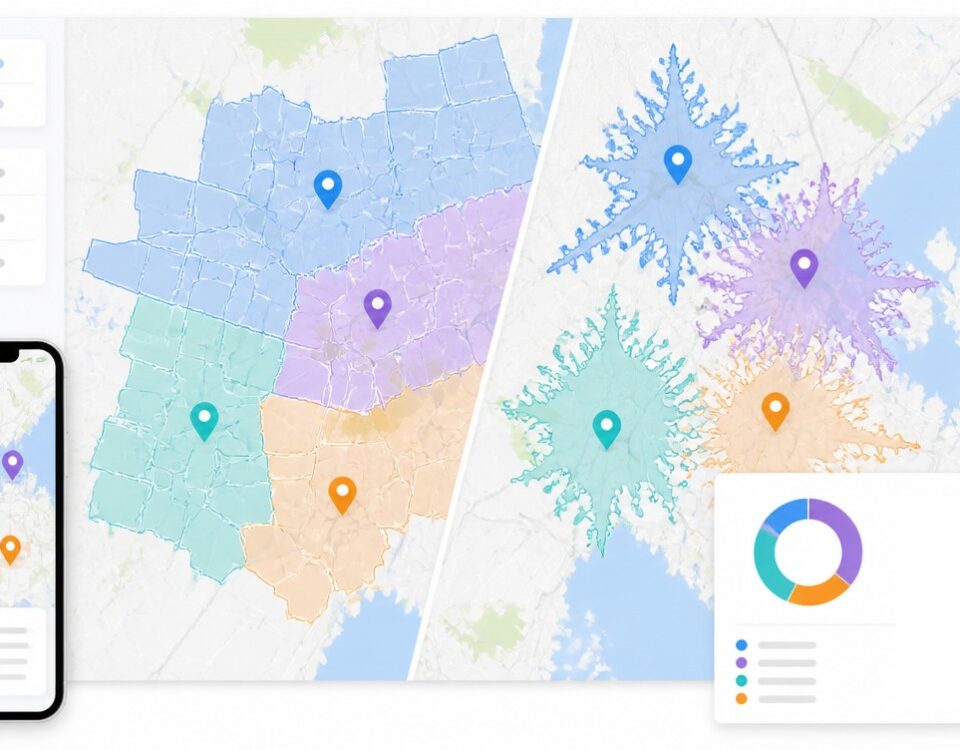
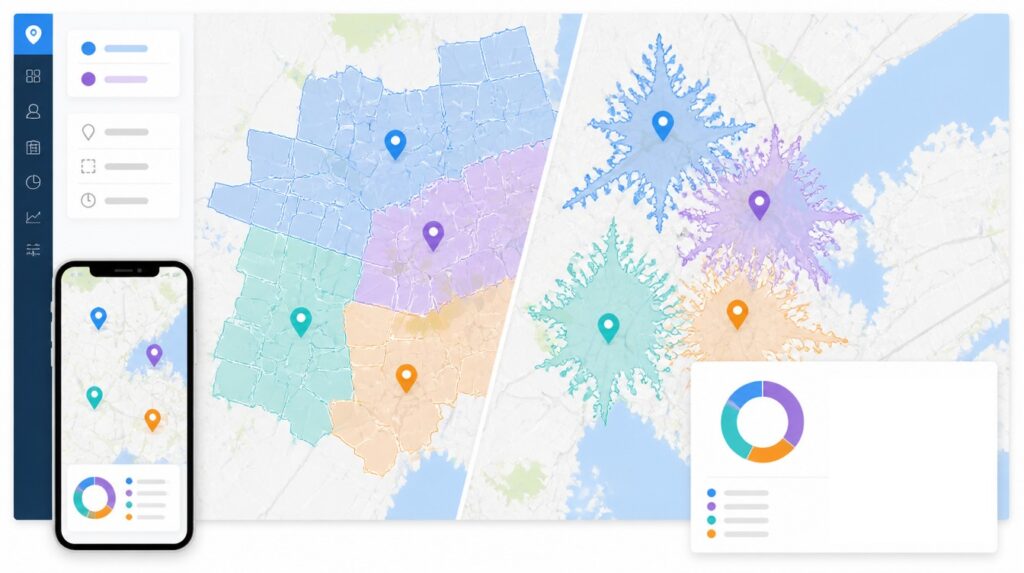
A drive time polygon traces every point reachable from a location within a set number of minutes via the actual road network. The shape is irregular. In some directions, a rep may reach 25 miles in 30 minutes along a highway corridor. In another direction, they may only get 8 miles through congested city streets. That irregular shape is an honest representation of where the rep can sell within a reasonable travel window.
This matters for territory fairness. When you build territories using 45-minute or 60-minute drive time boundaries, every rep gets a zone calibrated to what they can reach and serve, not what looks even on a map. The rep covering a dense urban area may have a territory that spans 6 miles east to west. The rep covering a rural market may span 40 miles. Both can reach their accounts in roughly the same travel time, which means their available selling hours are comparable.
Adjusting for Peak Traffic and Time-of-Day Variation
Static drive time calculations use average road speeds. Real-world travel varies by time of day. A 30-minute drive at 10 AM might take 55 minutes at 5 PM. Territory boundaries built on off-peak drive times will overestimate a rep’s reach during the hours when most business meetings occur.
Advanced mapping tools account for time-of-day traffic patterns, generating drive time polygons that change shape depending on when the rep needs to arrive. A territory that covers a wide area at 10 AM may shrink by 30% during the 8 AM rush. This level of precision prevents the gap between planned coverage and actual coverage that simpler models create. Maptive’s drive time mapping generates these time-aware boundaries using real traffic data integrated with its Google Maps platform.
When Distance Still Has a Role in Territory Design
Quick Scoping and Initial Territory Drafts
Distance-based methods are not useless. They are fast. When a sales leader needs a rough draft of territory boundaries before a detailed analysis, drawing radius circles or grouping ZIP codes provides a starting framework that can be refined with drive time data in the next pass.
For industries where travel time is not a primary constraint, such as inside sales teams that cover territories virtually, distance-based segmentation may be sufficient. The territory boundary defines account ownership, not daily travel routes. In those cases, the precision of drive time mapping adds complexity without a proportional benefit.
Hybrid Approaches That Use Both Methods
Some territory plans use distance for the initial boundary definition and then validate with drive time analysis. You draw territories based on ZIP codes or counties, then overlay drive time polygons from each rep’s home base to confirm that the accounts within their zone are reachable within an acceptable travel window. Accounts that fall inside the distance-based boundary but outside the drive time polygon get reassigned to a closer rep.
This hybrid approach balances speed with accuracy. The initial draft goes fast. The drive time validation catches the edge cases where distance and travel time diverge most.
In practice, this means 80% of your accounts stay where they are after the validation pass. The remaining 20%, typically accounts near boundary edges or separated from the rest of the zone by a geographic barrier, get reassigned to a rep who can reach them more efficiently. That 20% reallocation often produces an outsized improvement in coverage because those accounts were the most chronically undervisited under the old plan.
The Revenue Impact of Choosing the Wrong Method
Lost Selling Hours and Reduced Account Coverage
Harvard Business Review research found that territory design alone can lift revenue by 2% to 7% without changing strategy or adding resources. The mechanism behind that lift is selling time. When territories are designed around drive time, reps spend less time in transit and more time in front of buyers. When territories are designed around distance, the reps with unfavorable road networks lose selling hours that their peers in better-connected zones retain.
Field sales teams that adopt route and territory optimization tools report productivity improvements of 35% to 45% within 6 months, according to industry benchmarks. Much of that gain comes from eliminating the wasted travel that distance-based territory design builds into the system.
Workload Imbalance and Rep Retention
Reps know when their territory is harder to work than a peer’s territory. A rep who spends 3 hours a day driving while a colleague in a better-connected zone spends 90 minutes will notice the disparity long before it shows up in a quarterly review. That frustration drives turnover. Territory design that accounts for drive time distributes the travel burden more evenly, which keeps the team intact longer.
Samsung provides a relevant benchmark here. After optimizing territory coverage and routing, the company cut operational costs by $8.8 million, a 25% reduction, and increased customer visits by 50%. Not every organization will see numbers at that scale, but the direction is consistent across field sales teams of all sizes: drive-time-based territories produce more visits per rep per week, lower travel costs, and better account engagement frequency.
The Compounding Effect on Pipeline
Accounts visited twice per quarter generate pipeline at a measurably higher rate than accounts visited once per quarter. When drive-time-based territory design frees up an additional 3 to 4 hours of selling time per rep per week, those hours convert into additional visits that compound across the entire territory. Over 4 quarters, the pipeline difference between a drive-time-optimized territory and a distance-based territory grows wider, not narrower. The structural advantage accumulates.
How to Transition from Distance-Based to Drive-Time-Based Territories
Running a Drive Time Audit on Your Current Map
Start by mapping every current account against drive time polygons drawn from each rep’s home or office location. Set the polygon to your standard acceptable travel time, typically 30 to 60 minutes for field sales. Any account that falls inside the rep’s assigned territory but outside their drive time polygon is a misassignment that costs windshield time every time it gets visited.
Maptive’s drive time tools let you draw these polygons instantly and layer them over existing territory boundaries. The overlap between the territory boundary and the drive time polygon shows you the portion of each territory that the rep can work efficiently. The gap between them shows you the problem.
Phased Rollout to Minimize Disruption
Switching from distance-based to drive-time-based territories does not need to happen overnight. A phased approach works better. Start with the territories that show the largest gap between distance boundaries and drive time reach. Reassign the outlier accounts in those territories first. Then move to the next tier of misalignment. Within 2 to 3 quarters, the full map can be rebuilt around drive time without a single disruptive overhaul.
The accounts that are hardest to reach under the current structure are also the accounts most likely to be underserved. Reassigning them to a rep with better geographic access immediately improves coverage frequency and buyer engagement for those accounts. The revenue benefit starts in the first month, not at the end of the transition.
Measuring the Before and After
Track 3 metrics to quantify the impact of the transition: average drive time per account visit, number of account visits per rep per week, and pipeline generated per territory per quarter. Pull these numbers for the 2 quarters before the transition and compare them against the 2 quarters after. The drive time metric should drop. The visits per week metric should rise. And the pipeline number, with a one-quarter lag for deals to develop, should follow.
Every territory map is a bet on how well your reps can cover their assigned geography. Distance-based bets assume the map is flat and the roads are straight. Drive-time-based bets account for how the world works. The second bet wins more often.


