


Team changes break the assumptions that your current territory map was built on. A departure, a new hire, a promotion, a restructuring: each one reshapes the workload equation. Account loads become uneven. Coverage gaps open. Pipeline stalls in the transition zone. The speed and precision of your rebalancing determines how much revenue you protect and how much you lose during the adjustment window.
This is a step-by-step process for rebalancing territories after any team change, grounded in data rather than gut instinct, and designed to minimize disruption to both your pipeline and your remaining reps.
Why Territory Rebalancing Fails When Done Reactively
The Cost of the “Divide and Distribute” Default
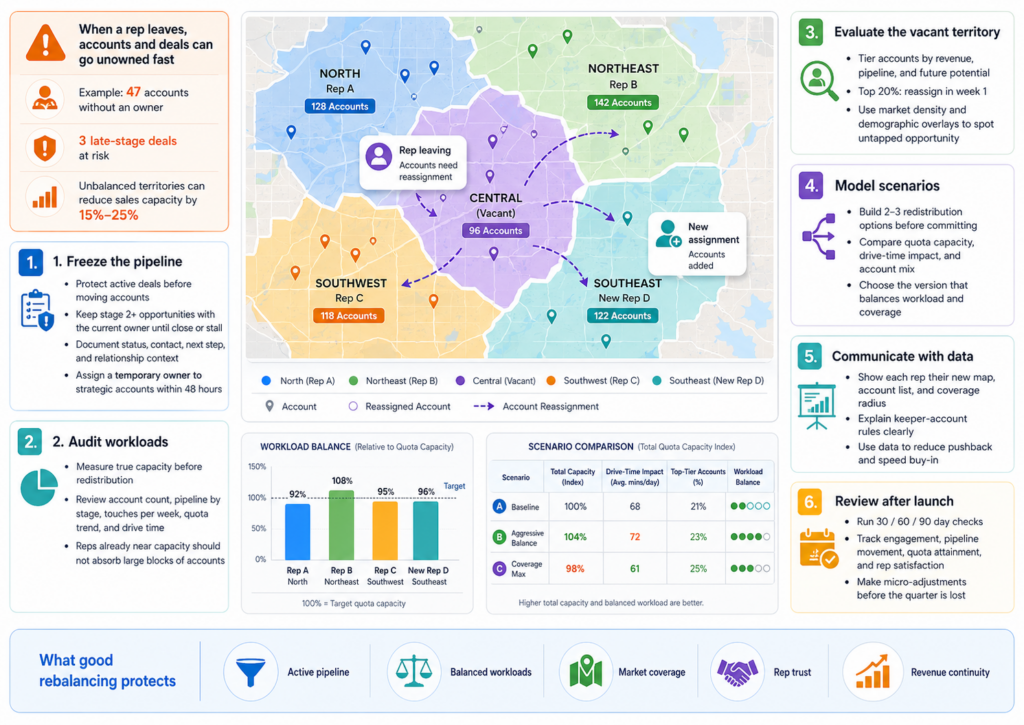
The most common response to a rep departure is splitting the vacant territory among the nearest reps. It is fast. It is also almost always wrong. The reps absorbing the extra accounts already have full workloads. Adding 15 or 20 accounts on top of their existing book means those accounts get less attention, not more. Within 60 days, the absorbed accounts show declining engagement, missed follow-ups, and stalled deals.
Research from the Alexander Group found that unbalanced territories reduce total sales capacity by 15% to 25%. A rushed redistribution that overloads your remaining team can push you into that range within a single quarter.
What Gets Missed in a Reactive Rebalance
Reactive rebalancing looks at accounts as a list to divide. It misses the geographic and demographic context that determines how efficiently a rep can work those accounts. Two accounts that sit 90 minutes apart by drive time cannot be worked with the same frequency as two accounts in the same office park. Without mapping the physical distribution of accounts against rep locations, the rebalance creates inefficiencies that erode selling time.
Step 1: Freeze the Pipeline Before Reassigning Accounts
Protecting Active Deals During Transition
Before any accounts move, identify every deal in active pipeline stages. Deals in late-stage negotiation or with pending proposals need immediate attention and a specific handoff plan. The general rule is to avoid pulling an account from any active opportunity in stages 2 and beyond until the deal either closes or stalls.
For each active deal, document the current status, the buyer’s primary contact, the next scheduled action, and any relationship context that a new rep would need to continue the conversation without starting over. This documentation takes time upfront but prevents the revenue loss that comes from a buyer feeling like they have been handed off to a stranger.
Assigning a Temporary Owner for High-Value Accounts
Accounts with annual contract values above your threshold for strategic accounts should be assigned a temporary owner within 48 hours. This does not need to be the permanent assignment. It is a holding action that ensures the account does not go dark during the rebalancing process. Pick the rep with the strongest existing relationship to the account, or the rep with the most relevant industry knowledge, regardless of geographic proximity.
Step 2: Audit Current Territory Workloads Before Redistribution
Measuring True Capacity Across the Remaining Team
A headcount change does not affect all territories equally. Before deciding how to redistribute, pull current workload data for every remaining rep: active account count, total pipeline value, average accounts touched per week, and quota attainment trend over the last 2 quarters.
| Metric | What It Tells You | Where to Find It |
|---|---|---|
| Active account count | Raw workload volume per rep | CRM account assignments |
| Pipeline value by stage | Revenue at risk during transition | CRM pipeline report |
| Accounts touched per week | Actual working capacity vs. theoretical | Activity logs or CRM touch data |
| Quota attainment (last 2 quarters) | If the rep is already stretched or has room | Compensation or performance reports |
| Drive time between accounts | Travel efficiency and geographic density | Map-based routing analysis |
Reps who are already at 95% of their working capacity cannot absorb 20 additional accounts without something breaking. The data tells you who has room and who does not.
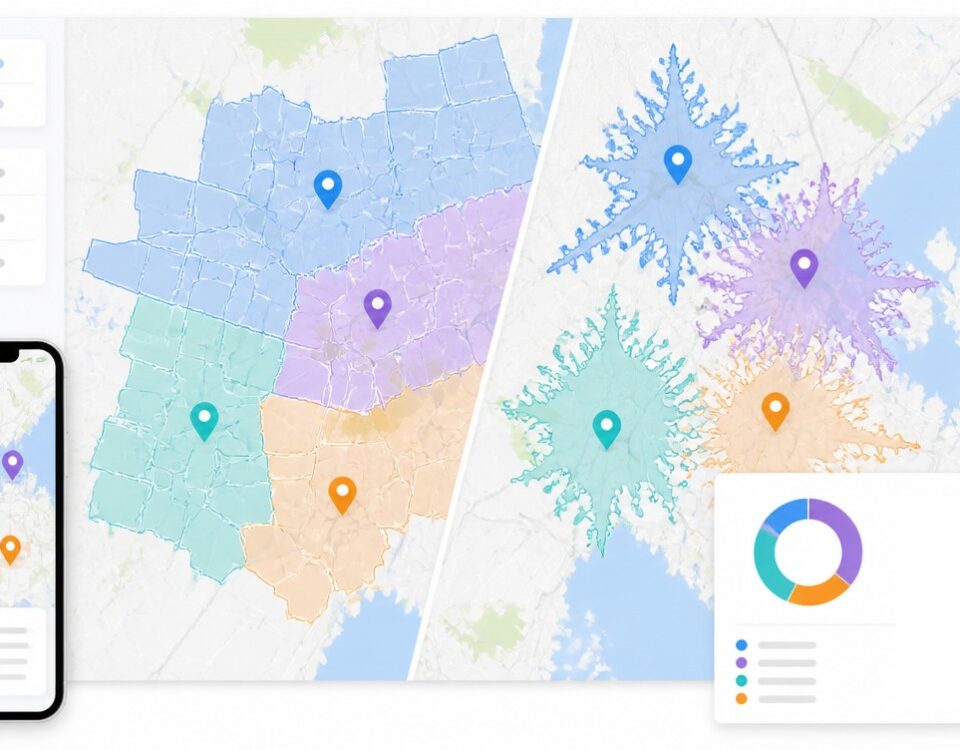
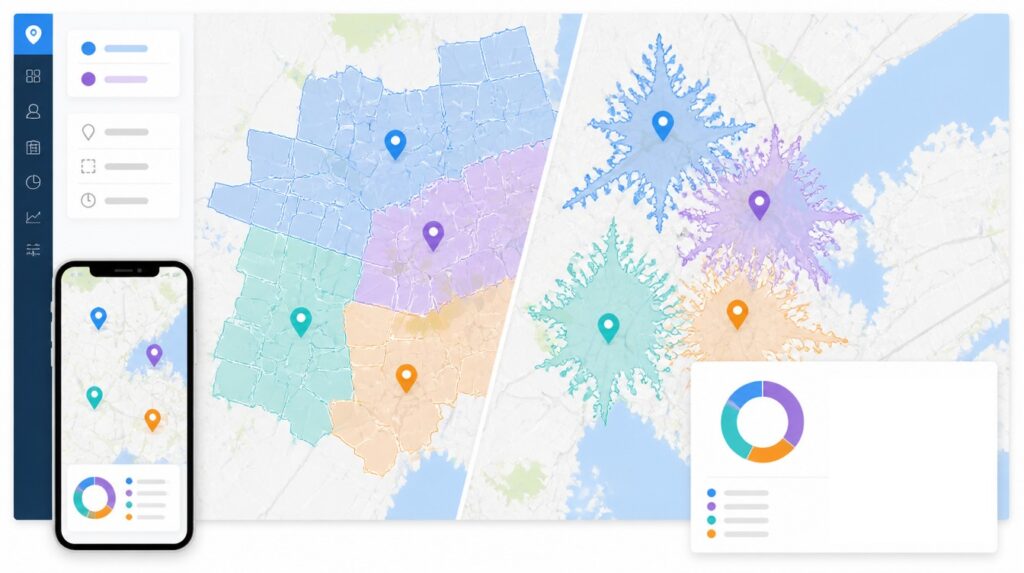
Identifying Capacity by Geography
Workload capacity is not uniform across a map. A rep covering a dense metro area may handle 120 accounts because drive times between meetings average 15 minutes. A rep covering a rural territory may handle 60 accounts because each visit requires an hour of windshield time. The number of accounts a rep can effectively manage depends on the geographic density and travel logistics of their zone.
Maptive’s drive time analysis tools let you draw time-based boundaries around each rep’s location to see how far they can reach in 30 or 60 minutes. This shows you which reps have geographic capacity to absorb nearby accounts and which ones would be stretched too thin by the additional coverage area.
Step 3: Map the Vacant Territory Against Market Potential
Separating High-Potential Accounts from Low-Priority Ones
Not every account in the vacant territory deserves the same urgency. Segment the accounts into tiers based on current revenue, pipeline stage, and future potential. High-value accounts with active pipeline need immediate reassignment. Mid-tier accounts with growth potential need a thoughtful match. Low-activity accounts with minimal engagement history can wait for the final territory structure.
This tiering prevents the common mistake of treating all accounts equally during redistribution. A $200,000 annual account and a $5,000 account that has not responded to outreach in 6 months do not warrant the same speed of reassignment.
Create a simple scoring matrix: assign each account a priority score based on current annual revenue, active pipeline value, engagement recency, and growth potential. Accounts scoring in the top 20% get reassigned within the first week. The middle tier gets placed in the scenario modeling phase. The bottom tier gets held until the full rebalance is complete. This prevents the common failure mode where a manager spends equal energy on every account and ends up protecting none of them well.
Using Demographic and Market Data to Evaluate the Zone
The vacant territory may contain untapped potential that the departing rep never developed. Before redistributing, overlay demographic data, business density, and industry concentration against the account list. If the territory contains 500 businesses matching your ideal customer profile but the departing rep only had 47 active accounts, the rebalance is an opportunity to expand coverage, not merely backfill.
Maptive’s demographic overlays, which include over 100,000 data layers at ZIP and census tract granularity, let you assess the full market potential of a vacant zone before deciding how to carve it up.
Step 4: Build Redistribution Scenarios Before Committing
Why Scenario Modeling Prevents Expensive Mistakes
The first redistribution plan you draft is rarely the best one. Building 2 or 3 scenarios and comparing them side by side reveals trade-offs that are invisible when you commit to a single plan. Scenario A might minimize drive time but overload one rep. Scenario B might distribute accounts evenly but split a natural market area across two reps. Scenario C might require hiring into the zone.
Each scenario should include projected quota capacity, estimated drive time impact, and account tier distribution per rep. Comparing these numbers makes the decision objective rather than political.
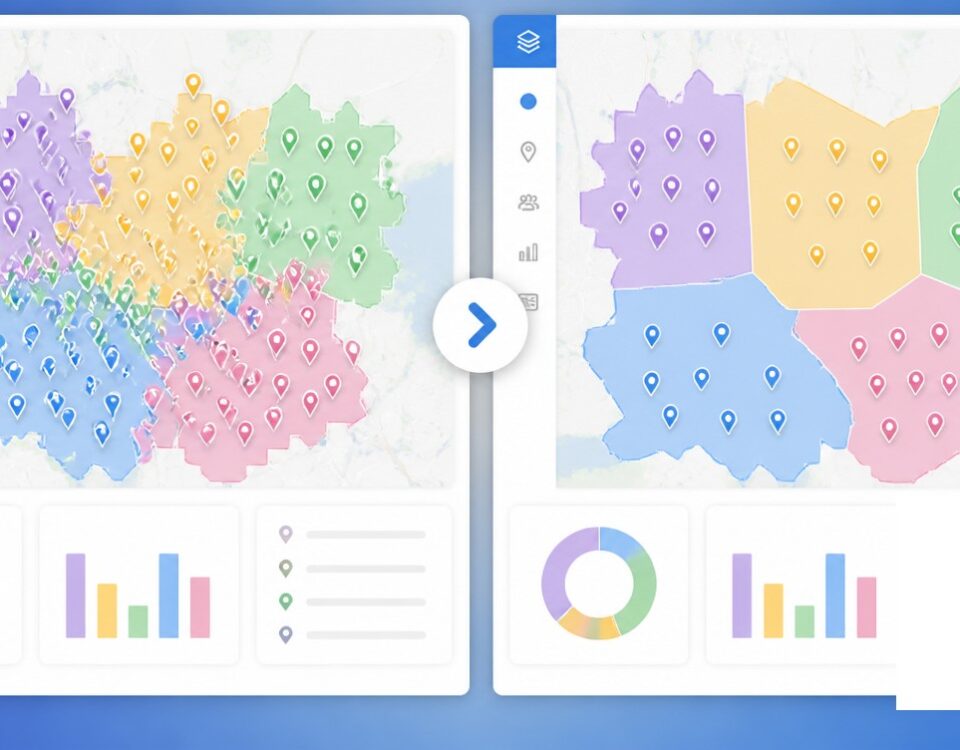
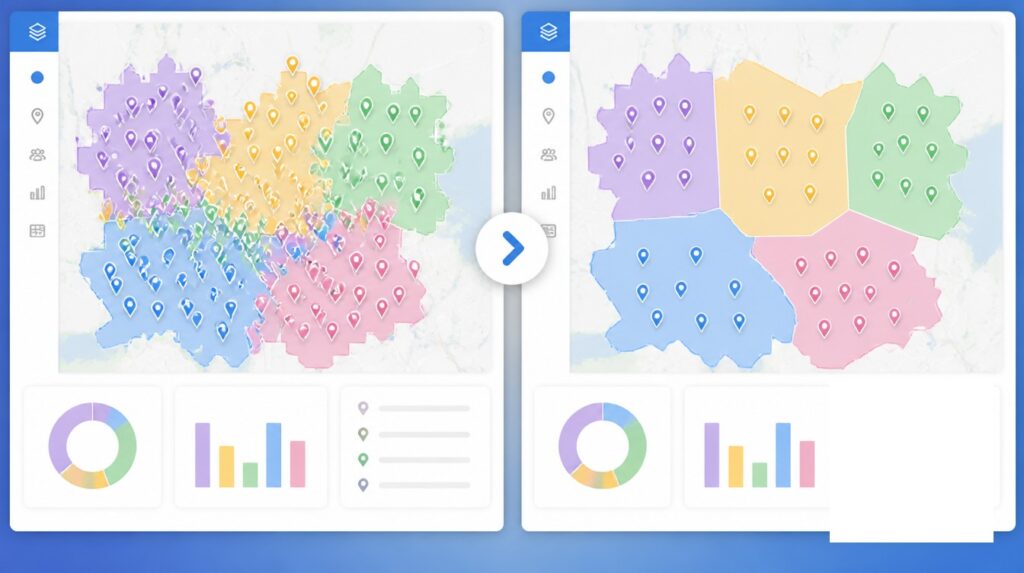
Running What-If Analysis on a Map
Territory planning tools that support scenario modeling let you redraw boundaries, reassign accounts, and see the impact on workload balance and coverage without making any permanent changes. You can test different boundary configurations, move accounts between territories, and evaluate each version against the metrics that matter before rolling anything out to the team.
This approach prevents the back-and-forth revisions that happen when a plan gets announced prematurely and reps push back on account assignments they see as unfair.
Maptive supports this workflow by letting you create and compare multiple territory configurations on the same map without altering the live assignments. You can redraw boundaries, drag accounts between zones, and recalculate workload metrics for each version, then present the strongest option to leadership with the data already built into the visual.
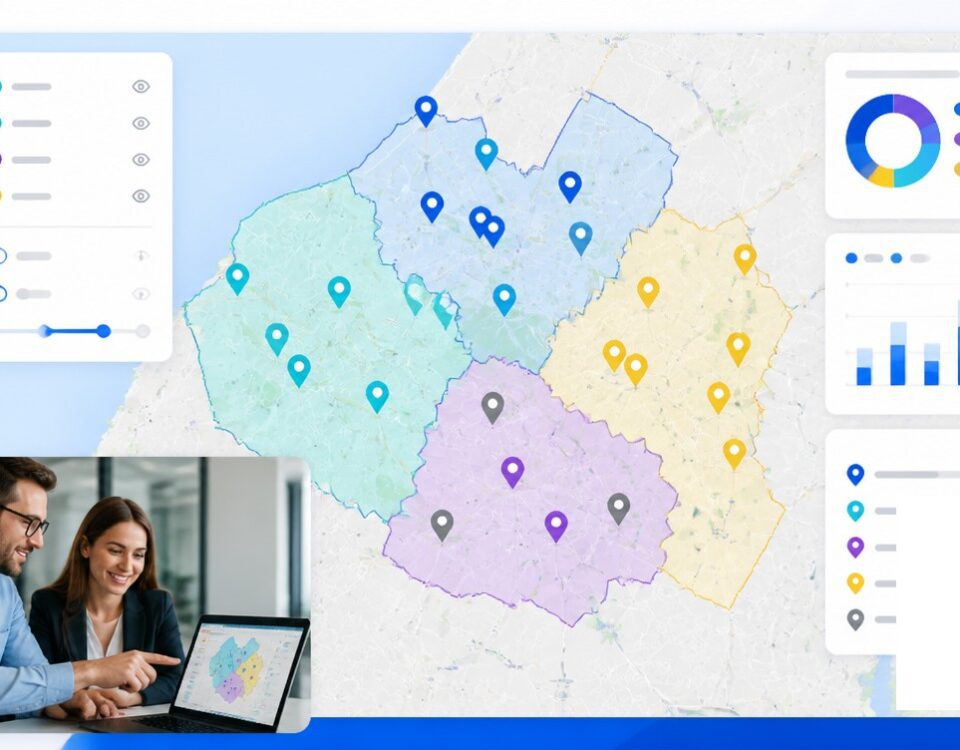
Step 5: Communicate the Rebalance with Data, Not Directives
Turning Resistance into Buy-In
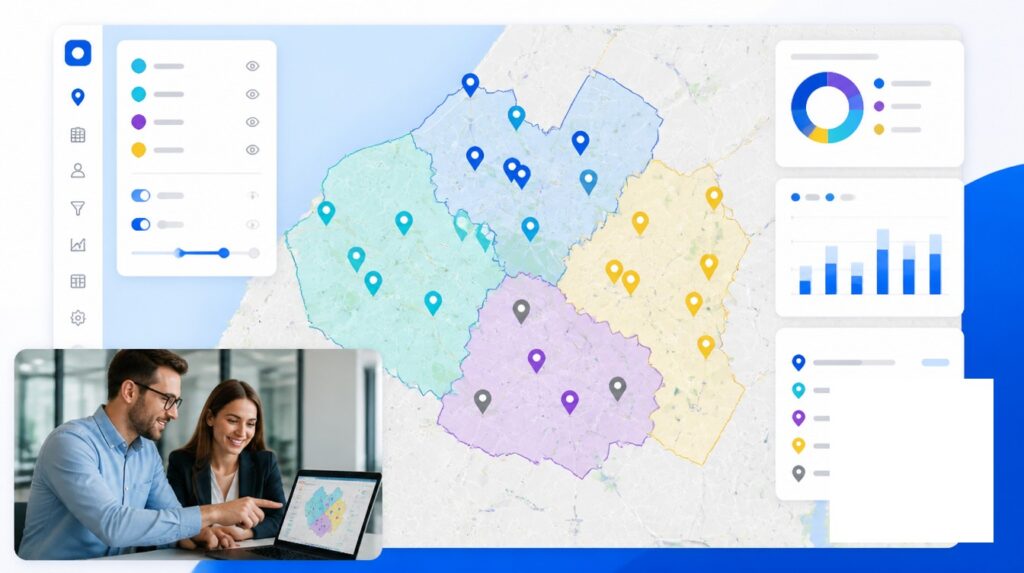
Territory changes trigger anxiety. Reps worry about losing accounts they have invested in, inheriting accounts they know nothing about, and having their quota adjusted in ways that feel punitive. The most effective way to reduce this friction is to lead the conversation with data.
Show each rep a map of their new territory with the accounts plotted, the drive time boundaries drawn, and the total addressable market calculated. When a rep can see that their new zone contains $2.4 million in addressable pipeline spread across 85 accounts within a 45-minute drive radius, the conversation moves from “why are you taking my accounts” to “how do I prioritize these.”
Maptive’s role-based access controls support this approach by letting you share territory-specific views with each rep while keeping the full organizational map visible only to managers. Each rep sees their own territory in detail without seeing every other rep’s assignments.
Handling Keeper Accounts
Keeper accounts are deals that a rep has been actively working and is close to closing. Pulling these away during a rebalance damages trust and risks the deal. The general practice is to let reps keep any account where they have an active opportunity above a defined stage threshold. The account transfers to the new territory owner only after the deal closes or formally stalls.
Define the keeper account rules before announcing the rebalance. Ambiguity here creates more conflict than any other part of the process.
Step 6: Set a Review Cadence After the Rebalance
The 30-60-90 Day Check
A rebalance based on good data and sound logic still needs validation against real-world results. Set review checkpoints at 30, 60, and 90 days after the new territories go live. At each checkpoint, compare actual account engagement, pipeline movement, and quota attainment against the projections from your scenario model.
If a rep’s actual activity rate is 40% below projection in their new accounts, the territory may need further adjustment. If pipeline in a newly covered zone is building faster than expected, the model was conservative and quotas may need revision upward.
Pay particular attention to the accounts that were classified as “keeper” accounts during the rebalance. Track their close rates against baseline. If keeper accounts are closing at a rate consistent with pre-transition averages, the handoff process worked. If close rates drop by more than 20%, the transition documentation or rep matching for those accounts needs improvement for future rebalances.
Also monitor rep satisfaction through quick pulse surveys at each checkpoint. Reps who feel overloaded at the 30-day mark will not improve at 60 days without intervention. Catching capacity issues early gives you time to make micro-adjustments before the quarter closes.
Building Rebalancing into Your Operating Rhythm
Team changes are not rare events. Reps leave, new hires join, promotions create gaps, and restructurings redraw the org chart. Treating each of these as a crisis leads to reactive decisions that accumulate into a territory structure disconnected from reality.
The better approach is a quarterly review cadence where territory health is evaluated alongside pipeline and attainment data. When a team change triggers a mid-quarter rebalance, the quarterly review validates the adjustment and catches any second-order effects that were not visible at the time.
Territory rebalancing done well protects pipeline, retains reps, and turns structural disruption into an opportunity to optimize coverage. Done poorly, it compounds the original loss and sets off a chain of secondary departures. The difference comes down to treating it as a data problem or an administrative one.


