

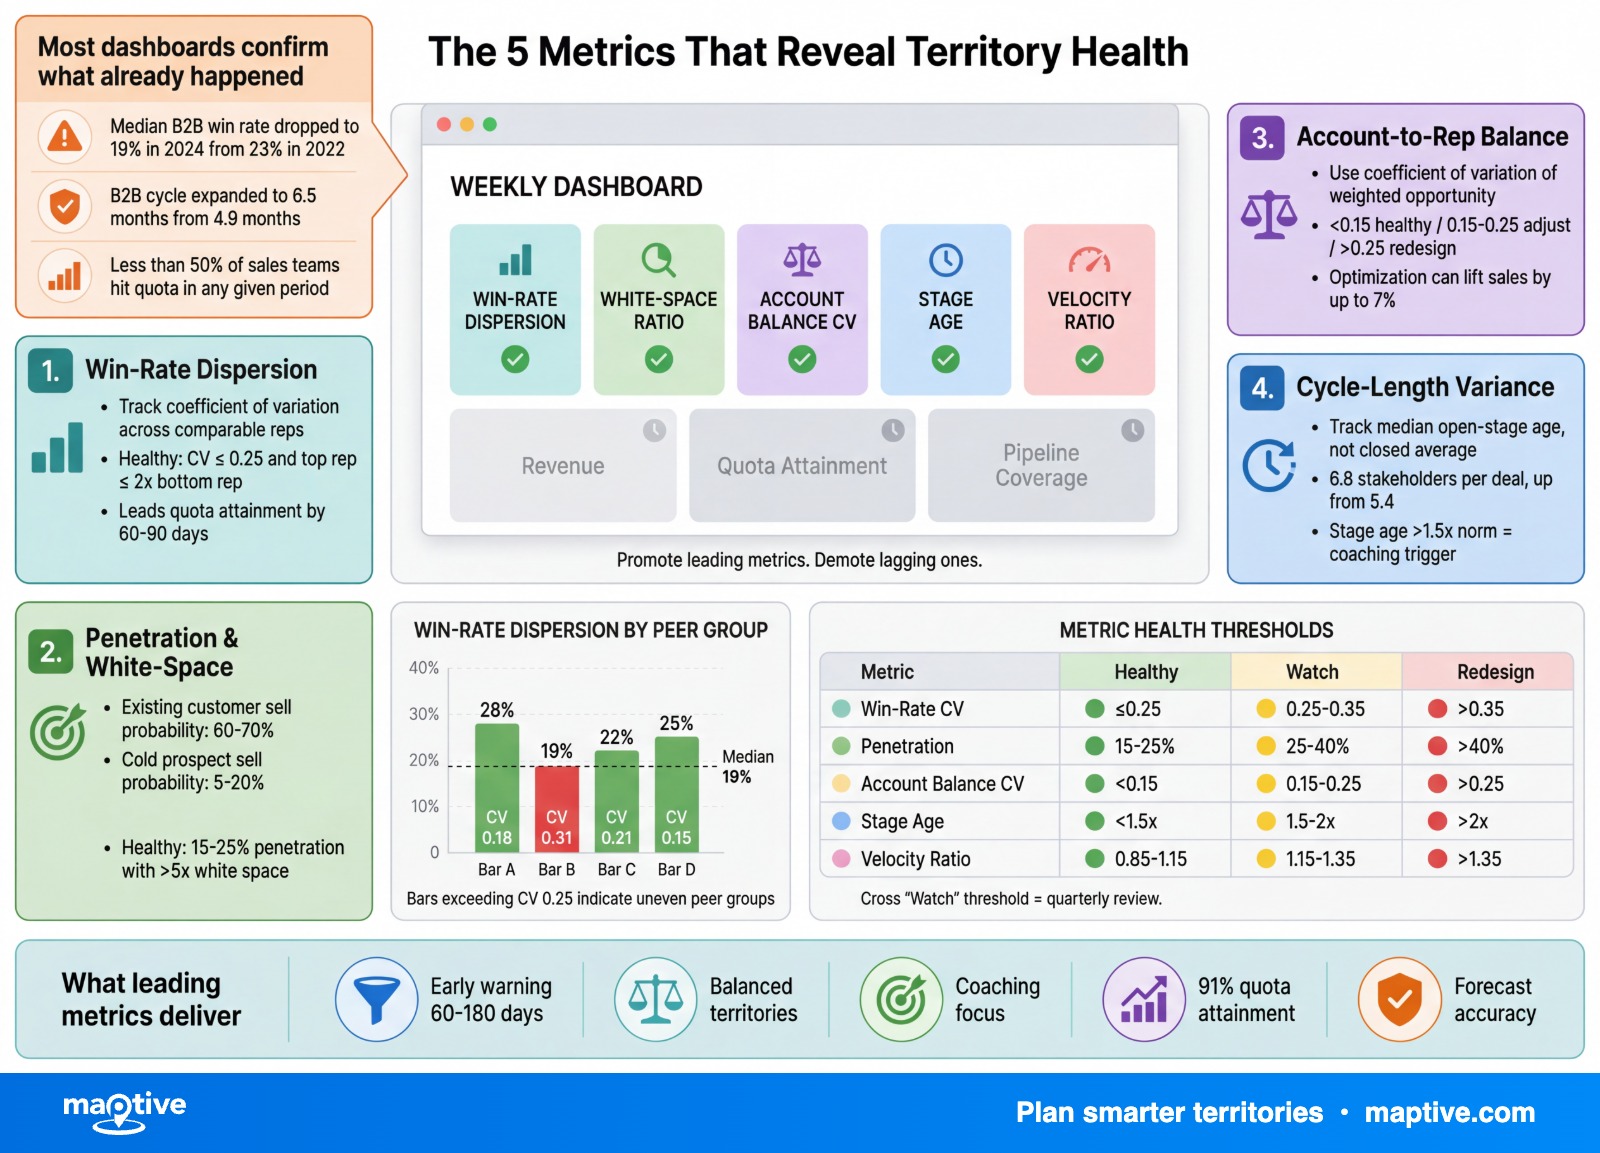
The five metrics that actually reveal territory health are win-rate dispersion across comparable reps, penetration and white-space ratio, account-to-rep balance against the system mean, cycle-length variance, and pipeline-velocity ratio. Each one leads quota attainment by 60 to 180 days. The dashboard most sales-operations teams keep does not feature any of them prominently.
The standard dashboard puts revenue, quota attainment, and pipeline coverage in the largest tiles. All three confirm what already happened. By the time quota attainment cracks for a territory, the behaviors that produced the crack are one or two quarters in the past, and the rep has been working on next quarter’s bookings against a problem the dashboard cannot see. Less than half of sales teams meet their quotas in a given period, and the post-mortem usually traces back to a deterioration that began long before the number turned.
The interesting question is not what to track. Most teams already track too much. The question is what to demote. The five metrics below belong on the weekly review. Revenue, quota attainment, and pipeline coverage belong on the monthly. Promoting the lagging metrics to the top of the dashboard is the design choice that produces dashboards busy enough to feel rigorous and late enough to be useless.
Win-Rate Dispersion Across Comparable Reps
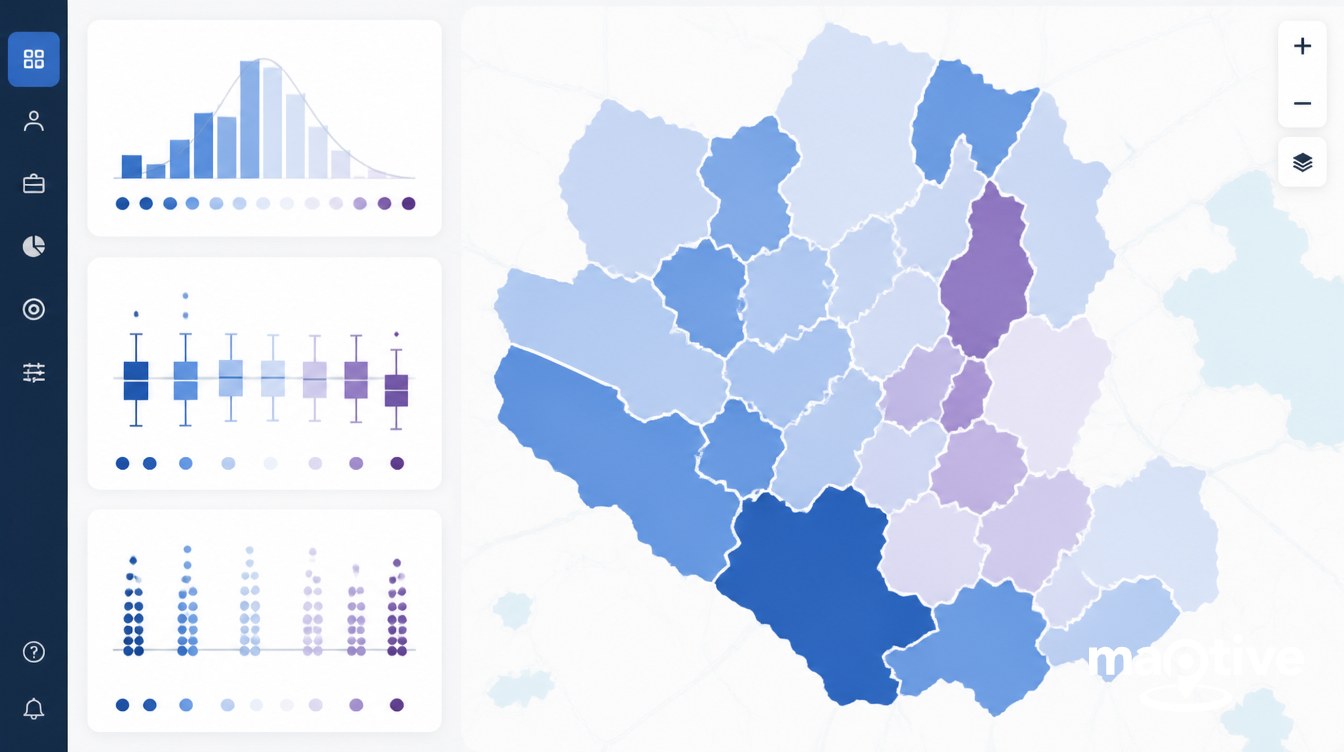
The aggregate win rate of a sales team is a misleading number. The signal worth watching is the spread of win rates inside a homogeneous peer group, meaning reps assigned to comparable territories with the same segment, tenure band, and product. The statistical name is the coefficient of variation. The practical question is how far the best rep is from the worst rep on the same playing field.
A healthy peer group runs at a coefficient of variation of 0.25 or below, with the top rep no more than roughly twice the bottom rep. Wider than that signals one of two problems. Either the territories are not actually comparable, in which case the dispersion is a territory-design failure rendered as a coaching number, or the territories are comparable and the coaching investment has collapsed unevenly across the team. Both diagnoses require action before the quota cycle confirms them.
Median B2B win rates landed at 19% in 2024, down from 23% in 2022, with SMB-focused teams clustering at 30 to 40%, mid-market at 25 to 35%, and enterprise at 15 to 20%. These ranges matter only as scaffolding for peer-group definition. A single 19% number for an entire sales organization is the kind of summary that produces decisions made against the wrong baseline.
Win rate is more sensitive to early-stage qualification quality than to closing skill. Qualification quality shows up in win rate 60 to 90 days before it shows up in attainment. A rep winning 11% while five peers in similar territories win 28% is already losing the next quarter. The current quarter may look acceptable because one large deal closed, which is why aggregate attainment hides the deterioration.
The diagnostic move is to decompose dispersion by stage conversion. Look at lead-to-meeting, meeting-to-proposal, and proposal-to-close win rates separately for each rep. The stage where the dispersion spikes is the stage where the coaching investment goes. A flat distribution where every rep clusters at the median is a different problem, usually a process issue rather than a people issue, and it gets addressed at the playbook level rather than rep by rep.
Penetration and White-Space Ratio
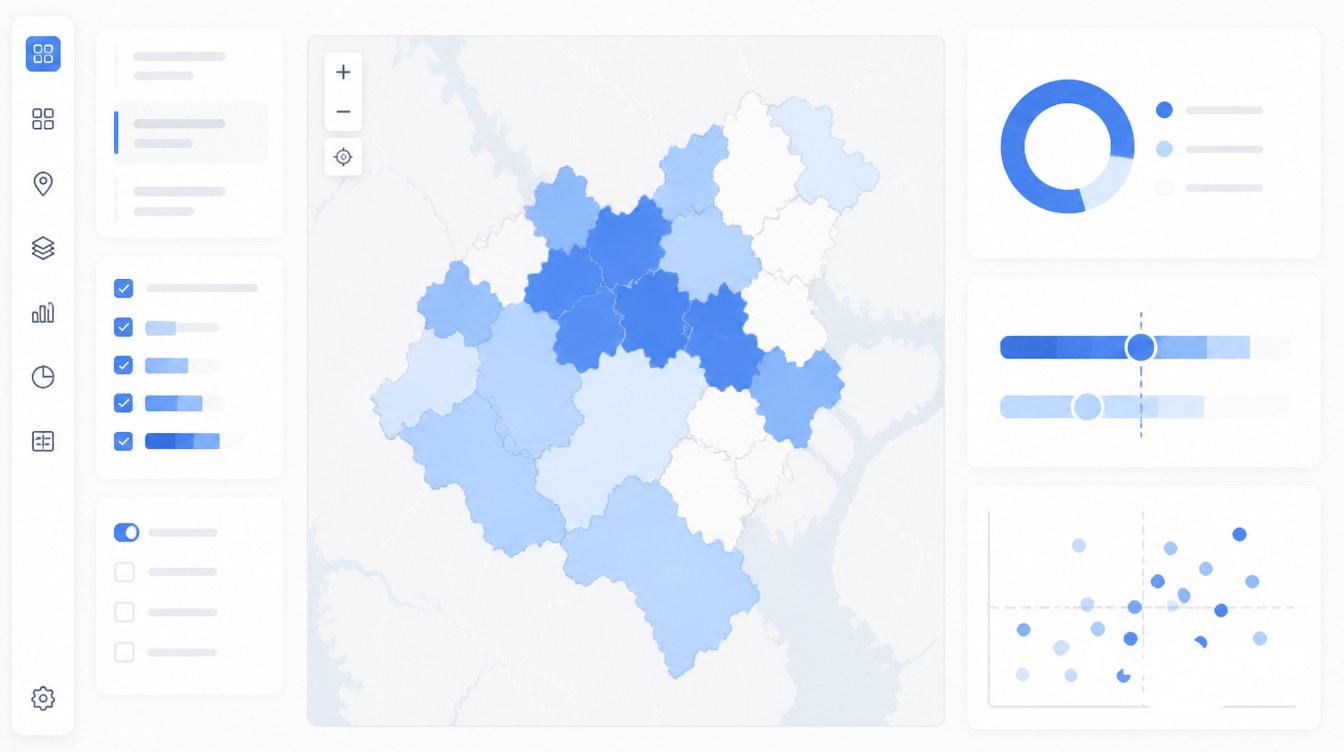
Penetration is the share of a territory’s addressable accounts that are already customers. White-space ratio is the inverse, meaning the share that remains untouched. A territory’s revenue lags its penetration trend by two to three quarters. When penetration plateaus this quarter, expansion ARR stalls in the next one, and the rep starts working harder to hit the same number from a thinner book.
The asymmetry behind the metric is well documented. The probability of selling to an existing customer runs 60 to 70%. The probability of selling to a cold prospect runs 5 to 20%. A territory with high penetration and a thin white-space ratio is running out of cheap revenue, and the rep working that book will spend the next quarter discovering the difference. The metric leads because the discovery happens after the dashboard has already moved.
Healthy ranges depend on the maturity of the territory. A mature B2B SaaS territory at 15 to 25% penetration with a white-space ratio above 5x has room to run. A territory at 40%+ penetration with a white-space ratio under 2x is harvested. Harvested territories need to be split, refreshed, or reassigned. They do not need an increased quota.
Three sick patterns recur. A territory with high penetration that has plateaued for three quarters means the rep has moved to farming the same accounts, and the territory needs structural attention rather than a pep talk. A territory with penetration below 5% against a large addressable market is undercovered, meaning the territory is too big for one rep to work meaningfully. A territory with deep product penetration but shallow logo penetration is whale-dependent, meaning one or two large customers are producing the revenue and the rep is exposed to a single churn event.
The operating cadence for this metric is quarterly. Run a white-space audit per rep, identify the top 20 untouched accounts, and track that cohort as a separate 90-day pipeline view. The cohort produces forward-looking activity data that no other metric on the dashboard captures.
Account-to-Rep Balance Against the System Mean
Equal account counts are not equal workload. A team where every rep has 80 accounts can still be wildly unbalanced if one rep’s 80 are clustered in a dense metro with short drive times and high-tier opportunities while another’s 80 are spread across a rural region with long drives and low-tier accounts. The metric that captures real balance is the coefficient of variation of weighted opportunity per rep, where the weights account for tier, drive time, and historical effort.
The thresholds are tighter than most operations teams set them. Below a coefficient of variation of 0.15, the split is healthy. Between 0.15 and 0.25, an adjustment is due before the next quarter. Above 0.25, the territory plan needs a full redesign. Sitting at 0.30 and waiting for attainment to confirm the imbalance is a choice to absorb two quarters of underperformance from the under-resourced reps and to accept whatever cherry-picking the over-resourced reps choose to do.
Potential-to-quota ratio belongs in the same conversation. A territory whose total addressable opportunity is less than 3x the rep’s annual target is structurally cramped. A territory above 5x is structurally loose. The healthy band is 3 to 5x, and territories outside that band need rebalancing on schedule rather than on the calendar of the next planning cycle.
Imbalance shows up in activity metrics about 30 days before it shows up in pipeline build, and in pipeline build about 30 days before it shows up in attainment. A rep carrying 1.8x the median account load goes silent on the lower-tier accounts within a quarter. Those accounts are next quarter’s pipeline. A new rep handed the median count but disproportionately low-tier accounts will run a thin pipeline for two quarters before the ramp recovers. Geographic territories where drive time is not normalized create the same effect without leaving an obvious trail, since rural reps produce fewer touches per day and look like they are underperforming a system that is actually penalizing them.
Recalculate the coefficient of variation quarterly. When it crosses 0.20, redistribute accounts before the quarter starts, not after the quarter closes. The math on doing so is unambiguous. Optimization alone, with no headcount change, can lift sales by up to 7%, and the performance gap between companies effective at territory planning and those that are not runs close to 30%.
Cycle-Length Variance by Territory
The mistake most teams make on cycle length is reporting the average cycle of closed deals. That is a backward-looking number computed from a sample selected by survival bias. The metric that leads is the average age of open opportunities in each stage, compared to the historical norm for that stage. A territory whose stage-age trend bends upward this week tells you the quarter is in trouble two months before bookings confirm it.
Average B2B cycle expanded to 6.5 months in 2023 from 4.9 months in 2019, with the average deal now involving 6.8 stakeholders, up from 5.4 in 2020. These aggregates set the floor for what a “long cycle” looks like in absolute terms. They cannot tell a sales leader if a specific territory is cycling abnormally. That requires comparing the territory’s median cycle to the system median for the same ACV band and segment.
Deal size explains only about 27% of cycle-length variance. The remainder runs through process complexity and stakeholder count, which is why two territories with similar deal sizes can produce materially different cycles. A territory consistently 30% longer than peers either has a structural reason that should be reflected in its quota model, or has a qualification problem that should be reflected in coaching. Treating the territory as if 9-month cycles were normal because the rep says they are is how leadership accepts a cycle problem as a feature.
Three patterns deserve weekly attention. A territory whose cycle suddenly runs 25% longer than its trailing-year median has either weakened on qualification or seen its buyer environment move against it, often visible as a stakeholder-count increase per opportunity. A territory cycling shorter than peers but losing win rate is closing too early on weak demand, which produces forecast misses two quarters out. A territory with wide intra-quarter variance between deals is running an inconsistent process, which produces unforecastable bookings even when the average looks fine.
The operating discipline that matches the metric is weekly review of stage age, not monthly review of closed cycles. The closed-cycle average is a quarterly artifact. The stage age of open opportunities is a Monday-morning artifact, and it leads the closed-cycle number by months.
Pipeline-Velocity Ratio Against the Team Median
Pipeline velocity equals the number of qualified opportunities, multiplied by average deal value, multiplied by win rate, divided by sales cycle length in days. The output is dollars per day moving through the funnel. The ratio version normalizes a territory’s velocity against the team median, producing a single number between roughly 0.5 and 1.5 that captures four levers at once. Volume, value, conversion, and time. Nothing else on the dashboard combines all four.
A healthy velocity ratio sits between 0.85 and 1.15 of the team median, adjusted for segment. Outside that band the territory is either overproducing for reasons worth examining or underproducing for reasons worth fixing. Stage age in each pipeline stage should run at 1.5x the historical average for that stage or below. Stale deals, meaning anything past 2x historical stage age, should be excluded from coverage, velocity inputs, and the forecast. Including them is how teams produce coverage numbers that look healthy while the underlying funnel is choking.
Three velocity patterns require action. A territory where velocity is falling while coverage holds is leaking somewhere mid-funnel, with deals piling up in a stage rather than failing fast. A territory whose velocity is high but driven by one mega-deal is a one-off, and forecasting against it produces the kind of confidence that destroys quarters. A simultaneous velocity decline across multiple territories is a market issue rather than a rep issue, and the response is at the strategy layer rather than the coaching layer.
The diagnostic move is to track velocity weekly at the stage level rather than at the territory level. When stage age in a single stage crosses 1.5x the norm in a particular territory, that stage gets the coaching focus. Chasing aggregate velocity produces general advice. Chasing the specific stage where velocity is leaking produces the rebound.
A territory-health dashboard built around these five metrics demotes revenue, quota attainment, and pipeline coverage to a monthly review where they belong. The weekly view runs stage age and velocity ratio. The monthly view runs win-rate dispersion and account-to-rep balance. The quarterly view runs penetration and white-space, plus the redesign trigger any time coefficient of variation across the team crosses 0.25. The structure produces five to seven leading indicators on the weekly dashboard, which research connects to roughly 91% average quota attainment, versus 73% for teams running zero to three KPIs. The interesting work is not adding metrics. The interesting work is letting the lagging ones recede.
Frequently Asked Questions

What are the most important KPIs for sales territory management?
The most useful territory KPIs split into three groups. Revenue and quota attainment lag the underlying problem. Market and customer metrics like penetration and retention are mixed. Sales-effectiveness metrics including win rate, cycle length, and pipeline velocity lead. Teams tracking 5 to 7 core KPIs achieve roughly 91% average quota attainment versus 73% for teams tracking 0 to 3 metrics.
What is a white space ratio in sales?
White space ratio is the share of addressable accounts or product opportunities a rep has not yet touched, divided by the total addressable set. It quantifies untapped revenue, including products not yet sold to existing accounts, geographies without coverage, customer segments not yet addressed, and use cases not yet activated.
What is penetration rate in sales?
Penetration rate is the percentage of the total addressable market a company has already acquired as customers. The standard formula is market penetration equals current customers divided by total potential customers, multiplied by 100.
What does win rate dispersion mean?
Win rate dispersion is the spread of individual win rates across reps in a comparable peer group with the same segment, tenure, and product. Statistically it is reported as the coefficient of variation or standard deviation. A coefficient above 0.30 within a homogeneous peer group indicates uneven quotas or inconsistent qualification.
What’s the difference between leading and lagging sales metrics?
Leading metrics look forward and predict outcomes, including pipeline activity, stage age, and qualified opportunities created. Lagging metrics confirm results after the fact, including closed-won revenue and quota attainment. By the time quota drops, the real issue often started 90 days earlier when pipeline coverage fell.
What is a good win rate for B2B sales in 2024?
Median B2B win rates landed at 19% in 2024, down from 23% in 2022. SMB-focused companies see 30 to 40%, mid-market sees 25 to 35%, and enterprise deals above $100K ACV close at 15 to 20%.
What is a good pipeline coverage ratio?
Enterprise sales teams typically maintain 3 to 5x coverage to account for longer cycles and multiple stakeholders. Mid-market B2B teams target 2.5 to 4x. High-velocity SMB sales can operate at 2 to 3x. A more accurate rule than the legacy 3x benchmark is required coverage equals 1 divided by historical win rate.
How is sales pipeline velocity calculated?
Pipeline velocity equals the number of qualified opportunities, multiplied by average deal value, multiplied by win rate, divided by sales cycle length in days. The output is dollars per day of pipeline converting to revenue.
What is the average B2B sales cycle length?
The average B2B sales cycle hit 6.5 months in 2023, up from 4.9 months in 2019. By segment, SMB runs 30 to 45 days, mid-market runs 60 to 90 days, and enterprise runs 3 to 6 months. Deals above $100K ACV regularly run 6 to 9 months or longer.
How balanced should sales territories be?
The core metric is the coefficient of variation of potential across territories. Below 15% is healthy. Between 15% and 25%, an adjustment is due. Above 25%, a full redesign is needed. A territory’s total addressable opportunity should sit at 3 to 5x the rep’s annual target.
What is stage age in a sales pipeline?
Stage age measures how long an opportunity has been in its current stage without advancing, calculated as the current date minus the date of the last stage change. If a deal has been in its current stage for more than twice the historical average for that stage, it is stale and should be removed from coverage and forecast calculations.
How often should a sales team review pipeline metrics?
A four-tier cadence is standard. Weekly Operating Review covers stage age and pipeline inspection. Monthly Business Review covers trend analysis and conversion rates. Quarterly Review resets strategy and targets. Annual Planning locks budgets. Weekly views prioritize speed over precision, so a directional Monday report beats a fully reconciled Friday one.