

A data-driven location decision works when the customer profile is defined first, the operating constraints second, the candidate sites third. Most owners run the sequence backwards. They tour a property, fall for it, then list whatever demographics the surrounding ZIPs happen to contain and call that the criteria.
The mismatch is locked in by the lease. A 5-year commitment closes around a 2-month gut call, and the build-out, staffing and marketing spend all run before sales data is honest enough to argue with.
BLS Business Employment Dynamics tracked 22.1% of new private-sector businesses closing within their first year in the March 2024 to March 2025 cohort, and 48.6% gone by year five. Poor location sits in the SBA’s top 10 causes of failure, and it compounds every other problem because the lease outlasts the company.
Why the Order of the Decision Matters
Starting with a site and reverse-fitting the customer profile is the most expensive error in site selection and also the most common one. Deloitte’s “12 Mistakes to Avoid in the Site Selection Process” ranks it first. The shape is the same for a chain real estate director and for a single-location entrepreneur. The property excites, the criteria get assembled to fit.
The Fall-for-the-Property Pattern
The pattern is recognizable. An owner sees a vacancy on a street they already drive, photographs the storefront, runs a 3-mile ring of basic census numbers, and finds nothing that disqualifies the site. The absence of a disqualification is not the same as a fit. The 3-mile ring contains demographics that exist on every adjacent block, and the ring itself ignores highways, rivers and traffic patterns. The owner is not measuring the site against a target. The owner is measuring it against zero.
The reverse-fit stays invisible until the lease is signed. Almost any neighborhood can produce a flattering demographic snapshot if the analyst chooses the radius, the ZIP set, and the dimensions that flatter the answer. Choosing those things after the property has been picked is not analysis. It is rationalization with a spreadsheet.
How the Mistake Compounds in the Lease
The cost lands months after the decision. Base rent is 50 to 70% of true occupancy cost once CAM, property taxes, insurance, utilities and maintenance load on. Build-out runs before any sales arrive, and staffing and opening marketing run at full burn during the ramp. The owner needs the site to be right for the entire 3 to 5-year initial lease term, the SMB norm, because the only realistic exits are buyout, sublet, or default. None of them is fast.
When the site is wrong, the lease has more endurance than the business. A site fails not because the data was unavailable but because the decision was made before the data was looked at.
Customer Profile, Defined and Validated First
The customer profile is the brief the site must answer. Defining it before any property tour changes the question from “is this site good?” to “does this site match the customer I am building for?” The second question has an answer. The first does not.
Five demographic dimensions move the math for most verticals. Population and density, age distribution, household income, household composition, and occupation mix. Each weights differently by sector. Quick-service restaurants weight young-family density. Geriatric medical practices weight retiree concentration in ZIPs with strong Medicare Advantage enrollment. Health clubs weight $50,000 to $100,000 household income, the band where member penetration approaches 30%.
For an existing business, the most accurate input is already on the books. Plot the home ZIPs of current customers, identify the cluster that produces the closest 60 to 70% of origins, and take that cluster’s demographic signature as the template for screening new neighborhoods. This customer-derived trade area outperforms ring-based assumptions because it is built from observed behavior rather than assumed reach.
The free data stack covers most of what a single-location owner needs at this step. The Census American Community Survey 5-Year Estimates, the 2020 to 2024 release, run at the census-tract level for all tables and the block-group level for selected detailed tables, the most granular free demographic source in the country. LEHD LODES through the OnTheMap interface produces per-block daytime population from origin-destination commuting data. The USPS Delivery Statistics Product publishes residential and business delivery counts per ZIP, the cleanest free proxy for active household and business density. USPS Population Mobility Trends flags growth corridors before ACS catches up by aggregating National Change of Address data.
The profile that comes out of this work fits in five columns of a spreadsheet. A 5-column profile beats a property that the owner “likes” in every measurable way, because the profile is testable and the preference is not.
Operating Constraints as Pass-or-Fail Filters
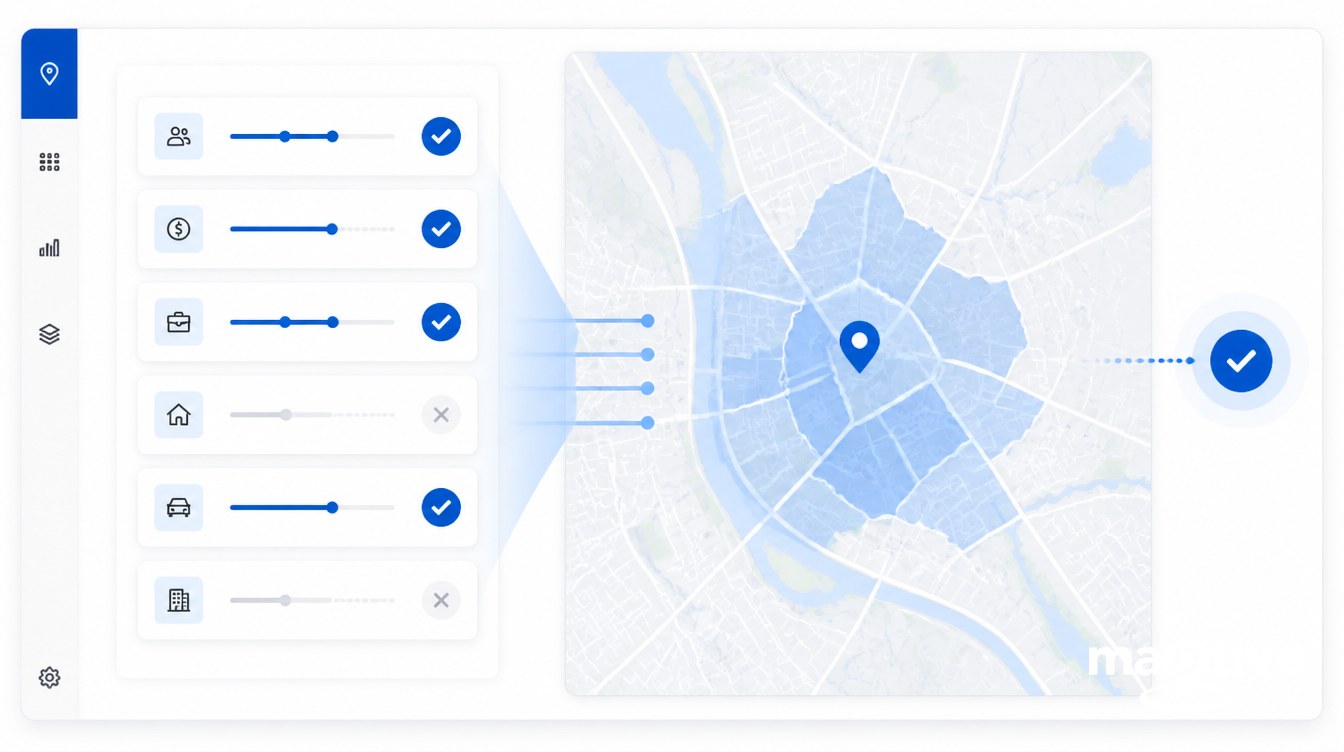
Constraints are not preferences. They are filters that disqualify candidate sites before any creative judgment is applied. An owner who treats constraints as preferences argues themselves into a marginal property because the rest of the shortlist also has problems. Pass-or-fail filters cut the shortlist down to sites where the remaining decision is which one wins, not which one is least disqualifying.
Drive-Time, Square Footage, Daytime Population
Drive-time tolerance is vertical-specific and non-negotiable. Urban health clubs draw 80% of members from inside a 1-mile radius, while the same vertical in the suburbs tolerates a 10-minute drive. Primary care plans to a 30-minute or 30-mile radius. Sit-down restaurants pull within 5 to 10 minutes. A site that puts the target customer outside the tolerance is a different business, not a marginal site.
Daytime population is the constraint that catches lunch service and convenience retail. LEHD LODES provides a free per-census-block count of inbound workers. A neighborhood with 50,000 residents who all commute away for work measures as a much smaller daytime market than a workplace cluster of the same residential count. Remote work between 2020 and 2024 made this constraint sharper. Pre-pandemic daytime population maps are stale, and the Census Bureau’s own analysis using LODES confirms a spatial redistribution away from traditional job centers.
Square footage gets defined by the operating model, not by what the property offers. A 1,200 square foot space is not “close enough” to an 1,800 square foot requirement. The operating model missing 600 feet is a different operating model.
Zoning, Permitted Use, and ADA
Zoning is pass or fail before anything else is worth checking. A use that does not match the permitted district means a different site, an application for a zoning change, a special-use permit, or a variance. The last three add months and can be denied. Building code and ADA compliance follow the same logic. Verify by-right permission in writing from the municipal planning department before the lease, not after.
Chicago and New York both amended ordinances in 2024 and 2025 to expand the business activity permitted in residential and mixed-use buildings, which means older zoning guides are outdated. Read the current ordinance, not a summary.
Occupancy Budget and Lease Length
The base rent on the listing is not the occupancy cost. CAM, property taxes, utilities, insurance and maintenance add 30 to 50% on top, which puts base rent at 50 to 70% of the true cost the business has to cover. Budgeting against base rent alone produces a financial model that is structurally underwater the day the lease is signed.
Lease length trades flexibility for tenant-improvement leverage. A 3 to 5-year initial term is the small-business norm. A 5 to 10-year term unlocks materially larger TI allowances, typically 25 to 150% of first-year rent, with Class A office TI in San Francisco averaging $135 per square foot in 2024. The longer term locks the loss in if the site fails. The common compromise is a 5-year term with a 3 to 5-year renewal option, which preserves optionality without surrendering the TI lever.
Co-tenancy clauses matter in anchored centers. Anchors drive 60 to 80% of total visits and sales in malls and lifestyle centers, so an anchor closure without contractual protection leaves a small tenant with no rent remedy and no exit. Negotiating co-tenancy is not a favor from the landlord. It is pricing risk that already exists.
From Shortlist to Signed Lease
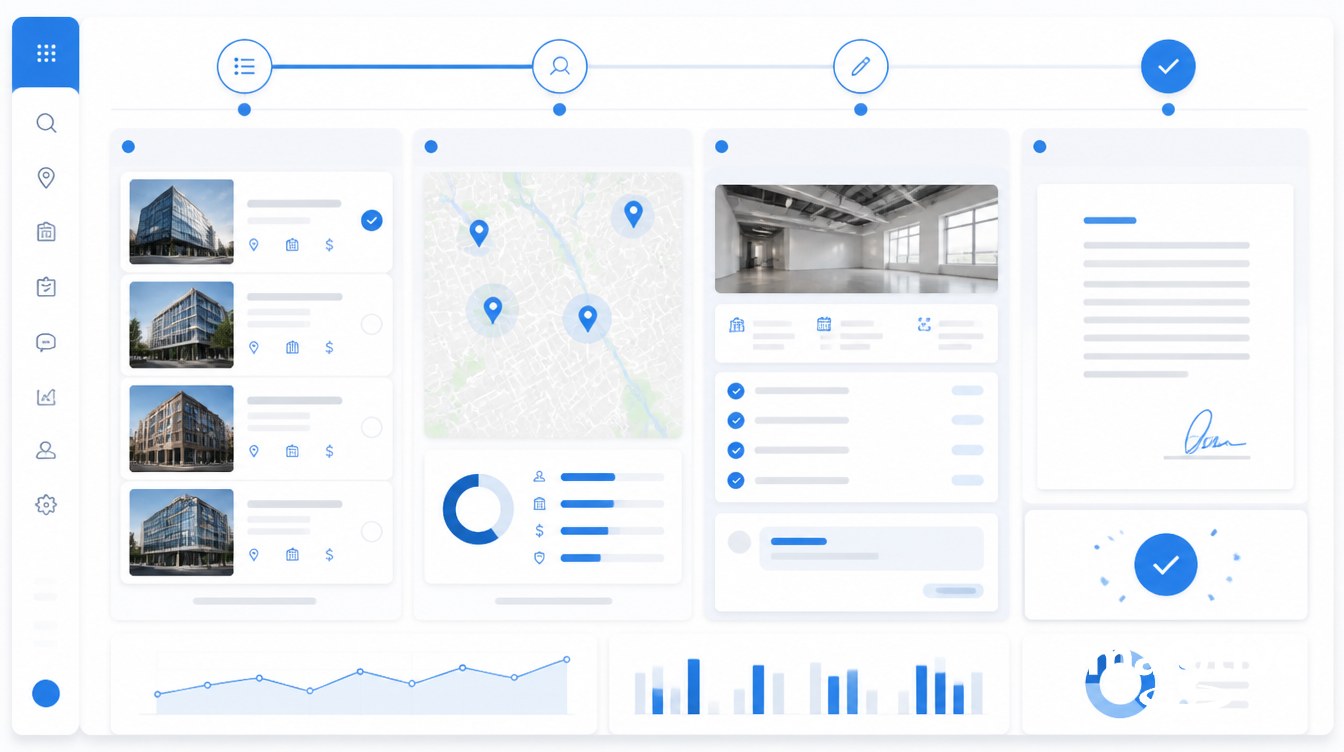
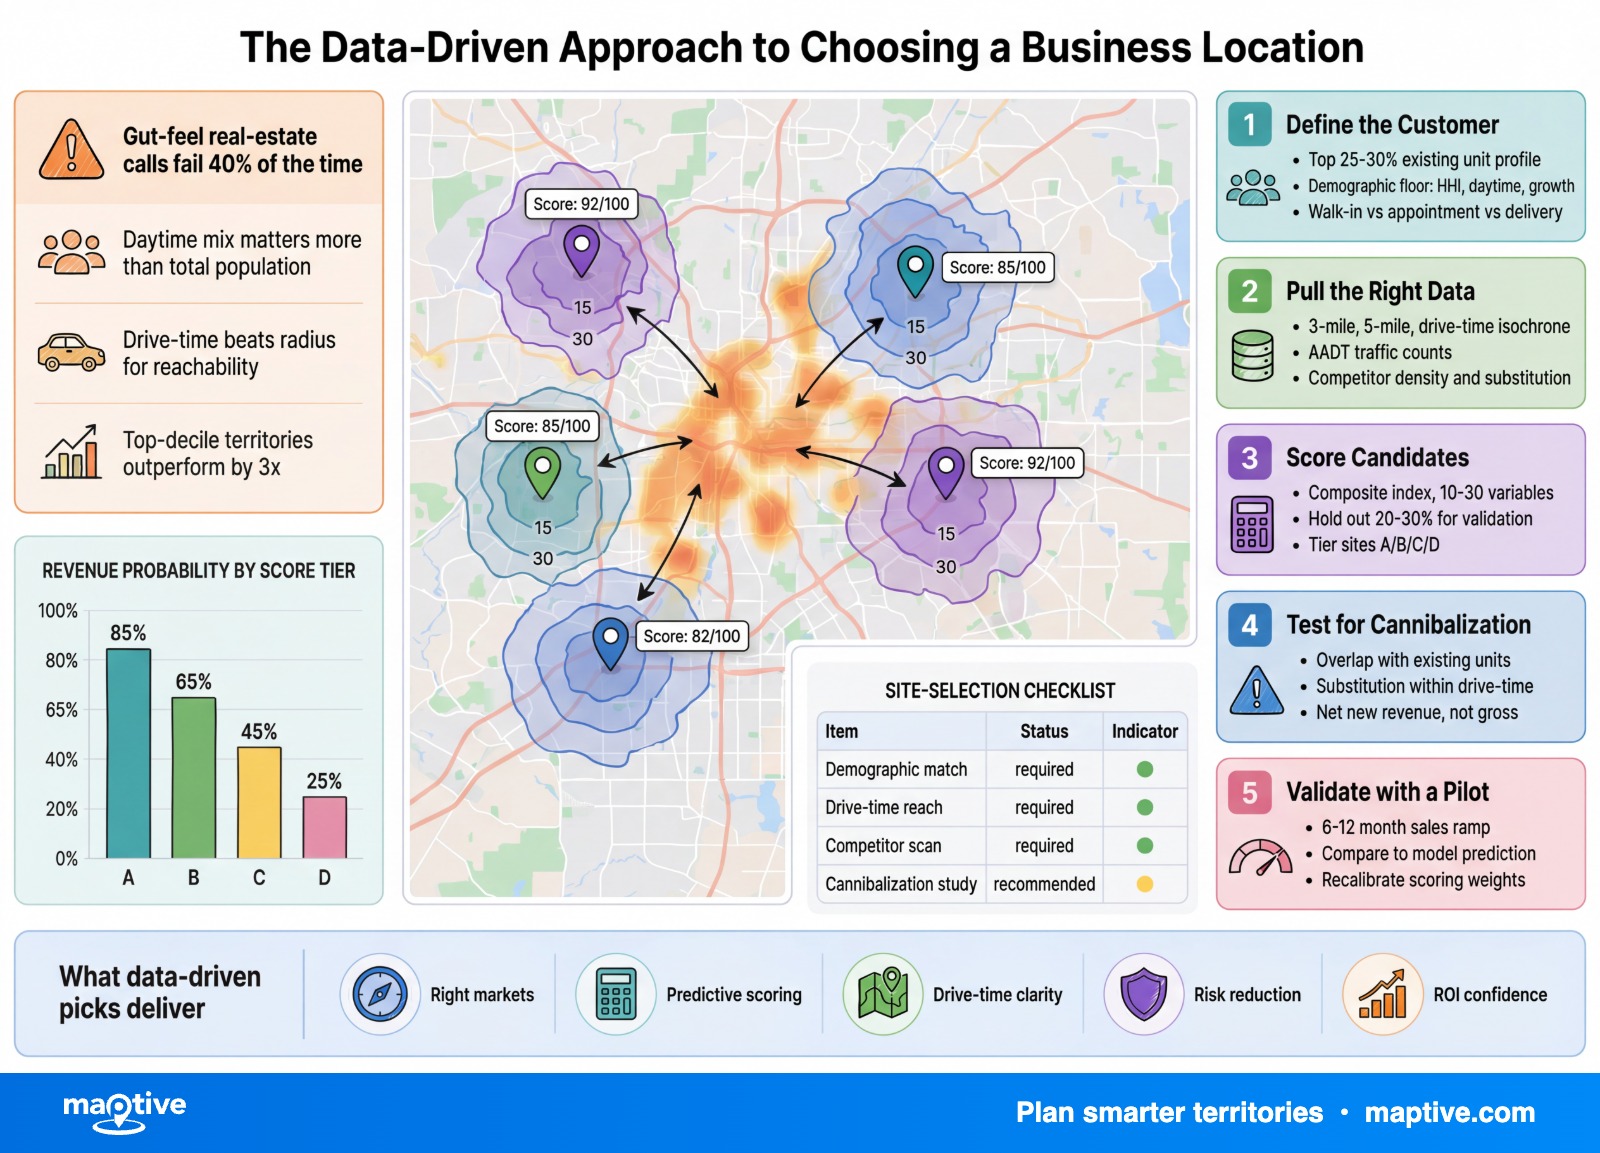
The candidate-site stage is the last step, and it has its own internal sequence. Radius rings for the first cut. Drive-time isochrones for the shortlist. Ground truth for the finalists. Lease economics for the signature.
Radius rings are fast and good enough to disqualify. A 1-mile, 3-mile and 5-mile ring across many candidate properties produces a first-pass population, income and density read in minutes. The ring’s weakness, that it ignores the road network, is acceptable at this stage because the goal is elimination, not selection.
Drive-time isochrones replace rings for the shortlist. An isochrone maps every point reachable within a given drive time along the actual road network, accounting for highways, rivers, traffic patterns and barriers. A competitor 4 miles away but 6 minutes by highway is more relevant than one 2 miles away separated by a 15-minute detour. Two sites with identical 3-mile radii routinely have very different 10-minute drive-time areas, and the drive-time picture is the one customers actually drive.
State DOT viewers publish Annual Average Daily Traffic counts free. Maryland alone publishes data from more than 8,700 count stations, and most states maintain interactive maps at comparable detail. AADT tells the analyst if the visibility a property is selling translates into measurable traffic.
Foot-traffic data adds another layer for businesses that can budget for it. Placer.ai, SafeGraph and Foursquare aggregate anonymized mobile-device location signals to estimate visit counts, dwell time, visitor home ZIPs and cross-shopping behavior, with Placer.ai reporting above 90% correlation against first-party measurement. Aggregate U.S. foot traffic rose 0.4% in 2024, with discount and dollar stores leading at 2.8%, which makes the category-level read worth pulling even when budgets do not stretch to full subscriptions.
Ground-truth visits happen at the time of day and day of week the business will actually operate. A lunch restaurant visited at 3 p.m. produces a misleading read. The visit replaces the spreadsheet for thirty minutes and answers questions the data cannot reach. Ingress and egress flow, sightlines from the dominant approach, the parking situation when it is at peak demand, the type of foot traffic actually present.
A good-enough stopping rule applies at this stage. Once two or more shortlisted sites pass the customer profile and the operating-constraint filters, the deciding inputs are lease terms and ground-truth observations, not more data. Maptive and other mapping tools handle the first three filters at a budget many single-location owners can absorb. SMB site-selection budgets typically run from a few thousand dollars in DIY work on free Census, USPS, and state DOT data up to tens of thousands for outsourced GIS, which is small against the financial risk of opening a poorly performing location.
Vertical-Specific Weighting
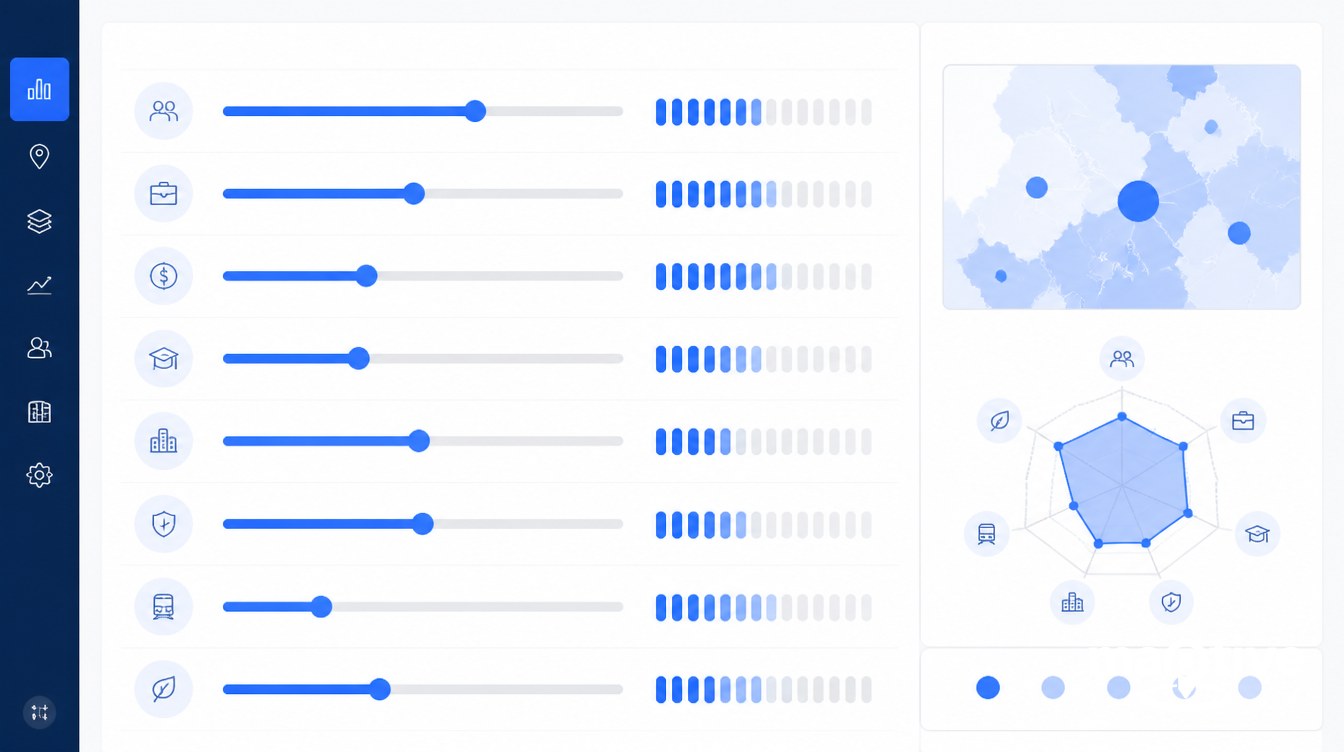
The framework is sequence-independent, but the weights inside each step are vertical-specific. A restaurant and a primary care clinic running the same three-step process will land on different sites because different constraints carry different weights.
Restaurants
Daytime population dominates for lunch service. Residential density within a 5 to 10-minute drive carries dinner. Parking, signage, and the hood, venting and grease-trap infrastructure are operating constraints the wrong site cannot retrofit cheaply. Liquor-license availability in the zoning district is a pre-lease check. The first-year close rate runs around 17%, lower than the 19% average for service businesses, with the NRA recording more than 72,000 closures in 2024.
Retail
Anchor draw and co-tenancy carry the model. Foot traffic and AADT are secondary filters that confirm or contradict the anchor read. U.S. retail vacancy held at 4.1 to 5.3% through 2024, below 5% for 11 straight quarters, with only 11.3 million square feet of construction under development nationally. That tightness is what owners now pick sites inside of. Optionality is thin and landlord flexibility on rent is thinner. The countervailing pressure is that dense suburban retail districts have matched and in many cases exceeded rent growth in traditional high-street districts in the past five years, driven by hybrid-work schedules and Sun Belt migration.
Healthcare and Professional Services
Primary care plans to a 30-mile or 30-minute drive radius. Insurance mix, aging population by ZIP and Medicare enrollment are the first-order demographics that shape every other decision. Specialty clinics narrow the catchment and raise the income and condition-prevalence weighting.
Salons, accountants, financial advisors and other professional services with an existing client roster should weight the customer-derived trade area heavier than census demographics. Demographic profiles identify lookalike neighborhoods. The existing client roster identifies the actual draw distance and price tolerance of the practice, which is the more predictive single input the business owns.
Fitness and Child Care
Fitness clubs target trade areas with 60,000 to 100,000 people, an income sweet spot of $50,000 to $100,000, and a drive-time tolerance of 1 mile urban or 10 minutes suburban. Member penetration approaches 30% in the high-income band of that sweet spot, which is the figure that makes or breaks the membership economics in pre-opening pro formas.
Child care is the zoning-first vertical. Without permission for the use under the district code, and without an ADA-compliant build, every other input is irrelevant. Market sizing is done in age-cohort grids of children 0 to 3, 3 to 5 and 5 to 8 by working-family household, against the licensed capacity in the catchment. The framework still runs in the same order. The first filter is sharper.
Across verticals the sequence does not change. The weights do. An owner who runs the three-step framework with vertical weights disqualifies wrong sites quickly and spends the analysis budget on properties that survive the filters. An owner who starts with the property runs a different process, rationalization, and pays for it in the only currency the lease accepts.
Frequently Asked Questions

How do you choose a business location?
Work in three stages rather than starting with the property. Define the customer using demographic dimensions like age, household income, family structure, occupation, and lifestyle behavior, and validate against your existing customer ZIPs if you have an operating history. Write down hard operating constraints next, including maximum drive-time, infrastructure needs, zoning fit, hours pattern, and occupancy budget. Shortlist properties that match both, then ground-truth each site at the time of day your business will actually operate.
What are the most important factors when choosing a business location?
Target-customer match, accessibility, traffic counts, competition, occupancy cost, zoning fit, and growth headroom. Zoning, building code and ADA compliance are pass-or-fail filters that come before any other criterion is worth checking, since a site that does not permit your use cannot become one without an approved variance.
What demographic data should I look at when picking a location?
Population and density, age distribution, household income, household composition, and occupation mix. The Census American Community Survey 5-Year Estimates, most recent 2020 to 2024 release, provide all of this at the census-tract level for free, with selected detailed tables available at the block-group level.
What is trade area analysis and why does a small business need it?
Trade area analysis defines the geographic zone a location actually draws customers from, then studies the demographics, competitors and traffic inside that zone. Single-location owners need it more than chains, since a chain can absorb a weak site and a single-location owner cannot. The cheapest version uses 1, 3 and 5-mile rings on Census data; the most accurate version plots actual customer addresses to derive the real draw boundary.
What is the difference between a drive-time isochrone and a radius ring?
A radius ring draws a straight-line circle. A drive-time isochrone maps every point reachable within a given drive time along the actual road network, accounting for highways, rivers, traffic and barriers. Two sites with identical 3-mile radii can have very different 10-minute drive-time areas, and the drive-time picture is the one customers actually drive. Use rings for the first cut across many sites and drive-time for the shortlist.
How important is daytime population for choosing a location?
Decisive for lunch restaurants, convenience retail, and any business that depends on weekday workers. The Census LEHD LODES dataset provides free per-census-block counts of workers commuting into each location, which is how a neighborhood with 50,000 residents but no inbound commuters gets correctly read as a small daytime market. Post-pandemic remote work shifted daytime population away from traditional job centers, so pre-2020 maps are stale.
How do I find traffic counts for a road I am considering?
Most state Departments of Transportation publish Annual Average Daily Traffic data on interactive maps. AADT is the total annual vehicle volume on a road segment divided by 365, collected by pneumatic-tube counters or permanent recorders. Maryland alone publishes data from more than 8,700 count stations. Search the state DOT traffic counts to find the public viewer.
What is co-tenancy and why should I care?
Co-tenancy clauses tie your lease terms to the occupancy status of anchor tenants and overall center occupancy. Anchors drive 60 to 80% of visits in malls and lifestyle centers, so losing one can collapse foot traffic to in-line tenants. A co-tenancy clause lets the tenant cut rent or exit if anchor occupancy falls below a stated threshold, which is the contractual remedy a small business cannot get any other way.
How long should my first commercial lease be?
Most small-business commercial leases run 3 to 5 years. Longer terms (5 to 10 years) unlock significantly larger tenant-improvement allowances, often 25 to 150% of first-year rent, but lock in occupancy cost during the period the operator is still learning if the site works. A 5-year term with a 3 to 5-year renewal option is a common compromise that keeps optionality without surrendering TI leverage.
What free data sources can a small business use for location analysis?
Census American Community Survey for demographics at the census-tract level, LEHD LODES via OnTheMap for daytime population and commuting data, state DOT viewers for AADT traffic counts, the USPS Delivery Statistics Product for household and business delivery counts per ZIP, USPS Population Mobility Trends for migration patterns, and FRED for regional economic indicators. Together these cover the customer-profile and operating-constraint steps without any paid subscription.