


Evaluating a franchise location is the candidate’s job, not the franchisor’s, and treating the franchisor’s site model as ground truth is the most expensive mistake a prospective franchisee can make. The franchisor’s analysis was built to grow the system. The candidate’s analysis has to be built to defend a 10-to-20-year P&L on one specific corner.
The disclosure asymmetry sets the terms. Roughly 66% to 86% of franchisors include any Item 19 Financial Performance Representation in the FDD at all, depending on which survey you read, and even the ones that do typically report gross sales averaged across a system that includes outliers and selection bias. The candidate gets 14 calendar days with the document before signing. The franchisor has the rest of the file the candidate cannot see, namely the closed units, the failed transfers, and the comparable locations that were not flagged as comparable.
The work below is the framework the candidate runs independently before the lease, the franchise agreement, and the personal guarantee are signed. After signature, the analysis becomes academic.
What the Franchisor’s Site Analysis Actually Tells You
The franchisor’s site approval is a green light for the system, not a forecast for the candidate. The analysis was built to answer one question, namely if the location meets the brand’s minimum standards. The candidate is asking a different question, namely if the unit produces positive owner cash flow at the 25th percentile of system performance after rent, build-out cost, royalty load, and the competitive set are accounted for.
Item 19 is the only place in the FDD where unit-level financial performance can appear, and it is voluntary. The 2024 Annual Franchise Development Report put disclosure at 86% of surveyed franchisors covering 2,533 company-owned and 24,101 franchised units. A FRANdata sample puts the figure closer to 66%. Both numbers leave a meaningful share of franchisors disclosing nothing. If a franchisor refuses to put numbers in Item 19, that absence is itself a number. It is a zero.
Inside the disclosures that do exist, the analytical traps are predictable. Some franchisors report top-quartile averages only (“Our top 25% of units averaged $1.4M”). That is the ceiling, not the median. The 2007 amended FTC rule requires that whenever a franchisor uses an average, they also disclose the median, the count of outlets that met or exceeded the average, and the high and low values. Candidates routinely miss the companion lines. The single most useful Item 19 table is the quartile breakdown: 25th percentile, median, and 75th percentile. The gap between the first and third quartile is the candidate’s actual risk range.
Item 19 also reports gross. Royalty, ad fund, rent, labor, COGS, and debt service are the candidate’s problem to model. A unit doing $900,000 in gross sales with a 6% royalty, 2% ad fund, 8% occupancy cost, 30% labor, and 30% COGS produces well under $100,000 of owner cash flow before debt service. The franchisor will not run that math for you, and the disclosed gross figure is not the answer.
Item 20 is the section no one reads. It contains three years of outlet tables covering openings, closures, transfers, terminations, and non-renewals, plus contact details for current franchisees and any who left in the past 12 months. A transfer rate between 2% and 8% of average outlets is healthy. Below 2% suggests no resale market. Above 8% suggests churn the franchisor is not advertising. The “ceased operations” line is a better failure proxy than the formal termination count because franchisors prefer mutual cancellations to avoid litigation.
The Independent Data the Franchisor Cannot Pull for You

The candidate has the same public and commercial data the franchisor’s real-estate team uses. Running it independently is the only way to verify the franchisor’s projection against the specific site, because the franchisor’s model is built on system averages and the candidate is signing for one address.
Residential and Daytime Population Layers
Census Bureau ACS 5-year estimates give household income, age distribution, and household composition down to block-group level. For a residential concept like childcare or salons, the block-group view is the trade-area cross-section that matters. For lunch-driven QSR or B2B service concepts, the residential picture understates the opportunity. BLS Local Area Unemployment Statistics and the LEHD Longitudinal Employer-Household Dynamics product show daytime workplace population. Layering daytime workers over a 5-minute drive-time polygon for a lunch QSR sometimes doubles the addressable trade-area population the residential view alone would show. USPS Population Mobility Trends pull aggregated National Change of Address data to show in-migration and out-migration by ZIP, paired with 2020 Census demographics. The migration view is the trade-area’s trajectory, not its snapshot.
Traffic Counts, Drive-Time Polygons, and Competitive Density
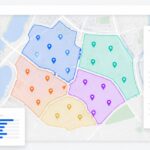
Drive-time isochrones beat radius rings on every site that is not a perfect circle on flat ground, which is every site. A 3-mile radius covers 5 minutes on a highway and 20 minutes in a congested grid. The candidate should compute 5-, 10-, and 15-minute drive-time polygons against the actual road network and use those as the trade-area boundary. Mapping platforms like Maptive support this workflow without specialist GIS skills, which closes the technical gap between the candidate and the franchisor’s real-estate team.
Inside the isochrone, three layers matter:
AADT traffic counts. State DOTs publish free Annual Average Daily Traffic counts updated every 1 to 3 years under FHWA Traffic Monitoring Guide standards. Pull the count at the candidate site and the count at the franchisor’s stated comparable units. If the comps run at 22,000 vehicles per day and the candidate site runs at 9,000, the franchisor’s revenue projection is not transferable.
Competitor density. Map direct competitors and substitute concepts inside the drive-time polygon. A QSR sandwich concept competes with every other lunch option in the 5-to-7-minute drive-time band, not only with the brand’s named competitors.
Cannibalization check. Overlay the trade areas of existing franchisees in the same brand. Where they intersect, the candidate site will pull from sister units, and that overlap is the source of disputes after opening.
Commercial mobility data sets, including cell-derived visit counts and dwell times, fill in actual visit behavior the public data does not capture. The candidate does not need to subscribe to a foot-traffic platform to make the decision, but if the deal size justifies the spend, the data resolves disputes about which comparable units are actually comparable.
Vertical-Specific Rules That Override the Site Model

Trade-area rules vary by vertical, and the franchisor’s site model often applies one template across formats with different physics. The candidate has to know the vertical’s own constraints.
QSR trade areas compress to a 5-to-7-minute drive-time band. People do not drive 12 minutes for a burger. Daypart traffic matters more than total daily traffic. The lunch window from 11 AM to 1 PM drives 35% to 40% of daily revenue for many QSR formats, so the count that matters is the lunch-window count, not the 24-hour AADT. Drive-thru sites add their own variables, including ingress quality, stacking capacity, and approach distance.
Fitness franchises sit at the opposite end. Workout Anytime publishes a target of 20,000 people inside a 15-minute drive time, and underserved markets need 30,000 inside a 30-minute drive. Snap Fitness uses a 3-mile radius with a 15,000 to 30,000 population target. Most members will not drive more than 1.5 to 2 miles to a fitness facility, which means the residential layer matters more than daytime workers.
C-stores live in the “Goldilocks Zone” of 5,000 to 15,000 vehicles per day at operating speeds of 30 to 45 MPH. Below 2,000 vehicles is too thin. Above 15,000 is too fast and too dangerous to slow down for a stop. PM-side-of-street, on the commuter direction home, outperforms the AM side. Population density of 2,000 to 3,000 within one mile is the residential floor.
Salons and personal-services concepts are governed by household income and parking ratio. Walk-in business is a function of road visibility and the parking field. Population matters less than median income inside a 3-mile band.
Childcare and early-education concepts draw from a tighter 3-to-5-mile residential band concentrated around dual-income households with preschool-aged children. The pertinent layer is the count of children under 5 inside that ring, cross-referenced against household income above the local median.
A franchisor that uses a single trade-area template across these verticals is approving sites with one assumption set. The candidate’s verification has to be built on the vertical’s own physics.
Lease Math and Unit Economics at the Bottom Quartile

The candidate has to model the unit at the bottom-quartile sales number, not the average, because the average is the system’s middle and the lease is the candidate’s individual obligation. The lease and the franchise agreement together set the floor of the future P&L, and both are most negotiable before signature.
Build-out economics, drawn from 2024 to 2025 benchmarks:
QSR build-out averages around $535 PSF, with a range of $250 to $600 PSF. Kitchen, mechanical, and drive-thru civil work push the high end.
General retail in-line averages around $155 PSF nationally, up roughly 4% year-over-year.
Restaurant new construction runs $250 to $500 PSF; renovation runs $150 to $300 PSF.
Tier-1 metros (NYC, LA) run 40% to 60% higher than Tier-2 metros (Phoenix, Dallas) for comparable scope.
Fitness franchise launches typically total $100,000 to $250,000 depending on size and concept.
Tenant improvement allowances offset some of the build-out. Typical retail TI runs $20 to $60 PSF, with weaker tenants and shorter terms seeing $10 to $45 PSF. In softer markets landlords offer free rent in lieu of, or alongside, TI. The candidate should negotiate TI, rent abatement, and term length as one package, not three.
Percentage rent is where the candidate gives up upside if the lease is poorly written. The structure is base rent plus a percentage of gross sales above a breakpoint. Natural breakpoint equals annual base rent divided by the agreed percentage. Typical retail percentages run 2% to 12%, with 6% common. The tenant wants low base rent, a high breakpoint, and a low percentage rate, in that order. The lease has to define “gross sales” with carve-outs for taxes, employee meals, returns, gift-card sales, and third-party delivery commissions. Without those carve-outs, the operator pays percentage rent on revenue they never collected.
Royalty math compounds the pressure. QSR royalties run 4% to 6% of gross. Retail runs 5% to 7%. Services run 6% to 8%. Ad fund or brand fund adds another 1% to 4%. Combined royalty plus marketing in food service commonly totals 8% to 10% of gross. Royalty is calculated on gross, so the operator pays in low-margin periods at the same rate as in high-margin periods. The candidate has to model royalty drag at the bottom-quartile sales number, after rent, labor, and COGS, and verify there is still positive owner cash flow before debt service. If there is not, the deal does not work.
Validation Calls and Walk-Away Signals

The Item 20 contact list is the only place the candidate hears from operators the franchisor did not screen. Industry consultants call franchisor-recommended franchisees “songbirds.” Pulling the full list and calling a cross-section is the candidate’s job, and 40 to 60 hours of personal due-diligence time is the working budget before signing.
Building the Call List from Item 20
Pull Item 20 from the two most recent FDDs. Build a list that includes newest and oldest operators, urban and rural, high-volume and low-volume, and any franchisees who transferred out or ceased operations in the past year. Make 10 to 15 calls. The most useful conversations are with the operators who left, because they have nothing to sell.
Core questions:
Knowing what you know now, would you buy this franchise again
What did your first-year revenue and net look like, and what about year three
How many hours a week does the operation actually take
Did initial training and the operations manual prepare you
How responsive is the franchisor when you have a real problem
What does the national ad fund translate to in unit-level leads
What surprised you in your first 18 months
What would you negotiate differently in the franchise agreement if you started over
Walk-Away Signals
Specific patterns are terminal. Item 19 absent or limited to top-quartile data only. Item 20 with an accelerating “ceased operations” line over three years. Same-store sales declining system-wide. Heavy churn at the franchisor’s development or operations leadership level. A franchisor that keeps tinkering with the concept, which suggests the model is not proven. Item 3 showing rising franchisee-versus-franchisor litigation on royalty or encroachment disputes. Middle-third franchisees, not the top quartile and not the bottom, failing to hit the income the candidate needs to support the personal guarantee.
The candidate’s leverage ends at signature. Retail vacancy at 4.1% in Q3 2024 means high-credit franchise tenants have leverage with landlords on TI and term in marginal centers, but it also means well-located space prices in the franchisor’s brand premium and pushes base rent higher. Multi-unit operators should model Area Development Agreement schedules conservatively, because ADA deadlines force opens on sites that may not be ready. Cannibalization between sister units in the same trade area can pull 10% to 20% from existing locations, and that loss is the multi-unit operator’s, not the franchisor’s. The franchise agreement is the most leverage the candidate will ever have. After signing, they are a tenant in their own business.
Frequently Asked Questions

What should I check before signing a franchise agreement?
The candidate should work through seven core areas. Full financial obligations including initial fee, royalty, ad fund, working capital, and build-out. The full FDD with particular attention to Items 3, 7, 19, 20, and 21. An independent franchise-attorney legal review. Local market and trade-area research. The franchisor’s training and support assessment. Validation calls with a cross-section of current and former franchisees. An honest self-evaluation of the operating role. Industry guidance puts the personal due-diligence time budget at 40 to 60 hours before signature.
How do I evaluate a franchise location?
Do not accept the franchisor’s site model as ground truth. Define the trade area using 5-, 10-, and 15-minute drive-time isochrones instead of radius rings. Layer in Census ACS demographics, BLS LEHD daytime workplace population, FHWA or state DOT AADT traffic counts, and USPS migration data. Run competitor and co-tenancy density inside the isochrone, then stress-test the franchisor’s revenue projection against the bottom-quartile unit in Item 19.
What is Item 19 in a franchise disclosure document?
Item 19 is the Financial Performance Representation section of the FDD. It is the only place the franchisor may disclose actual or projected unit-level financial performance, including gross sales, gross profit, and sometimes net income. Disclosure is voluntary. The 2024 Annual Franchise Development Report found 86% of surveyed franchisors disclose FPRs, up from roughly 20% in 1995. A FRANdata sample puts the figure closer to 66%.
Do all franchises have to disclose financial performance?
No. Item 19 is optional. A franchisor is permitted to provide no financial performance representation as long as they state plainly that they make none. If a franchisor’s salesperson provides verbal earnings information that is not in Item 19, that is an FTC Franchise Rule violation. An absent Item 19 is a meaningful signal in itself.
Why are averages misleading in Item 19?
Averages are pulled by outliers. Nine units doing $300,000 and one unit doing $2M produce an average of $470,000 against a median of $300,000. The 2007 amended FTC rule requires that whenever an average appears in Item 19, the franchisor also discloses the median, the count of outlets that met or exceeded the average, and the high and low values. Candidates frequently miss the companion disclosures.
What is Item 20 of an FDD?
Item 20 contains three years of outlet tables showing openings, closures, transfers, terminations, and non-renewals, plus contact information for current franchisees and any who left in the past 12 months. A healthy transfer rate runs 2% to 8% of average outlets. The “ceased operations” line is a better failure proxy than formal termination counts because franchisors prefer mutual cancellations to avoid litigation.
How do I conduct franchise validation calls?
Pull the full Item 20 contact list rather than relying on names the franchisor provides. Call a cross-section that includes newest and oldest operators, urban and rural sites, high and low volume units, and franchisees who transferred out or ceased operations. Industry consultants refer to franchisor-recommended franchisees as “songbirds” and warn against relying on them alone. Plan on 10 to 15 calls.
How big should my trade area be for a franchise?
It depends on the vertical. QSR trade areas compress to a 5-to-7-minute drive time. Fitness franchises target 10-to-15-minute drive radii with 15,000 to 30,000 in population. C-stores work on a half-mile to one-mile primary radius. Childcare draws from a tighter 3-to-5-mile residential band. Use drive-time polygons computed against the road network rather than radius rings.
What traffic count do I need for a franchise location?
It is vertical-dependent. C-stores work best on roads with 5,000 to 15,000 vehicles per day at operating speeds of 30 to 45 MPH, the “Goldilocks Zone.” QSRs prioritize daypart-specific traffic over total daily count. Lunch-driven QSRs need 11 AM to 1 PM traffic that supports 35% to 40% of daily revenue. Pull AADT counts from the state DOT’s free traffic count map.
How much does a franchise build-out cost?
2024 to 2025 benchmarks: QSR build-outs average around $535 PSF with a range of $250 to $600 PSF. General retail in-line space averages around $155 PSF nationally, up roughly 4% year-over-year. Restaurant new construction runs $250 to $500 PSF; renovation runs $150 to $300 PSF. Tier-1 metros (NYC, LA) run 40% to 60% higher than Tier-2 metros (Phoenix, Dallas). Fitness franchise launches typically total $100,000 to $250,000.
What is percentage rent in a commercial lease?
Percentage rent is base rent plus a percentage of gross sales above a breakpoint. Natural breakpoint equals annual base rent divided by the agreed percentage. Typical retail percentages run 2% to 12%, with 6% common. The tenant wants low base rent, a high breakpoint, and a low percentage rate. Define “gross sales” precisely in the lease, carving out taxes, employee meals, returns, gift-card sales, and third-party delivery commissions.
How much are franchise royalty fees?
Royalty fees typically run 4% to 8% of gross revenue. QSR is 4% to 6%. Retail is 5% to 7%. Services run 6% to 8%. Ad fund or brand fund adds another 1% to 4%. Combined royalty plus marketing in food service commonly totals 8% to 10% of gross. Because royalty is on gross, the operator pays regardless of profitability, so modeling royalty drag at bottom-quartile sales is the right test.