
Location intelligence is the practice of layering geographic and spatial analysis on top of CRM, firmographic, and intent data so sales leaders can answer questions a list view cannot answer, including where opportunity is concentrated, which reps carry an unfair drive burden, and which territories are over- or under-covered relative to spend.
In the Sales Management Association’s 2024 benchmarking work, 58% of B2B companies rated their own territory design as ineffective. That figure is a leadership self-assessment from the executives accountable for the number, not a third-party guess. It is the strongest signal in the data that location intelligence is a leadership problem rather than a sales-ops backwater, because the people closest to the result are the people calling it broken.
This article covers what location intelligence does for a sales leader, the metrics it improves, the mistakes that come up most often, and the diagnostic questions a leader can ask of the current setup before approving the next spend on mapping software, route tools, or territory consultants.
What Location Intelligence Means in a Sales Context
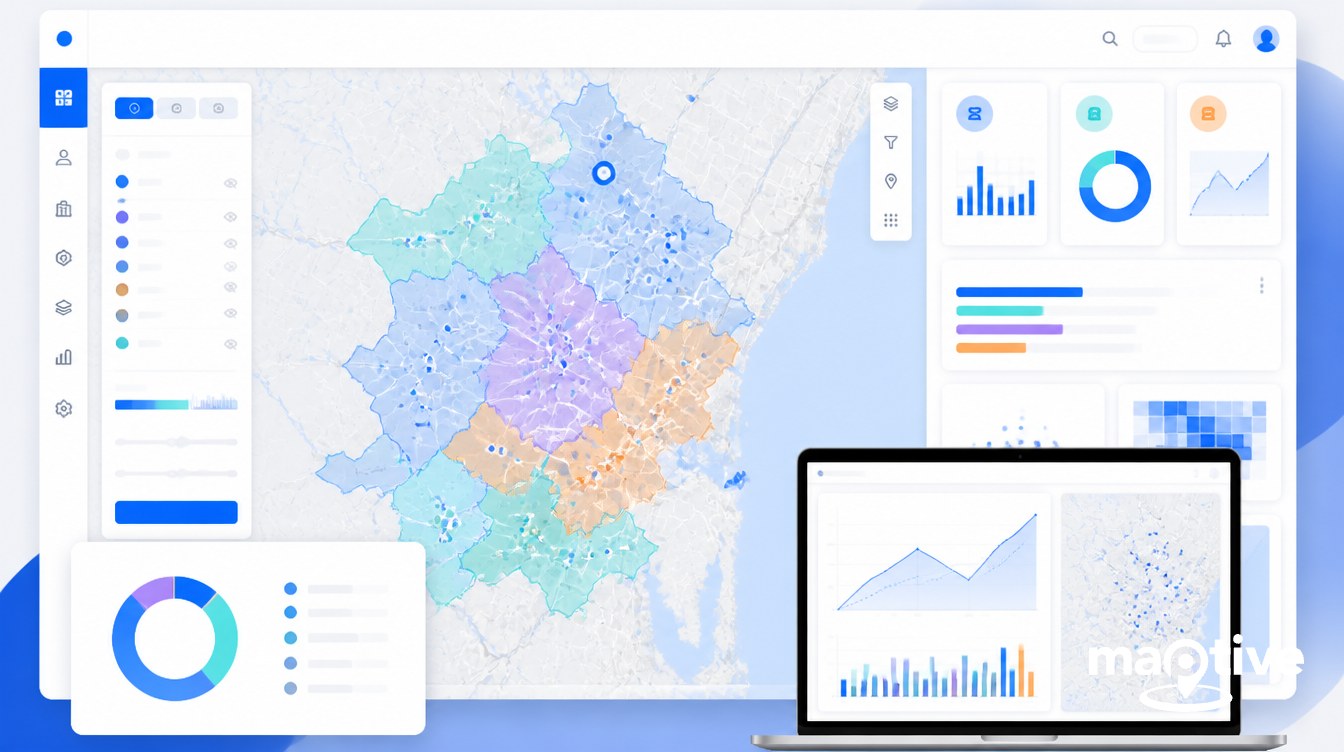
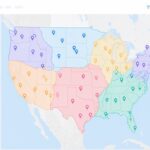
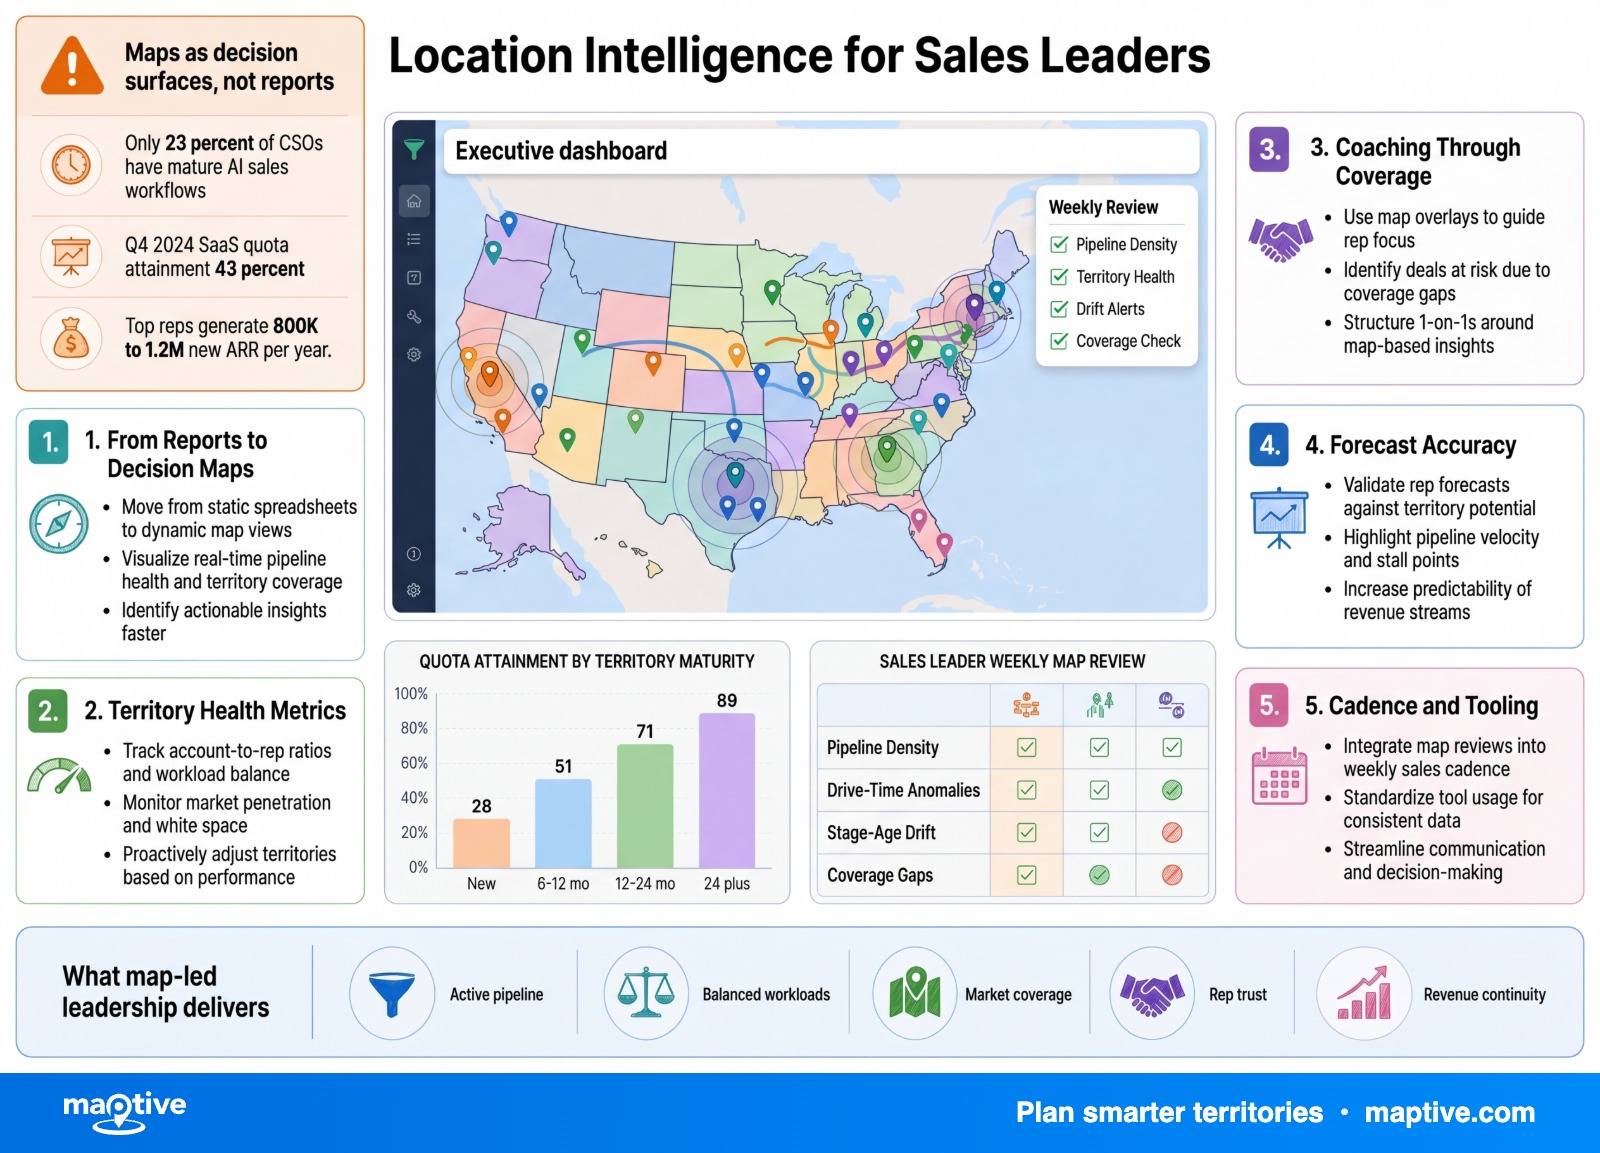
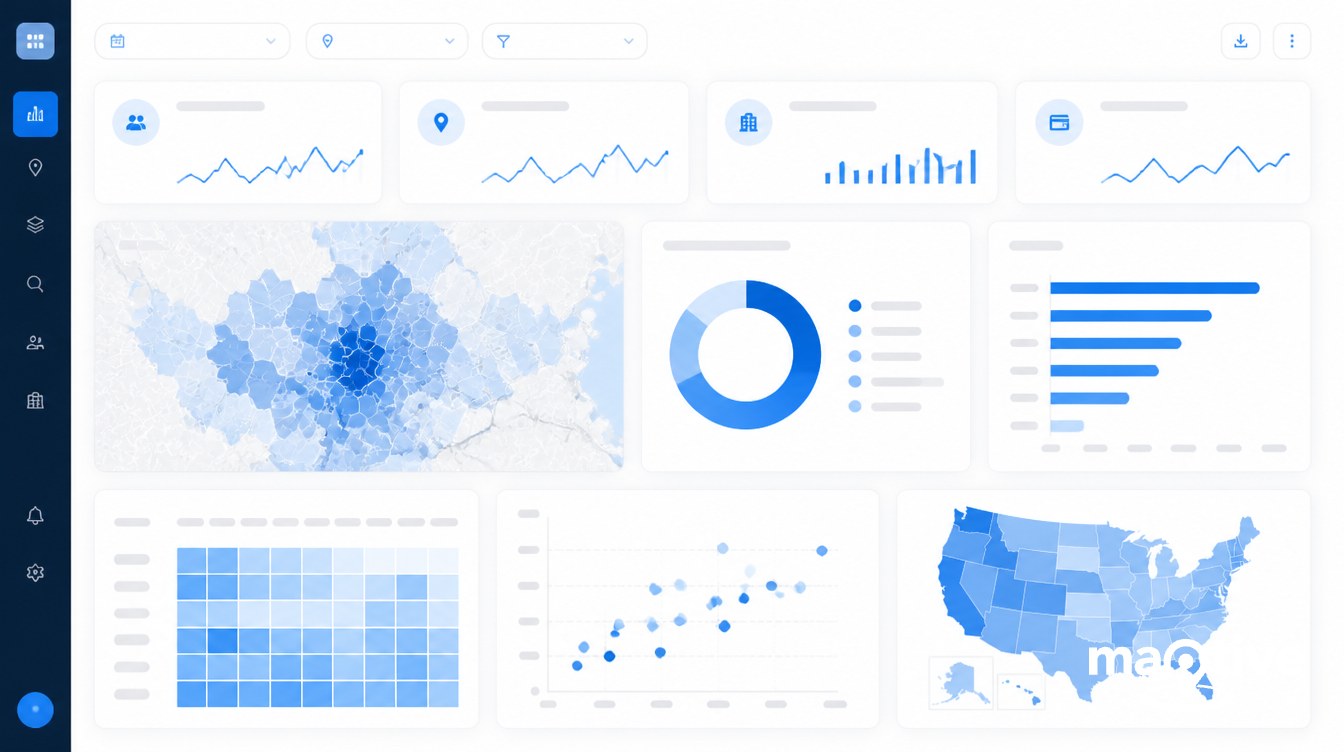
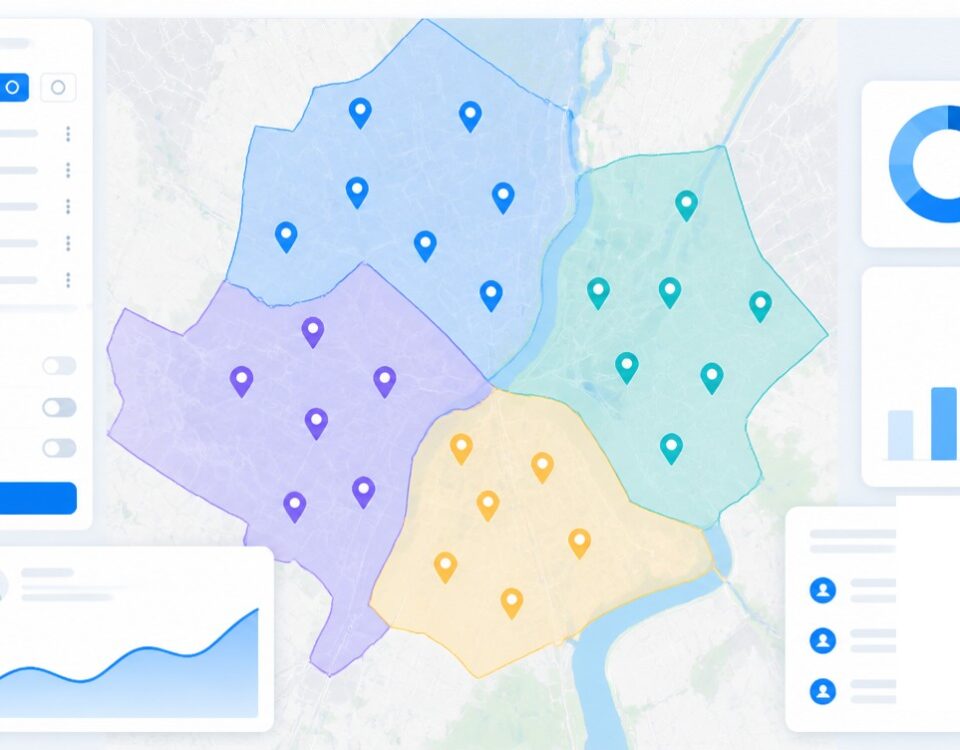
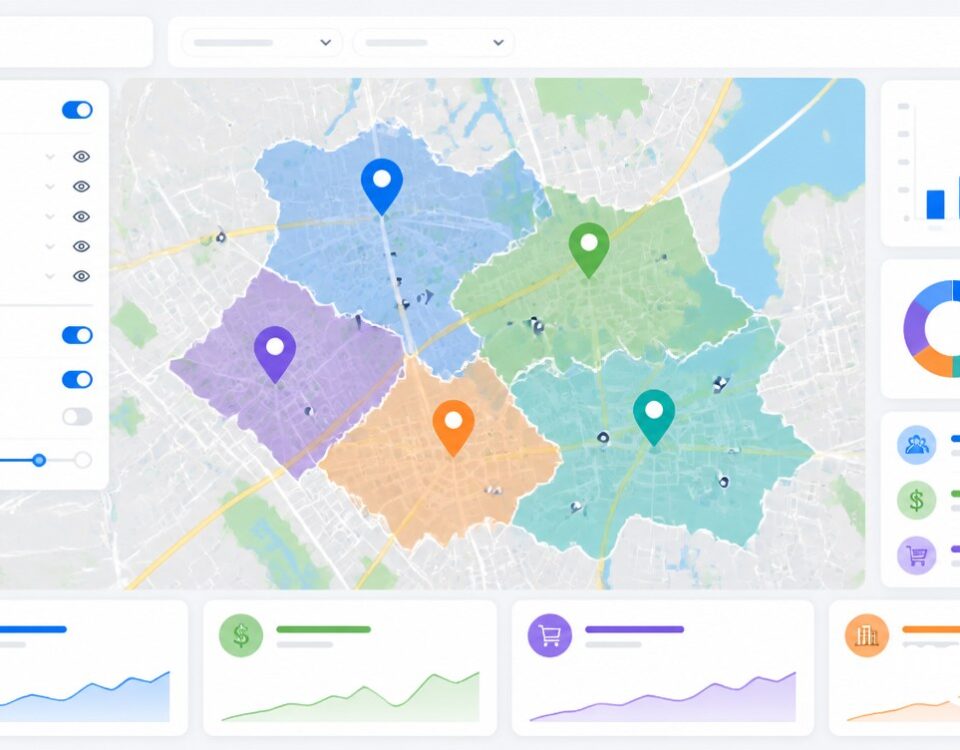
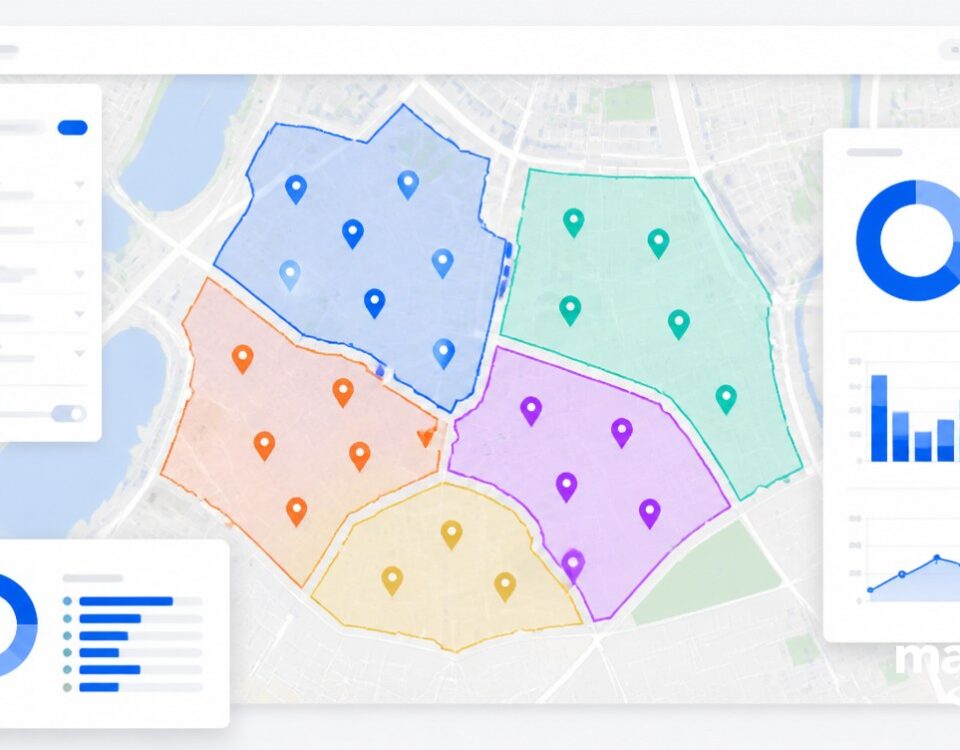
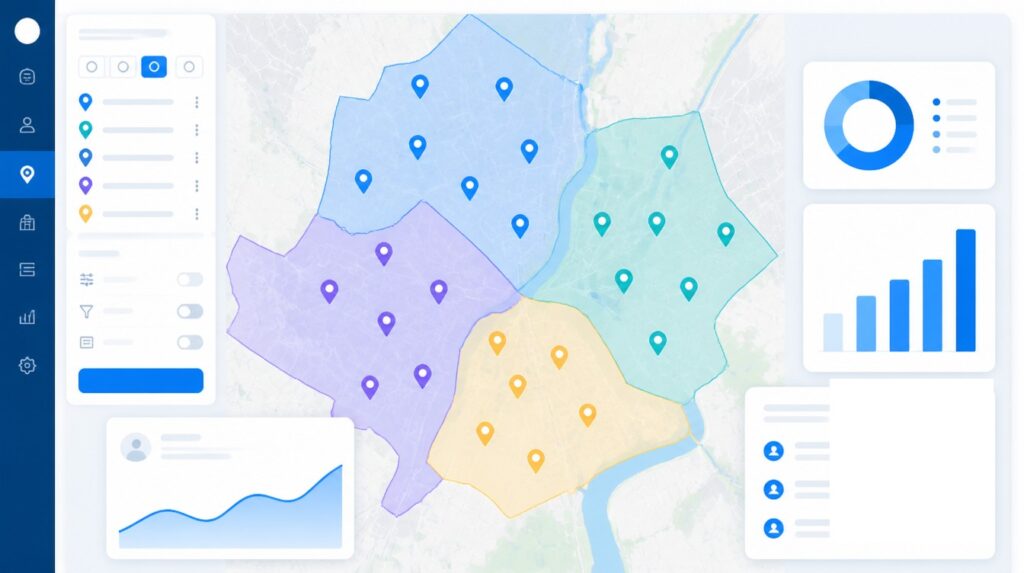
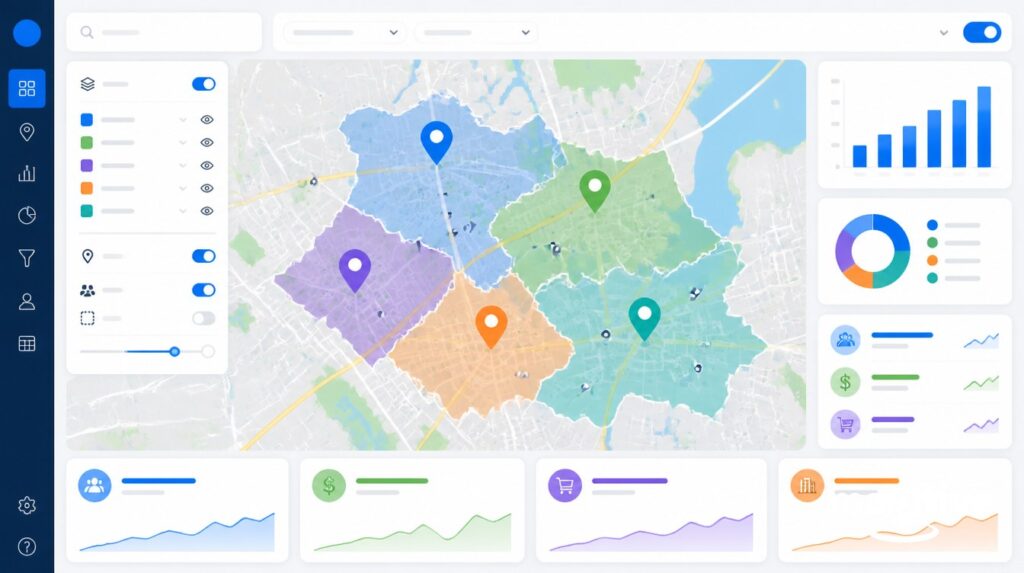
A CRM map view plots records on a basemap. It shows where the accounts are. Location intelligence adds spatial analytics on top of that view, which includes territory drawing, drive-time isochrones, demographic and firmographic overlays, pipeline density heatmaps, and algorithmic territory balancing. The output is a set of decisions written back to the CRM, not a static picture exported to a slide.
The category is not small. The global location intelligence market reached $21.5 billion in 2024, with a 14.7% projected U.S. CAGR through 2030. The narrower sales mapping software segment was estimated at $2.5 billion in 2025 and is projected to grow at a 15% CAGR through 2033. Adoption surged 49% in retail and logistics during 2024, and advanced AI-enabled solutions saw a 52% uptake in the same period.
Sales leaders matter to this category because every decision the technology supports, including territory size, rep assignment, capacity planning, hiring location, and market entry, sits at the VP Sales or CRO level on the org chart. Sales Ops and Field Ops execute the work. The accountability for the revenue outcome lives one or two levels up.
The Three Jobs Location Intelligence Does for a Sales Leader
Location intelligence performs three distinct jobs for a sales leader. They are related but not interchangeable. A tool that does one well may be irrelevant to another.
Territory Design and Balance
The first job is structural. ZS Associates founders Andris Zoltners and Prabhakant Sinha, drawing on more than 2,000 territory projects across 50-plus countries, found that roughly 55% of sales territories are too large or too small. Most territory maps in production are structurally wrong by the founder definition of the field.
The cost is measurable. Alexander Group benchmarks place capacity loss from misaligned territories at 15% to 25%, and well-designed territories at 10% to 20% productivity gains. Forrester research finds companies using data-driven territory planning achieve 15% to 20% higher quota attainment than those using geography and account count alone. Harvard Business Review’s published estimate is that pure territory rebalancing can lift revenue 2% to 7% without adding a single rep. Across these sources the range is consistent. Territory design carries low single-digit to mid-teens revenue impact, on existing headcount, in a normal year.
Most leaders treat territory design as an annual exercise tied to comp planning. The data suggests quarterly review of territory health is closer to the right cadence, with full redesign annually or semi-annually. Industry benchmarks place the share of companies with inadequate mid-year evaluation practices at 79%, which is the operational reason capacity loss compounds.
Daily Rep Execution
The second job is operational. Salesforce State of Sales data, cited across the sales productivity literature, shows that field reps spend roughly 28% of their working time actually selling. The remainder goes to admin, internal meetings, and driving. Without route optimization, drive time consumes 30% to 40% of the working day for outside reps.
Route optimization reduces drive time 15% to 40% depending on the baseline. A 2025 ORM Technology report on field sales found a 27% drop in travel cost per closed deal after route software deployment, and 19% more face-to-face meetings per rep without expanding the budget. A pharmaceutical case study showed 30% to 40% travel reduction, enough to add 2 to 3 physician visits per day. Top field reps in industries with dense urban coverage average 8 to 12 in-person visits per day, while outside sales reps across industries average about 31 visits per week.
For a sales leader, the relevant question is how many additional revenue-producing hours per rep per week the org could recover with routing alone. The math at typical capacity recovers between half a day and a full day per rep per week.
Strategic Decisions
The third job is strategic. Location intelligence informs the questions that sit above the territory map, including where to hire next, which markets to exit, which regions to target for expansion, and which acquisitions support geographic logic.
McKinsey’s 2024 global M&A trends review found that 16 of the 20 largest deals of the year were in the Americas, and net corporate inflows rose 70% to $149 billion, with geographic positioning explicitly cited in the rationale for 14 of the year’s notable deals. For sales leaders pushing growth, geographic expansion through acquisition supplies the fastest path to a new region while preserving customer relationships in the existing one. Location intelligence supplies the supporting evidence, including coverage gap analysis, white space mapping, and overlap assessment.
The strategic layer is also where account-based marketing meets the map. The ABM market reached $1.41 billion in 2024 and is projected to hit $3.81 billion by 2030. Pairing ABM target lists with location intelligence shows where target accounts sit geographically, who covers them, and how dense the coverage is. The same map answers both the demand question and the deployment question.
The Metrics a Sales Leader Should Track
A sales leader does not need to monitor every spatial output the platform produces. The metrics that warrant leadership attention fall into three categories.
Quota and Revenue Metrics by Geography
Quota attainment is the leadership-level number. Reporting it only by rep hides the spatial pattern. Reporting it by zip code, MSA, or state surfaces the dispersion as either rep performance or territory structure. Forrester data points to 15% to 20% higher attainment for data-driven planning organizations, and Xactly research finds up to 15% higher revenue and 30% higher sales objective attainment in companies with well-managed territories.
Win rate by territory belongs in the same category. B2B win rates average 20% to 30% overall, but the dispersion is large. Enterprise deals over $100K ACV run 10% to 20%. Mid-market is 20% to 35%. SMB and transactional is 30% to 50%. Variance inside those ranges, plotted by region, points to coverage gaps, drive-time burden, or local competitor strength more often than to rep skill. Less than 43% of sellers hit quota in 2024, which is the backdrop against which any geographic variance has to be interpreted.
Execution Metrics
Drive time per visit, visits per day, and miles per visit are the execution metrics worth tracking at the leader level. Field sales reps spend an average of 3.9 days in the field each week, and the top performers post 8 to 12 visits per day on dense routes. The leader-level question, applied to the bottom quartile, is which factor explains the missed visits, coverage area, route quality, or coaching. A per-rep dashboard cannot answer that without the spatial layer.
Published benchmarks for route optimization users point to a 20% drive-time reduction with a corresponding sales lift in the low twenties. Treat that as a directional figure rather than a forecast. The actual gain depends on the starting baseline, the rep density, and how aggressively the routing rules are enforced.
Coverage and Cost Metrics
Pipeline coverage ratio is the most important coverage metric, and the standard pipeline coverage benchmark is 3x to 4x against quota. New territories, longer sales cycles, and enterprise deals require higher coverage. Transactional SMB territories can run leaner. Tracking the ratio at the org level hides at-risk geographies. Reporting it by territory exposes them in time to redeploy.
CAC by region is the underused metric. The 2024 Pavilion benchmark put the median SaaS New CAC Ratio at $2.00, up 14% year over year. Emerging markets can run 40% to 60% lower CAC than developed markets for comparable accounts. The implication is that the same dollar invested in a high-cost region produces measurably less pipeline than in a low-cost adjacent one, and the spatial view is the only place the comparison shows up cleanly. Territory coverage ratio, calculated as unique customers contacted divided by total territory prospects, multiplied by 100, is the corresponding execution metric on the same axis.
The Most Common Mistakes Sales Leaders Make with Location Intelligence
Six errors come up consistently in territory and field sales reviews.
The first is treating territory design as a static annual exercise tied to compensation planning. The 79% inadequate-mid-year-evaluation figure from Alexander Group describes most B2B sales organizations. The org chart looks orderly. The map underneath it accumulates drift between rebalancing events.
The second is drawing balanced shapes without drive-time reality. A territory that contains the right number of accounts on paper can still strand a rep in two hours of daily commuting. Without drive-time isochrones in the design process, a rep covering exurban Texas is not interchangeable with one covering downtown Boston, and the cited figure of 30% to 40% of the day lost to driving is the operational consequence.
The third is skipping change management after a redesign. Alexander Group’s three-stage framework, Assessment, Design, Implementation, treats change management as half the work. Territory churn dampens productivity and morale, and rep buy-in determines the outcome of the new map, lift or attrition.
The fourth is buying mapping software for sales without integrating it to the CRM. Recent industry data put the share of sales leaders citing disconnected data as a major obstacle at 81%. A map that does not match the CRM record set becomes a shadow report, useful for slides and useless for decisions.
The fifth is optimizing for fairness over potential. Equal account counts feel correct in a planning meeting and produce 15% to 25% capacity loss in execution. Effective designs weight by revenue potential, win probability, install base, and rep capacity. Account count is one input, not the input.
The sixth is forecasting from gut rather than spatial data. Gartner data shows 67% of sales ops leaders find forecasting harder than three years ago, and the company expansion case is where the cost shows up. A 15% sales projection error in market entry can mean selecting the wrong region entirely.
Questions to Ask About Your Current Setup
A sales leader does not need to audit the territory platform line by line. The following questions surface most of what matters.
When was the last full territory rebalance, and what triggered it? A redesign tied only to comp planning is too infrequent. A redesign tied to product launch, M&A, or measured coverage drift is the right cadence.
Does the mapping tool write back to the CRM? If the answer is no, the tool produces shadow data and the team is making decisions from two truths.
Who owns location intelligence as a strategy area? RevOps is the answer in the fastest-growing companies. Among the 2026 highest-growth cohort, 75% are projected to operate under a RevOps model, up from less than 30% in 2023. Field Ops typically owns route execution. Sales Ops typically owns the tooling. Strategy ownership at the leader level is the ambiguity that breaks most programs, and 34% of go-to-market leaders cite team alignment as a structural problem in 2024 data.
Are territories weighted by revenue potential, win probability, and install base, or only by geography and account count? The first answer is correct. The second produces the 15% to 25% capacity loss benchmark.
Are quota attainment, win rate, CAC, and pipeline coverage reported by zip, MSA, or state, not only by rep? The spatial view is what reveals coverage gaps. Per-rep reporting hides them.
How fast are inbound leads routed to the geographically correct rep? Best in class is seconds. Many organizations route in hours or days, which is enough delay to lose a hot lead to a competitor with faster assignment. Tools including Maptive automate the geographic routing rule so that lead-to-rep handoff matches territory definition by design rather than by spreadsheet.
Do scenario models run before territory changes, or do changes happen and then results get measured? Predictive analytics can improve forecasting accuracy by up to 20%, and AI-driven simulation of territory plans under multiple constraints is becoming standard practice in RevOps-led organizations. The cost of running a scenario is low. The cost of a botched redesign is two quarters of recovery.
The leaders who get location intelligence right share a small number of habits. They review territory health quarterly and redesign annually. They integrate mapping with the CRM rather than running them in parallel. They weight territories by potential rather than count. They assign one owner at the leadership level and one operational owner underneath. They run scenarios before changes. They report spatially, not only by rep. The work is not exotic. It is consistent.
Frequently Asked Questions
What is location intelligence in sales?
Location intelligence in sales is the practice of layering geographic and spatial analytics over CRM, firmographic, and intent data so sales leaders can answer questions a list view cannot answer. It surfaces where opportunity is concentrated, which territories are over- or under-covered, how drive time affects rep capacity, and where to invest, hire, or exit. The output is a decision layer, not a map view.
How is location intelligence different from a CRM map view?
A CRM map view plots records on a basemap. Location intelligence adds spatial analytics, including territory drawing, drive-time isochrones, demographic and firmographic overlays, pipeline density heatmaps, and algorithmic balancing. It writes the resulting assignments back to the CRM rather than treating the map as a one-time export.
How often should sales territories be rebalanced?
Most B2B sales organizations should review territory health quarterly and conduct full structural redesigns annually or semi-annually. High-growth SaaS and tech organizations benefit from quarterly redesign cycles due to product and market velocity. Manufacturing and healthcare can run on bi-annual or annual cadence. Recent benchmarks find 79% of companies have inadequate mid-year evaluation practices.
How much revenue lift can territory rebalancing produce?
Published Harvard Business Review research estimates 2% to 7% revenue lift from territory optimization without adding headcount. Alexander Group benchmarks 10% to 20% productivity gains from thoughtful territory design. Xactly research finds up to 15% higher revenue and 30% higher sales objective attainment in companies with well-managed territories.
How does route optimization help field sales?
Route optimization reduces drive time 15% to 40% on average, lowers fuel costs up to 30%, and lets reps add 2 to 3 visits per day. A 2025 ORM Technology report found 27% lower travel cost per closed deal and 19% more face-to-face meetings per rep without expanding the budget after route software deployment.
What sales metrics improve with location intelligence?
Quota attainment dispersion narrows. Win rate by territory becomes visible. Miles per visit and visits per day improve. Cost per acquired customer by region becomes comparable. Pipeline coverage by zip or MSA becomes trackable. Forrester research shows companies using data-driven territory planning achieve 15% to 20% higher quota attainment than those using geography and account count alone.
Who owns location intelligence inside a sales organization?
Revenue Operations typically owns territory design, quota setting, and capacity planning. Field Operations or Sales Operations usually owns daily execution tooling like route optimization. By 2026, 75% of the fastest-growing companies are projected to adopt a RevOps model, up from less than 30% in 2023.
Does Salesforce or HubSpot include location intelligence?
Salesforce and HubSpot include basic map views, but full territory drawing, route optimization, drive-time analytics, and demographic overlays usually require a mapping tool integrated with the CRM. Integrated mapping tools sync accounts, contacts, and deals so territory assignments and visit data flow back to the CRM rather than living in a separate file.
Can AI help with sales territory planning?
AI lets sales leaders simulate territory plans under multiple constraints, including balanced quota, drive time, install base, and intent signals, and see predicted performance before committing to a change. AI can also surface next-best-action recommendations for reps in the field. Predictive analytics can improve sales forecasting accuracy by up to 20%, and AI-driven simulation is becoming standard practice in RevOps-led organizations.
What is the average B2B sales win rate by geography?
B2B win rates average 20% to 30% overall. Enterprise deals over $100K ACV run 10% to 20%. Mid-market is 20% to 35%. SMB and transactional categories run 30% to 50%. Variance within those bands by region usually traces to coverage gaps, drive-time burden, or local competitor strength rather than rep skill.
What pipeline coverage ratio should a sales territory target?
The standard benchmark is 3x to 4x pipeline coverage against quota. New territories, enterprise deals, and longer sales cycles require higher coverage. Transactional SMB territories can run leaner. Coverage should be tracked by territory, not only at the org level, to spot at-risk geographies before the quarter is decided.
How does ABM connect to location intelligence?
Account-based marketing identifies high-value target accounts. Location intelligence shows where those accounts sit geographically, who covers them, and how dense the coverage runs. The ABM market reached $1.41 billion in 2024 and is projected to hit $3.81 billion by 2030, and pairing the two on a single map view is becoming a default RevOps practice.


