Demographic Mapping & Census Data
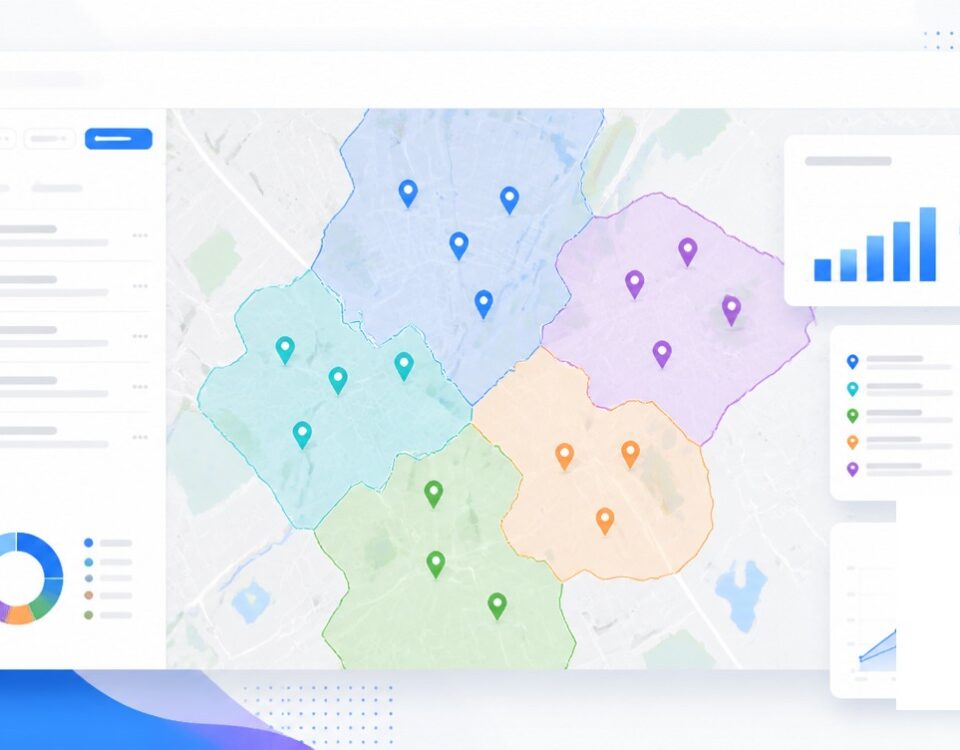
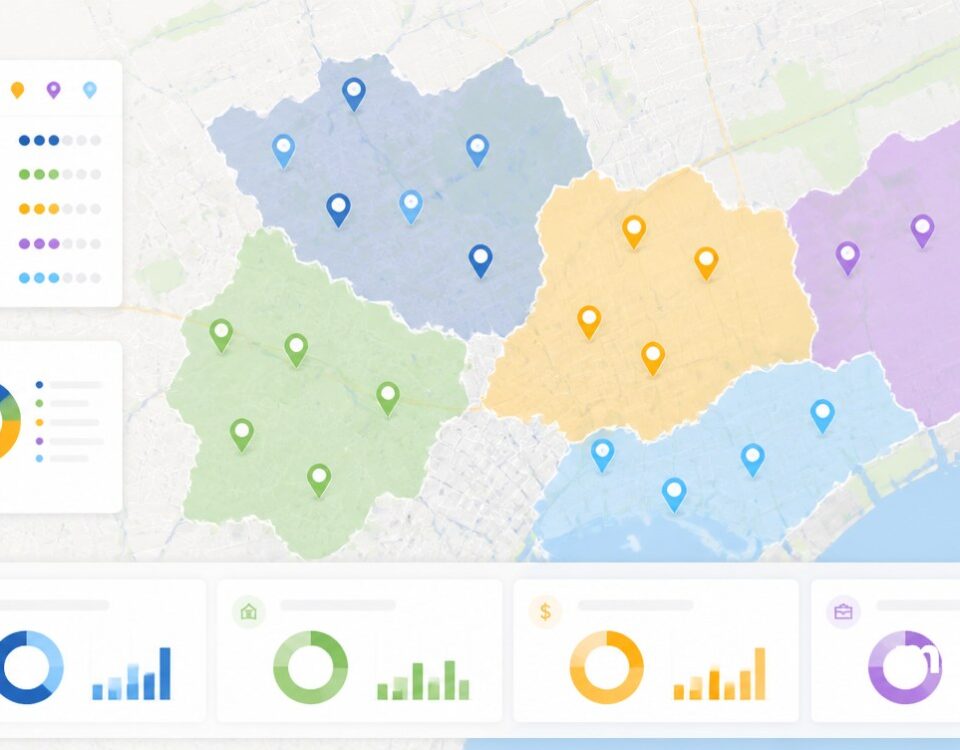
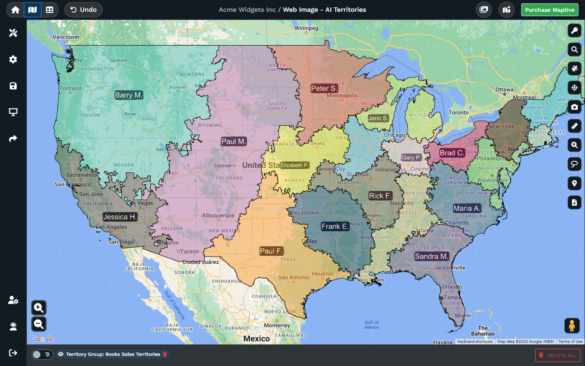
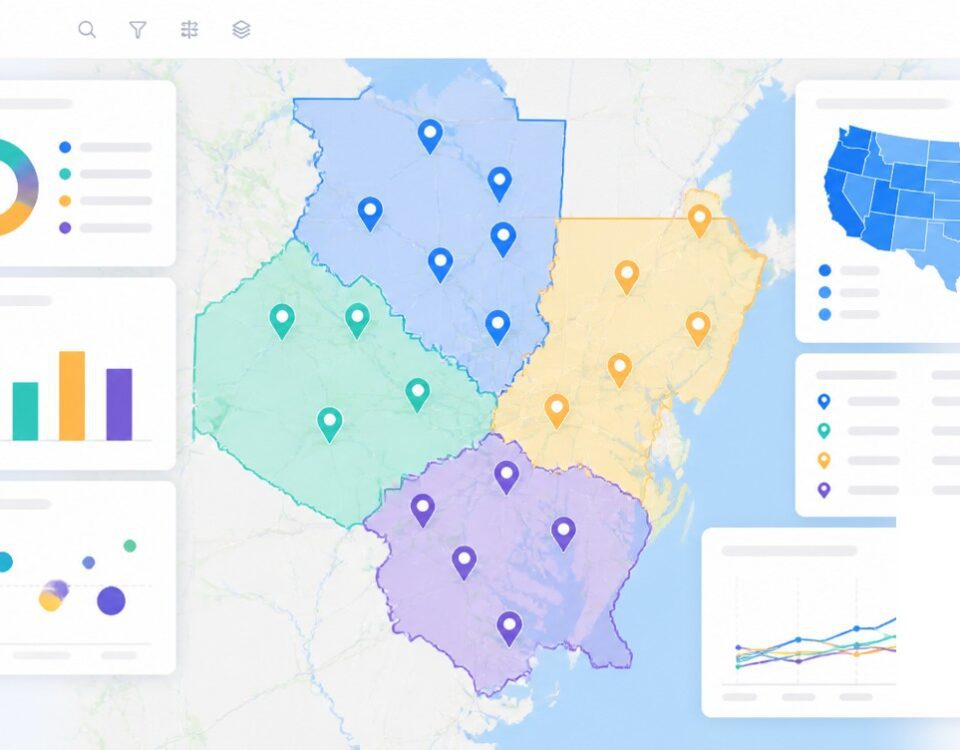
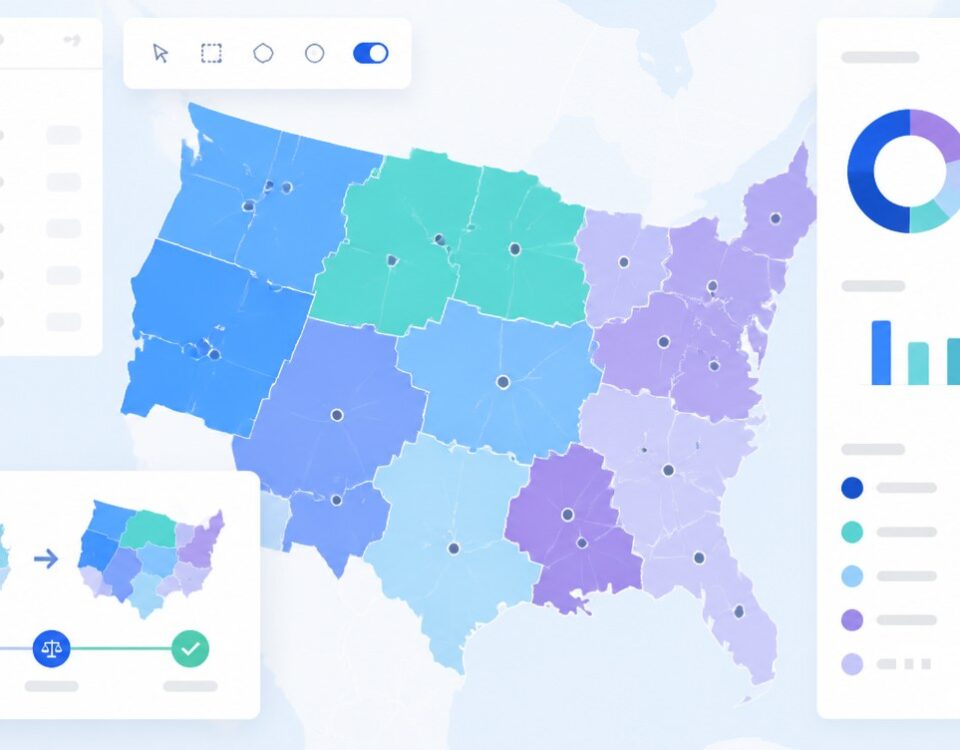
Color a US or Canada map by a Census metric of your choosing, then click any region, radius, or drive time polygon to read the demographic totals back from inside that area.
Census Data Near Every Map Marker
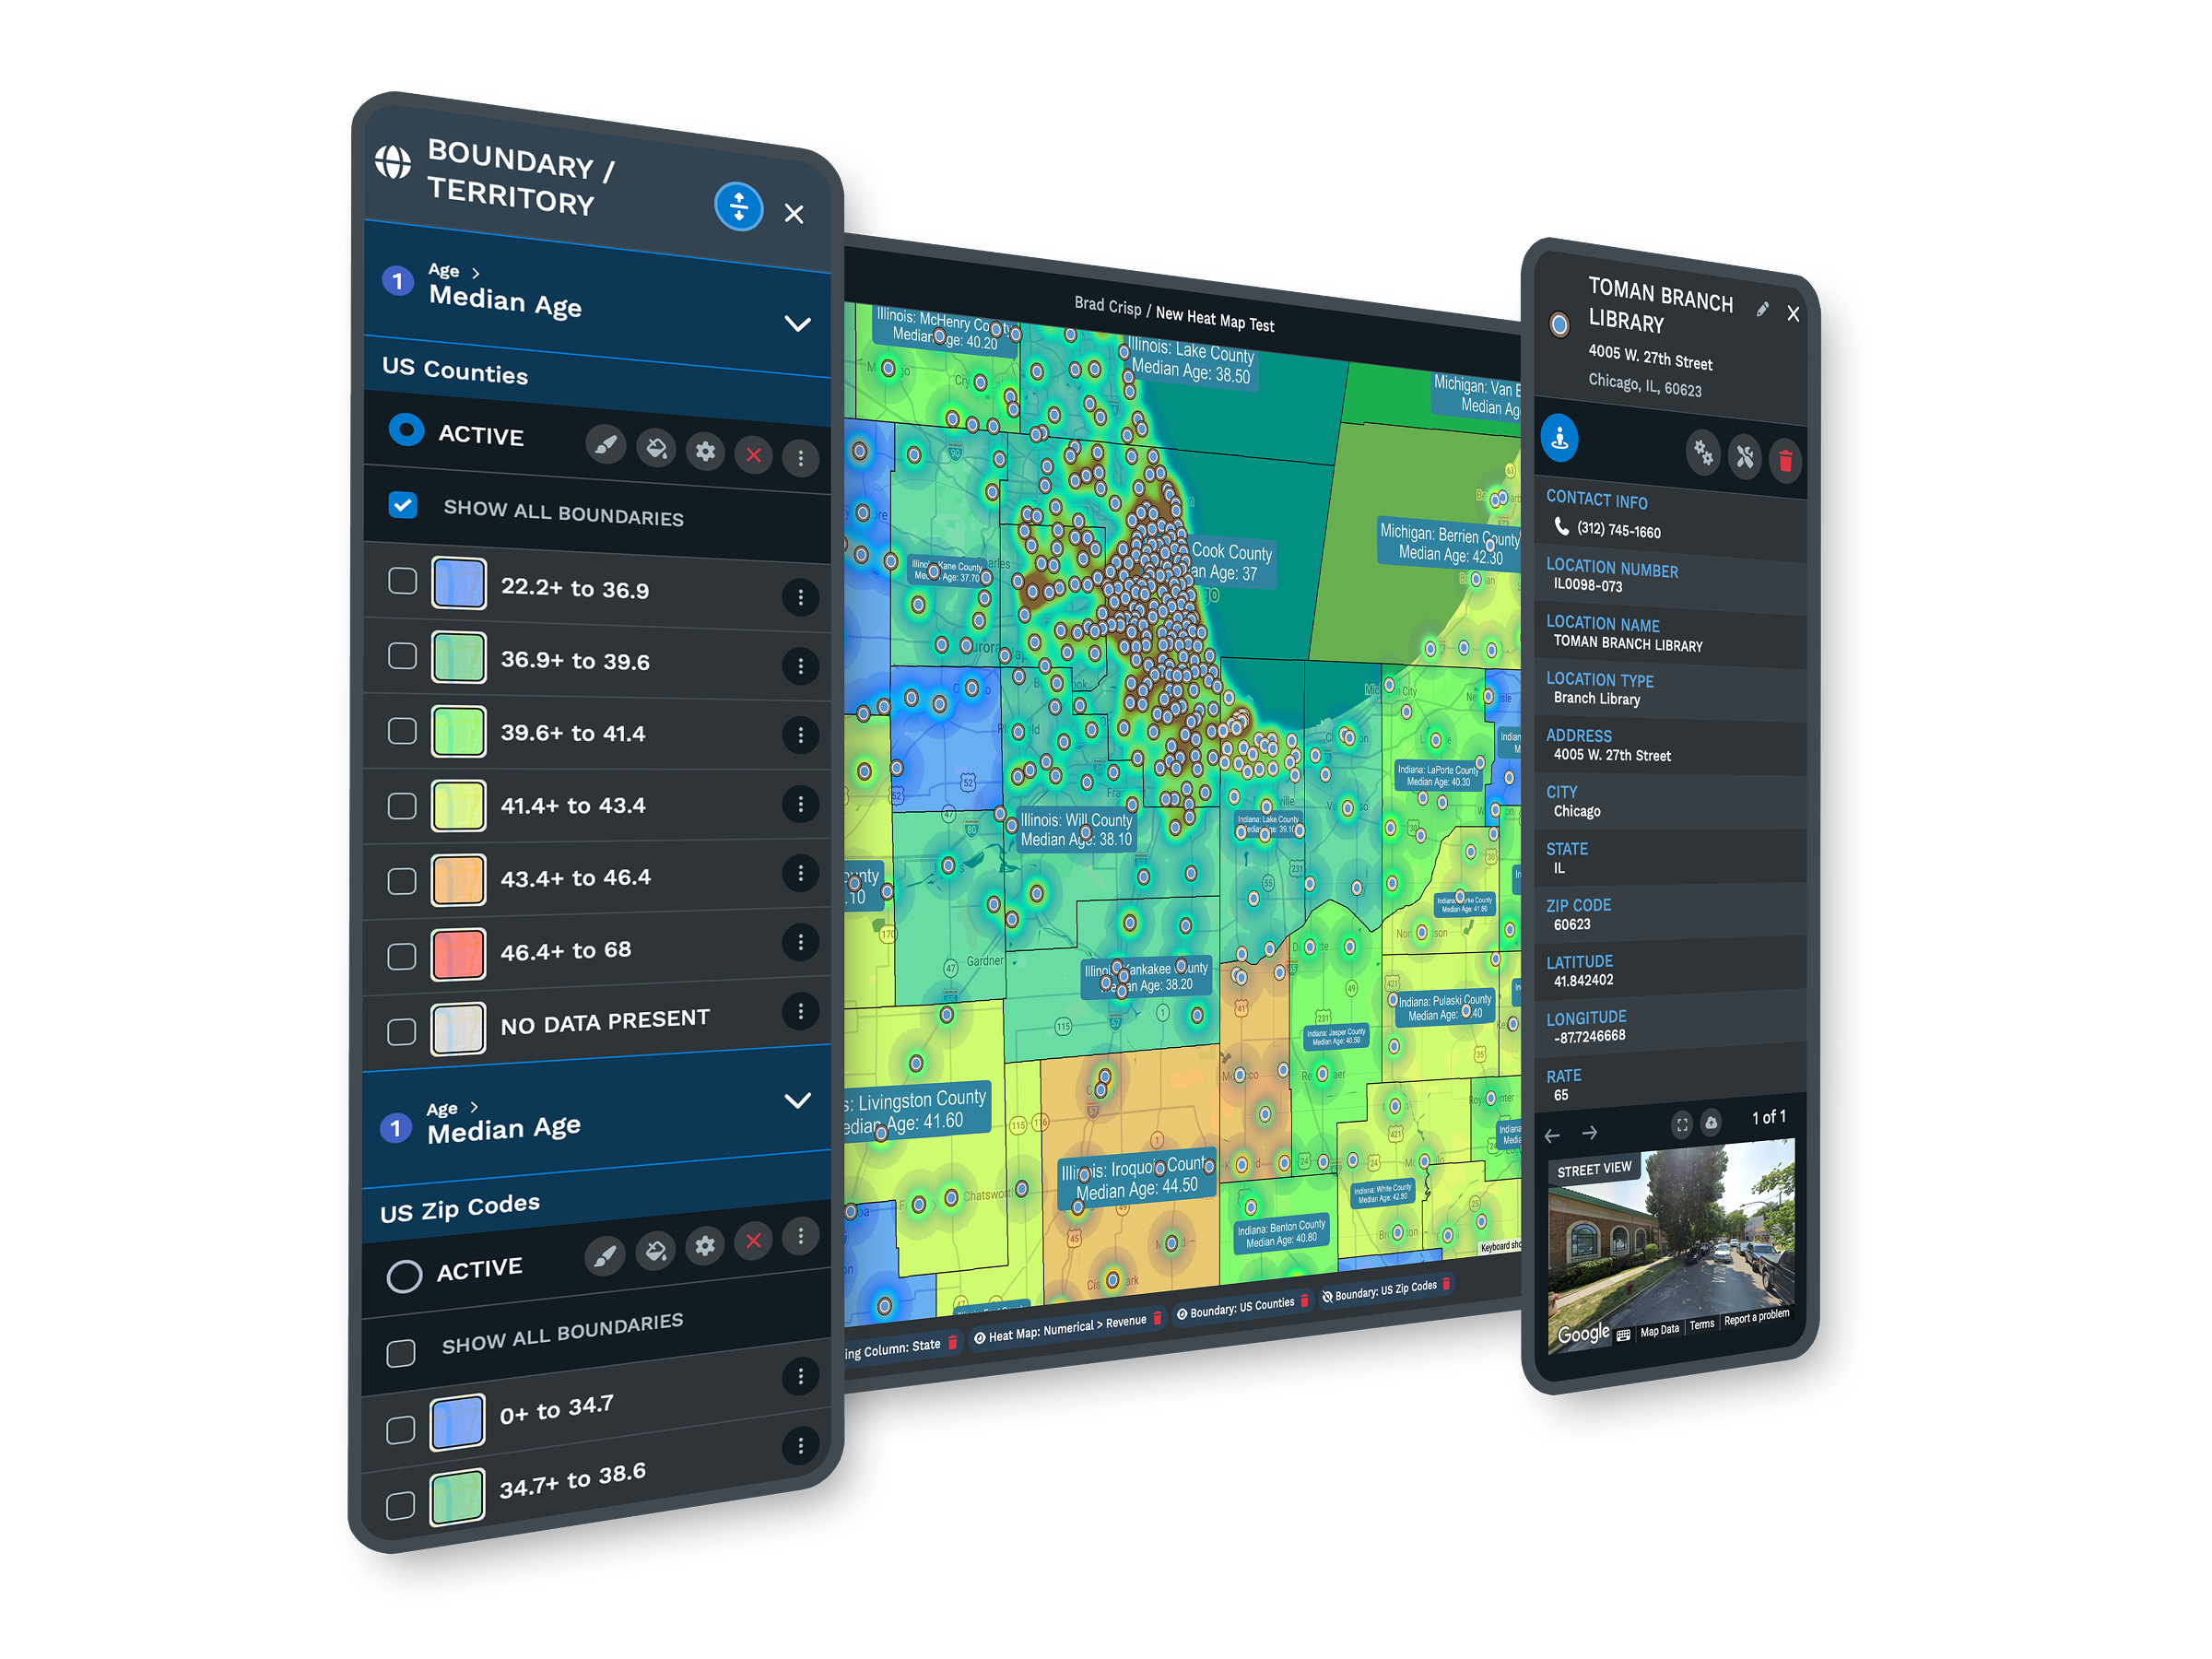
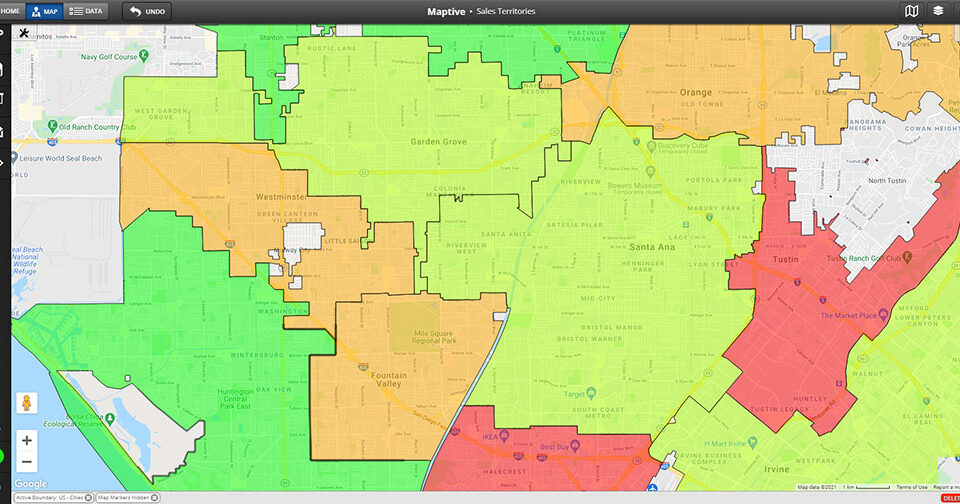
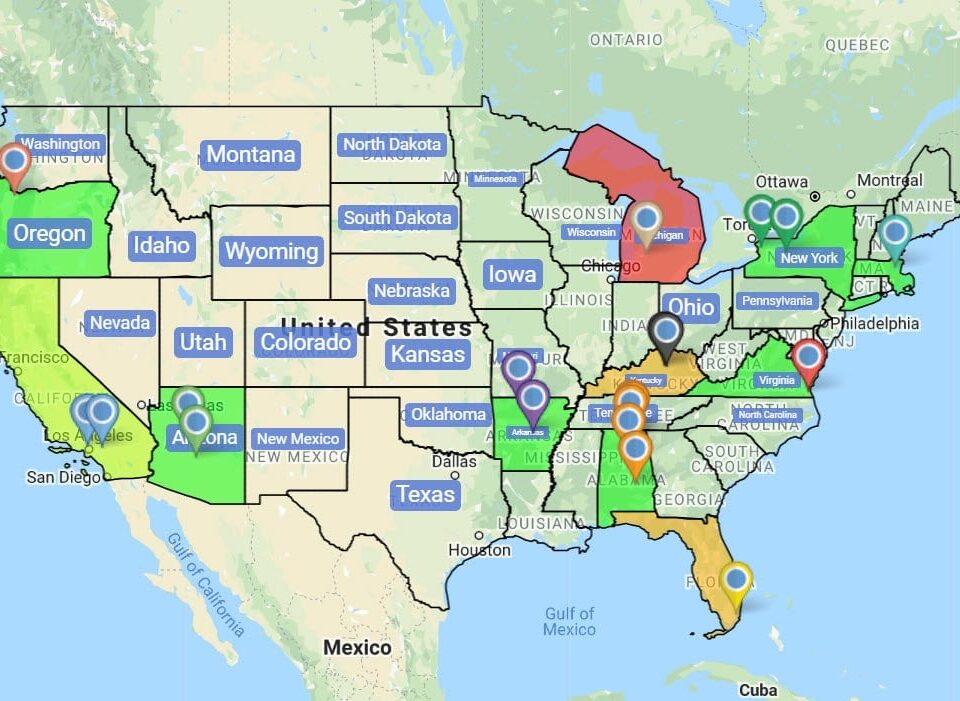
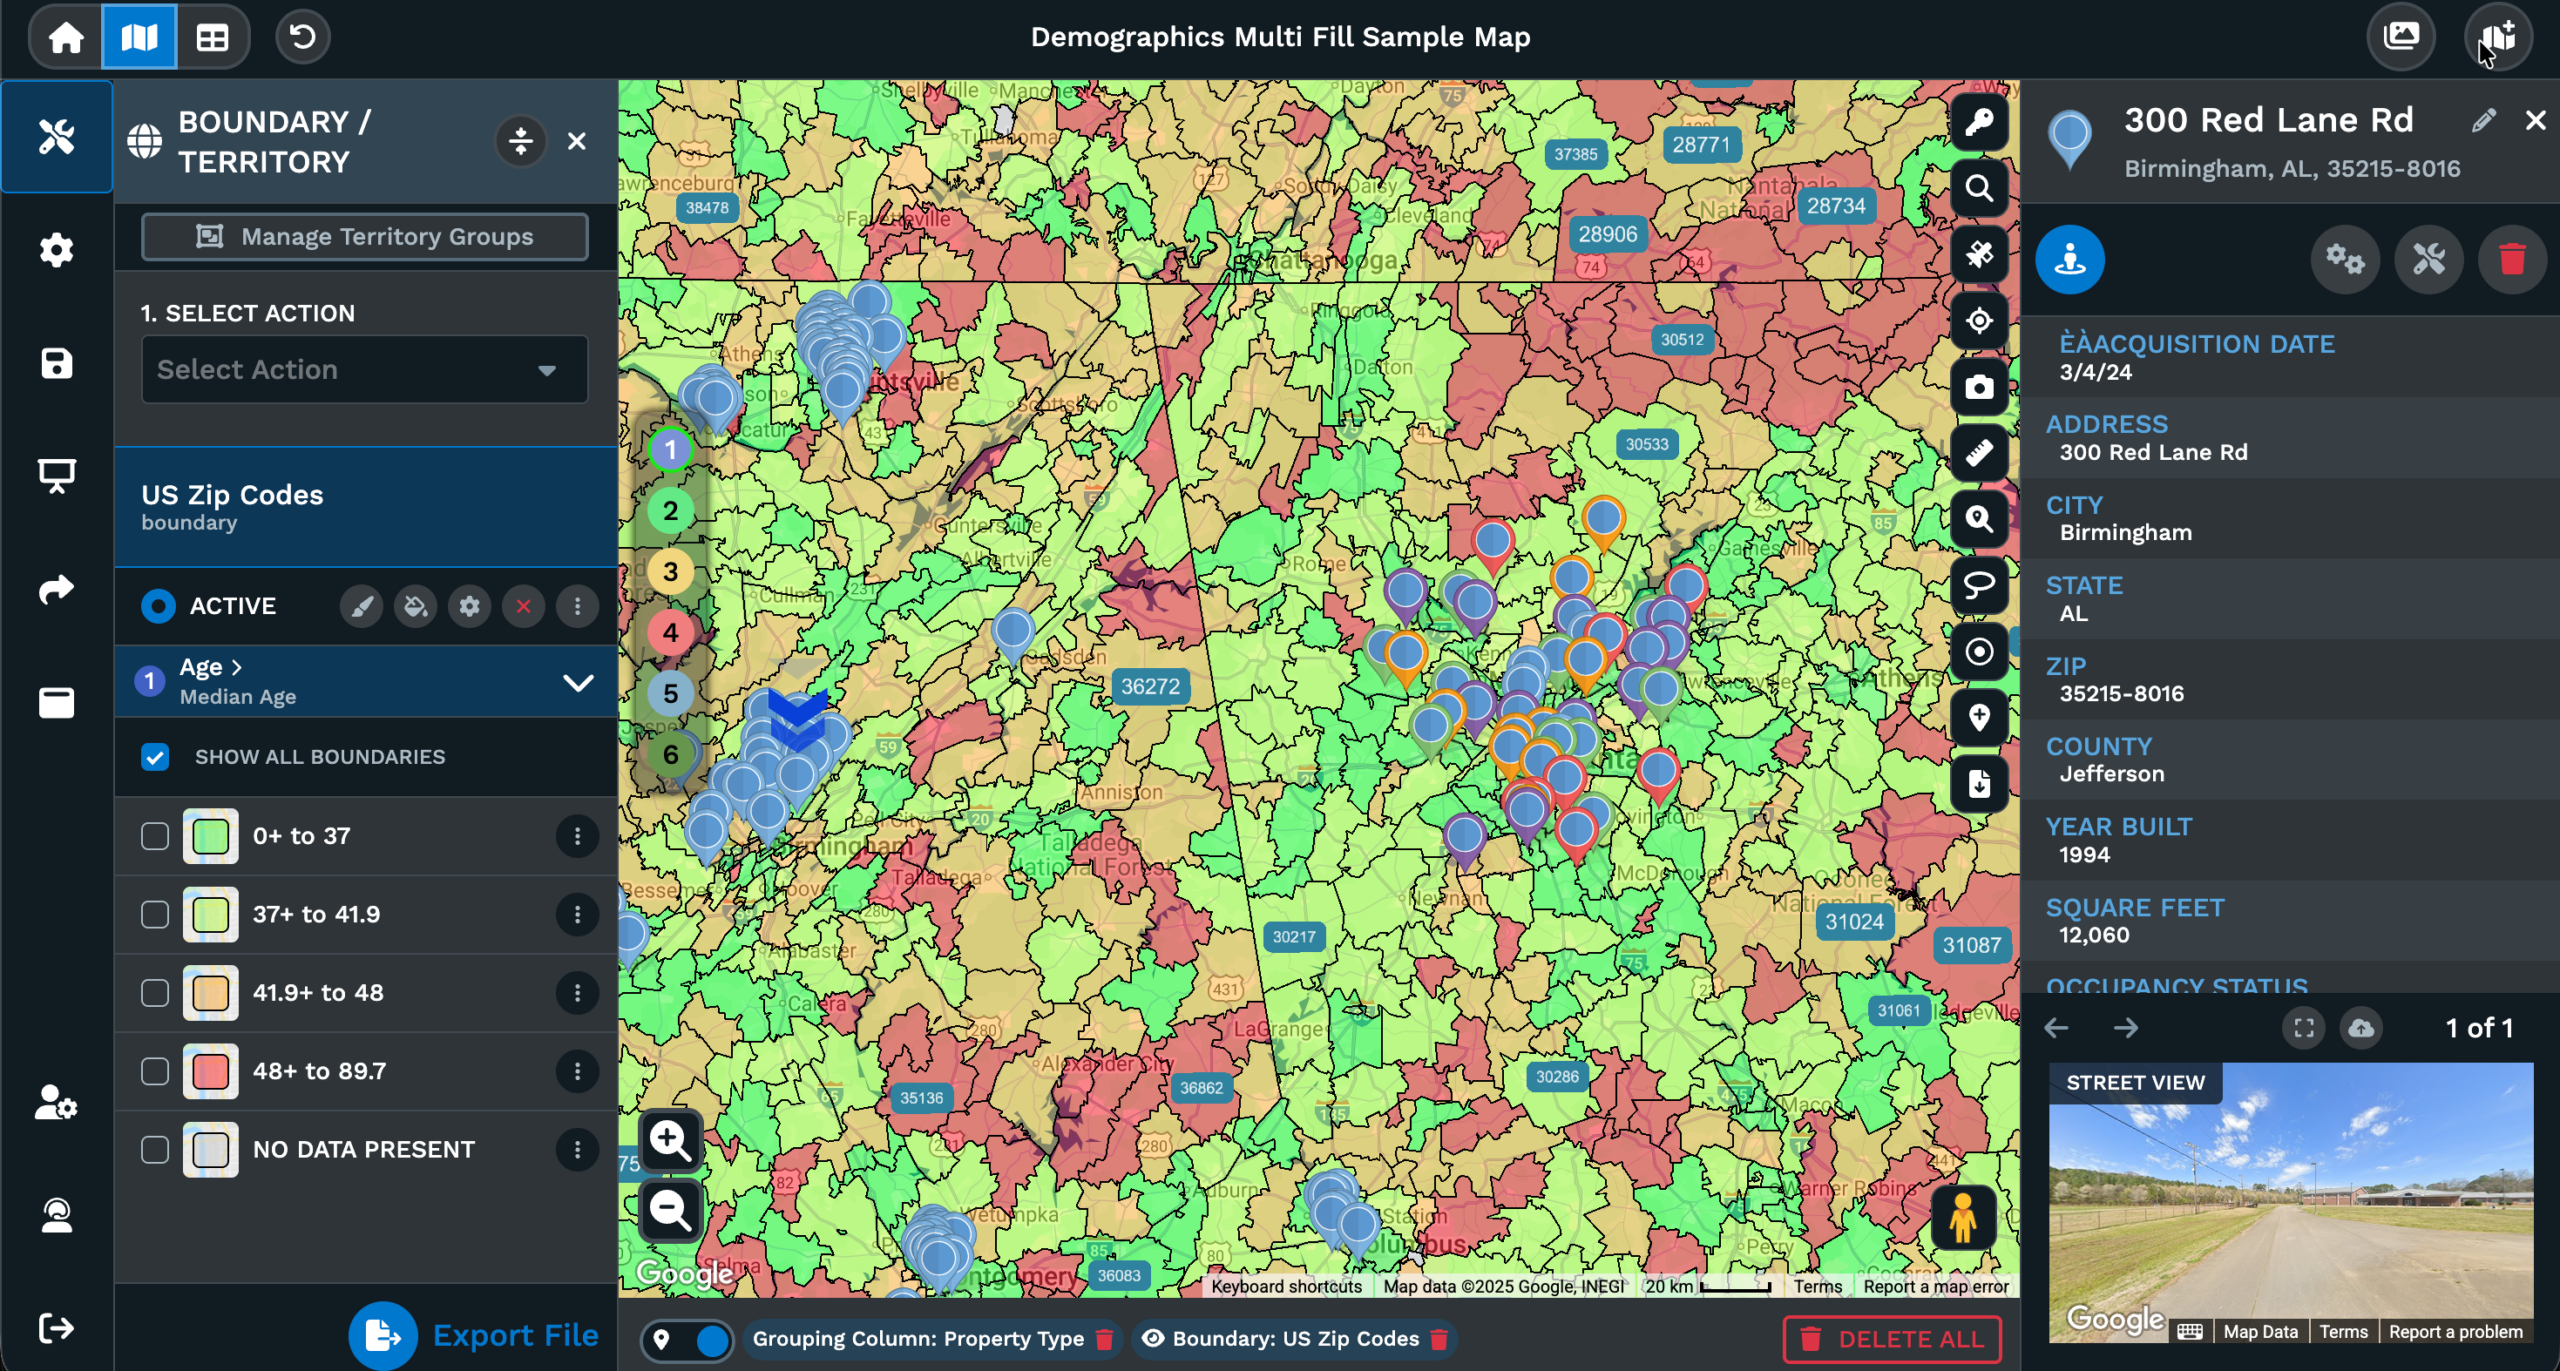
Boundary fill from Census: Pick a boundary set, choose Demographic Census Data as the fill type, then point it at the demographic group and metric you want on the map.
Region toggle: Switch the source between United States and Canada inside the Customize Metrics dialog, so the same workflow covers either country without a second tool.
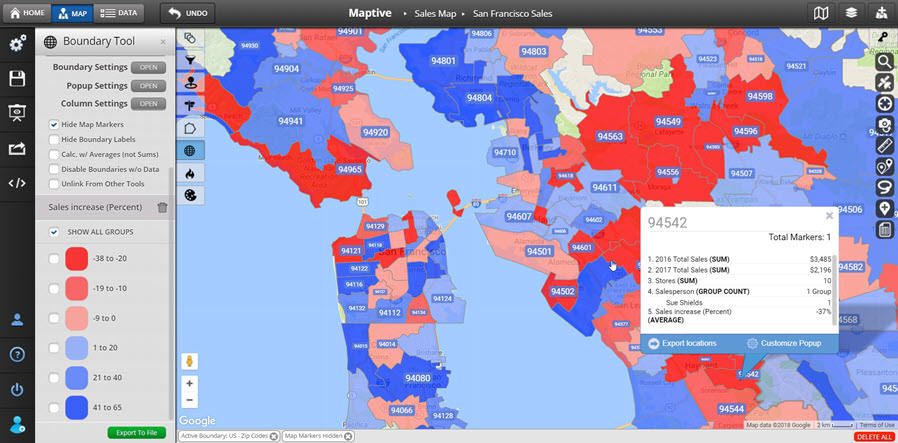
Per-area pop-out: Click a boundary, drawn territory, radius, or drive time polygon to open a pop-out with the Census totals you added from the demographic group dropdown.
Customize Metrics builder: Add as many Census fields to the pop-out as you want from Demographic Group and Fill Data, then remove ones a new question no longer needs.
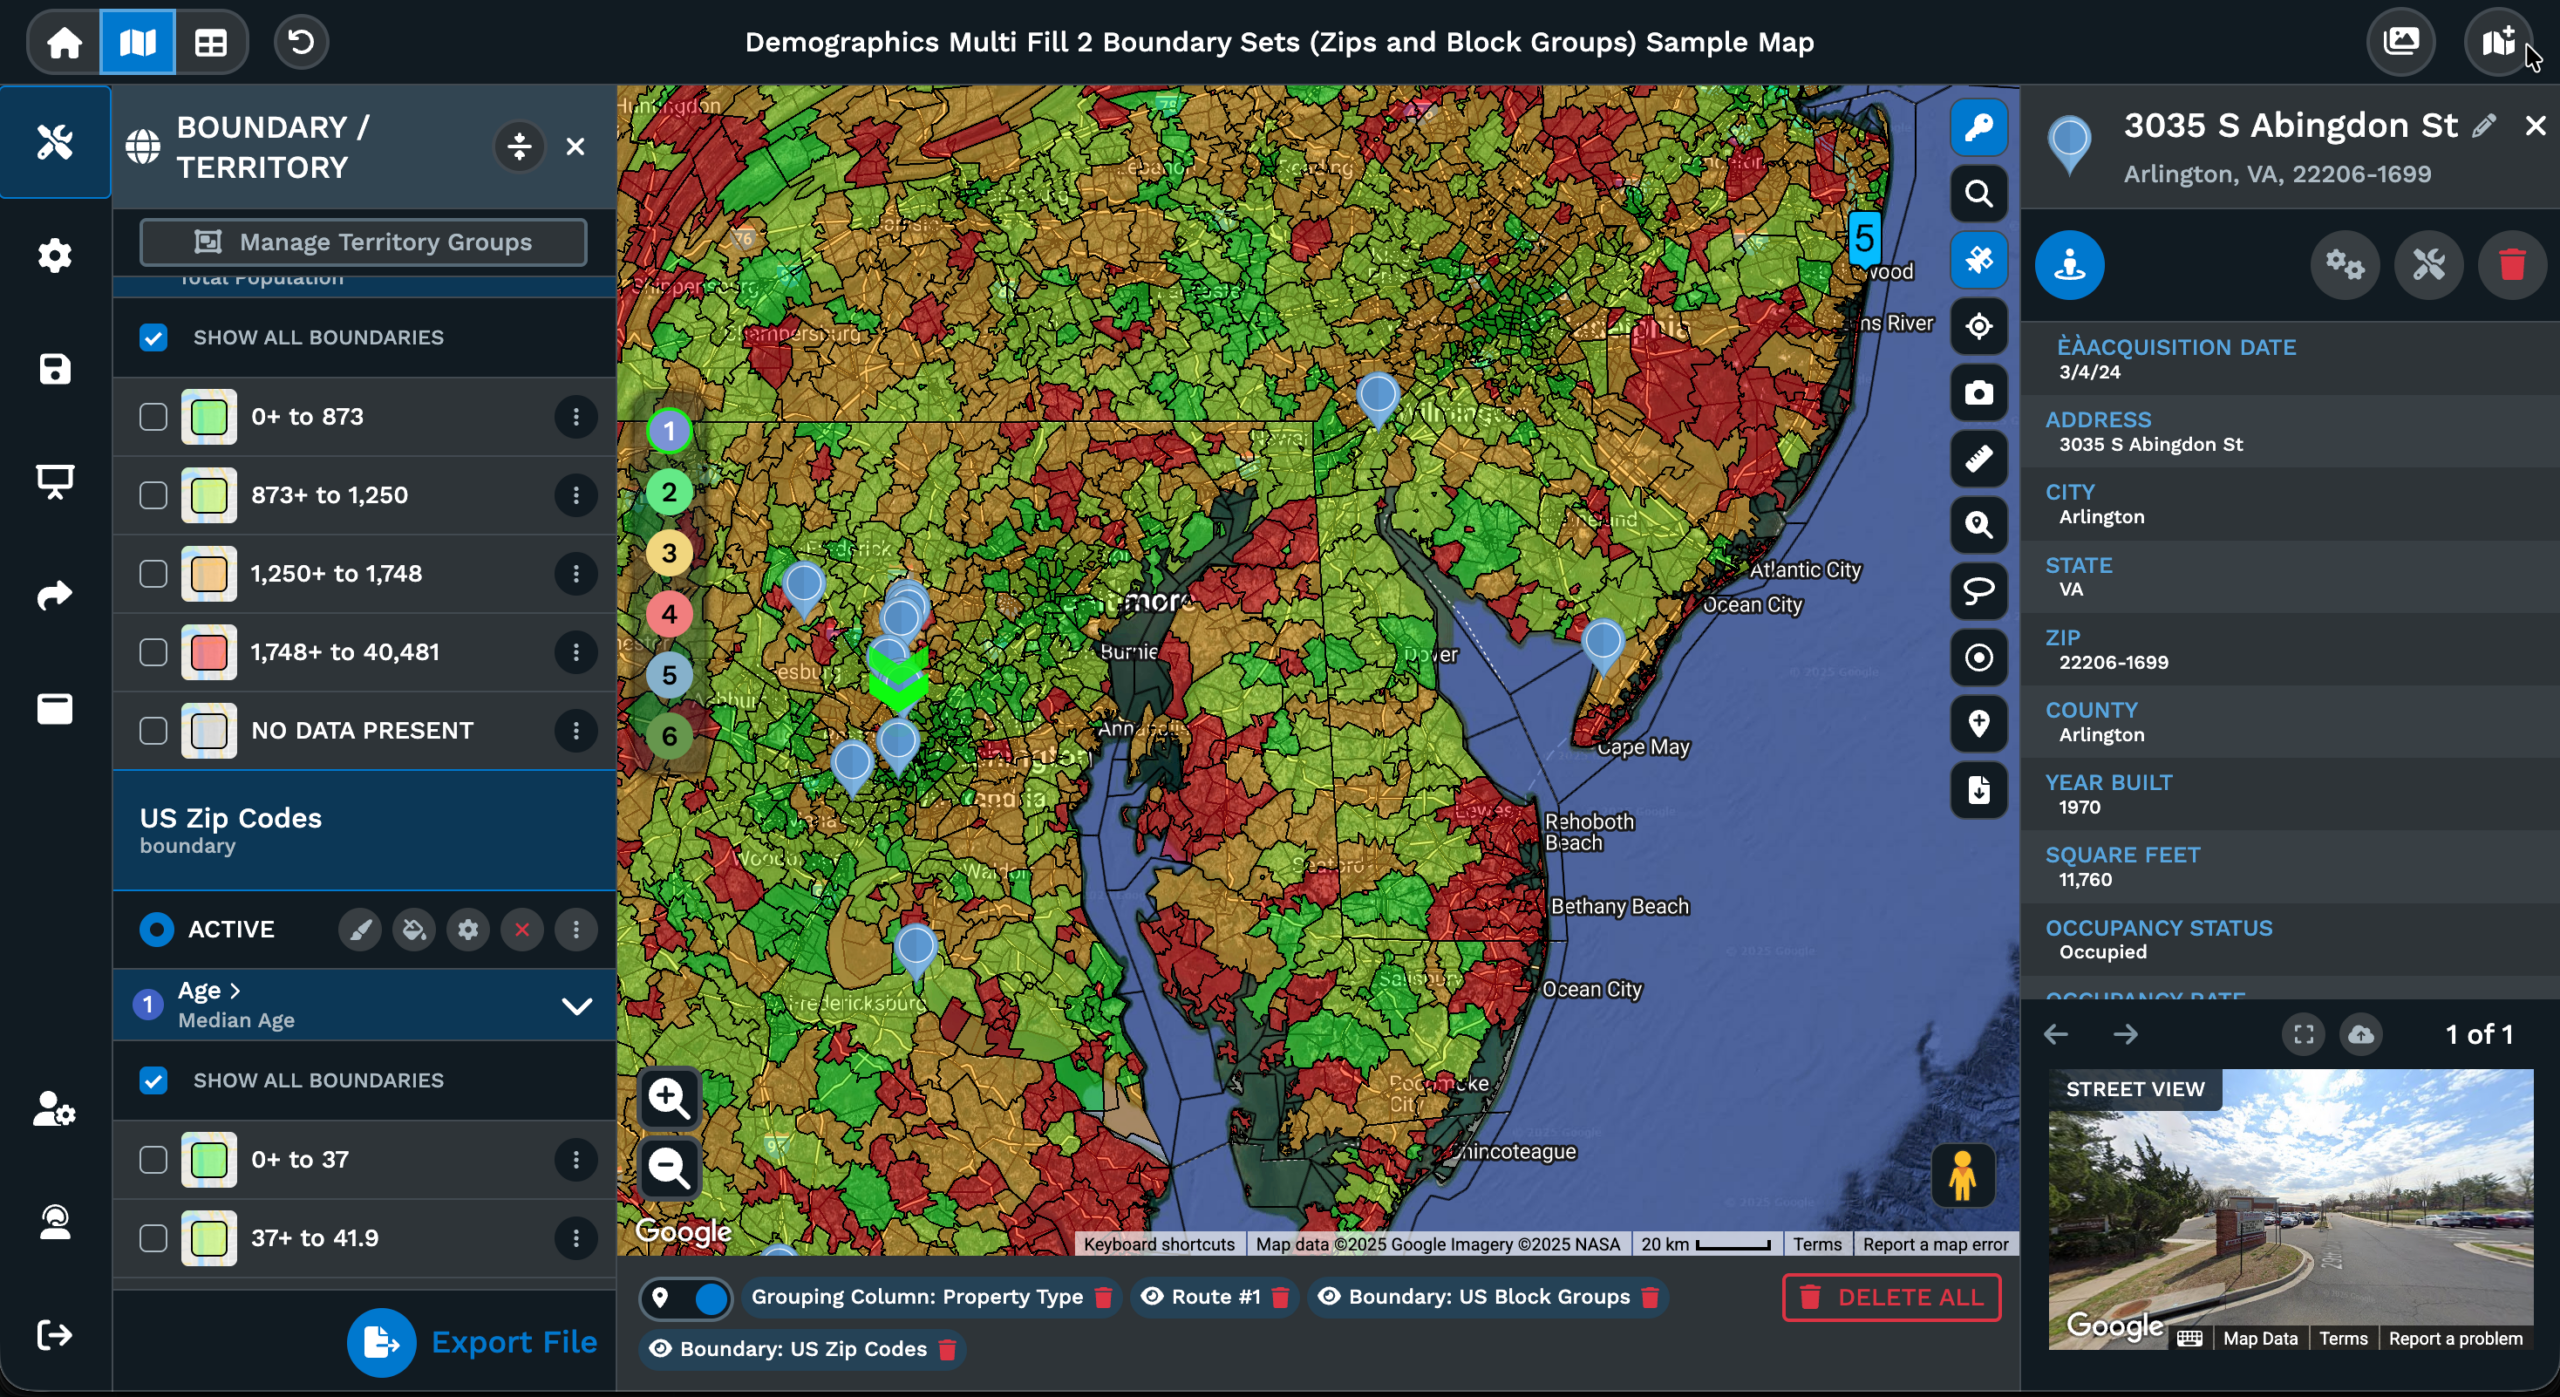
Stacked fills per set: Stack 2 or more Census fills on the same boundary set, then switch the active fill through the fill indicator without redrawing the map underneath.
Label control: Toggle Include Name, Include Value, and Include Legend to print the metric on each region so the map reads on its own and the side panel can stay closed.
Add Demographics in 3 Steps
1
Open
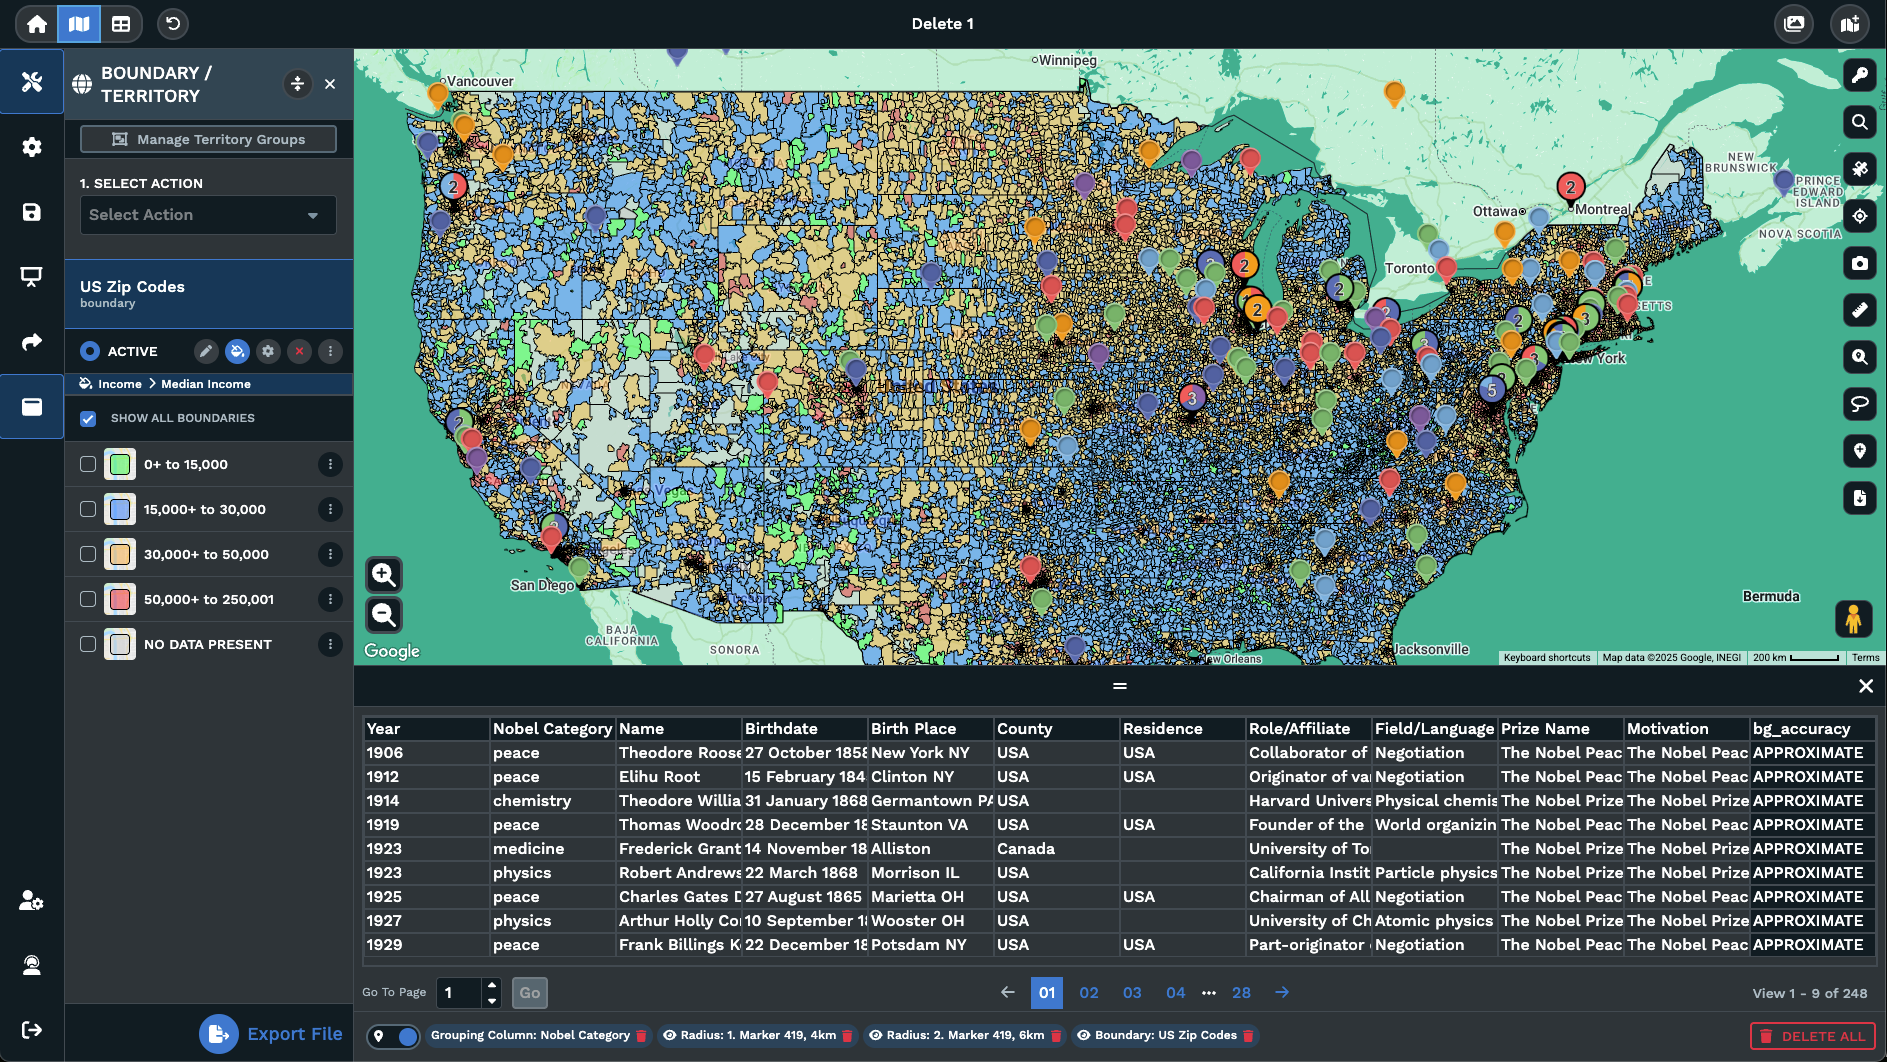
Open Map Tools, then open the Boundary Tool. Pick the boundary set you need, such as US States or any set on the list.
2
Pick
For the fill type, choose Demographic Census Data, then pick the Demographic Group and a Fill Data metric in that group.
3
View
Click Load Boundaries and every region colors by that metric, with a key of ranges and the total printed on each region.
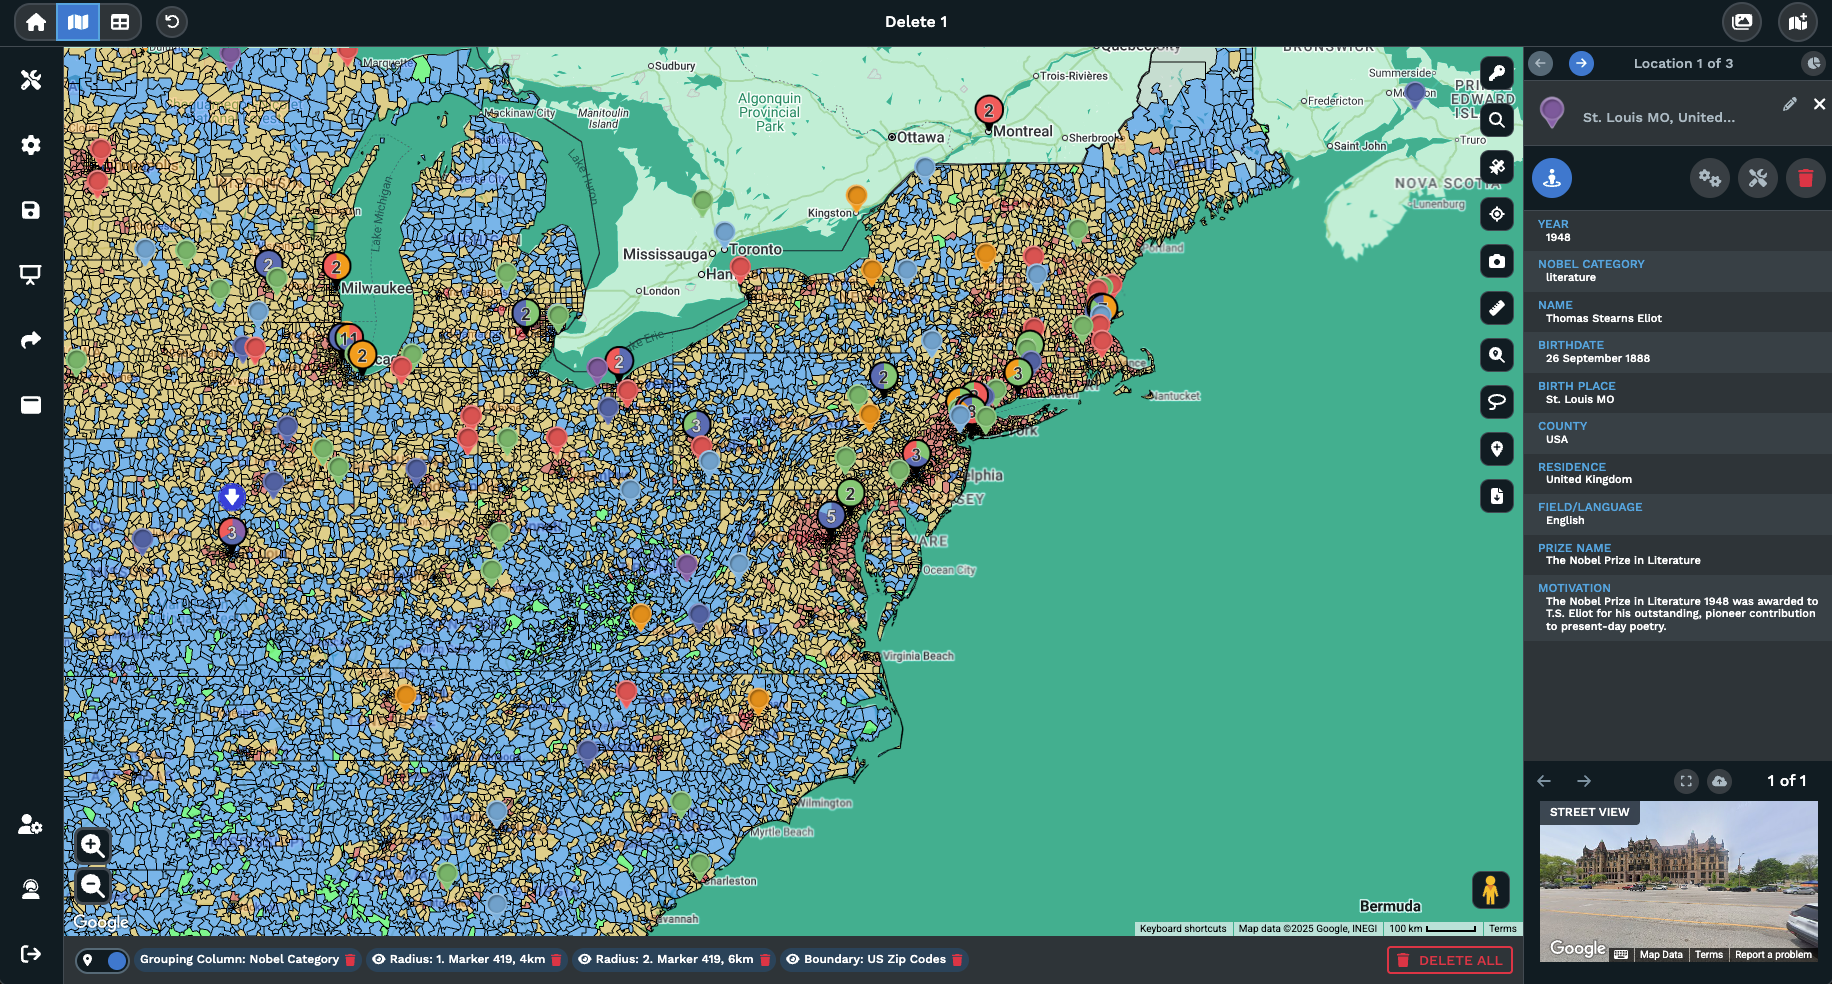
Income Under Any Area
Areas That Match Yours
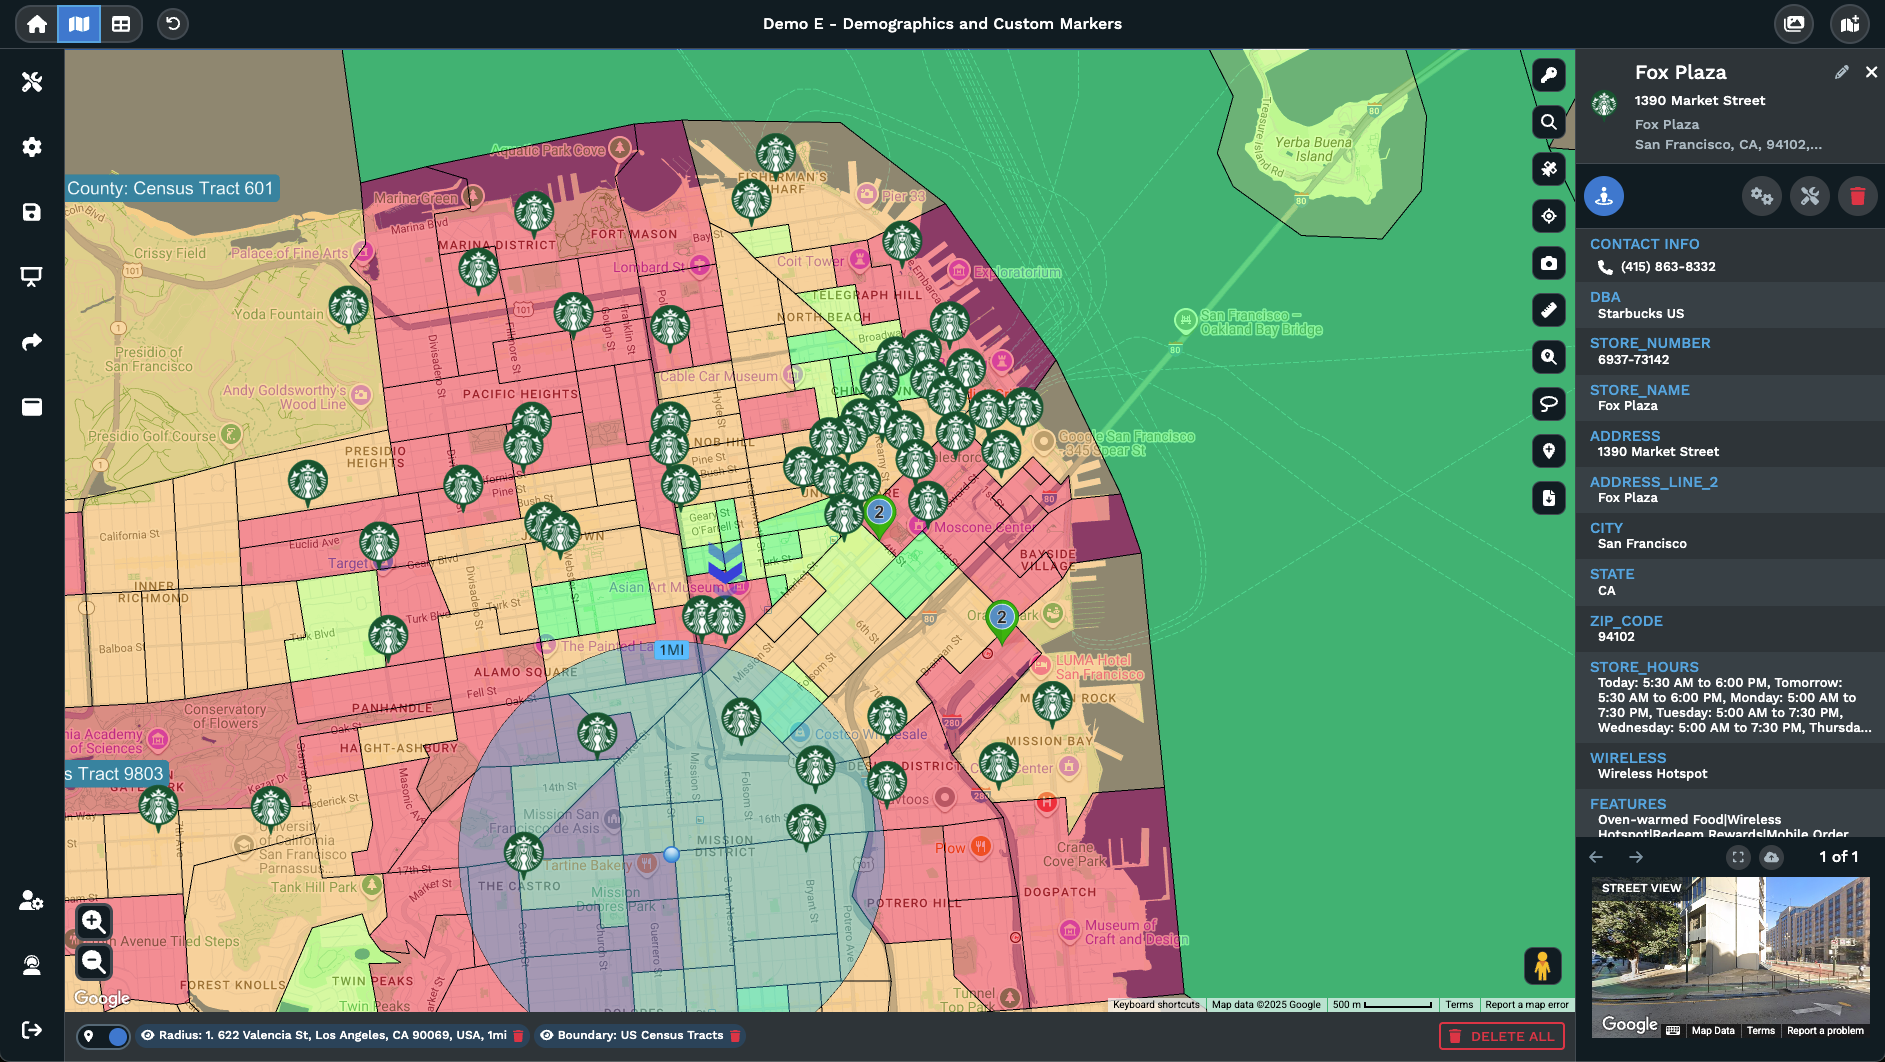
Roll Up a Radius
Age and Household Picks
Validate an Outreach Zone
Brief With a Map
Census Mapping for Site Decisions
Demographic Map Basics
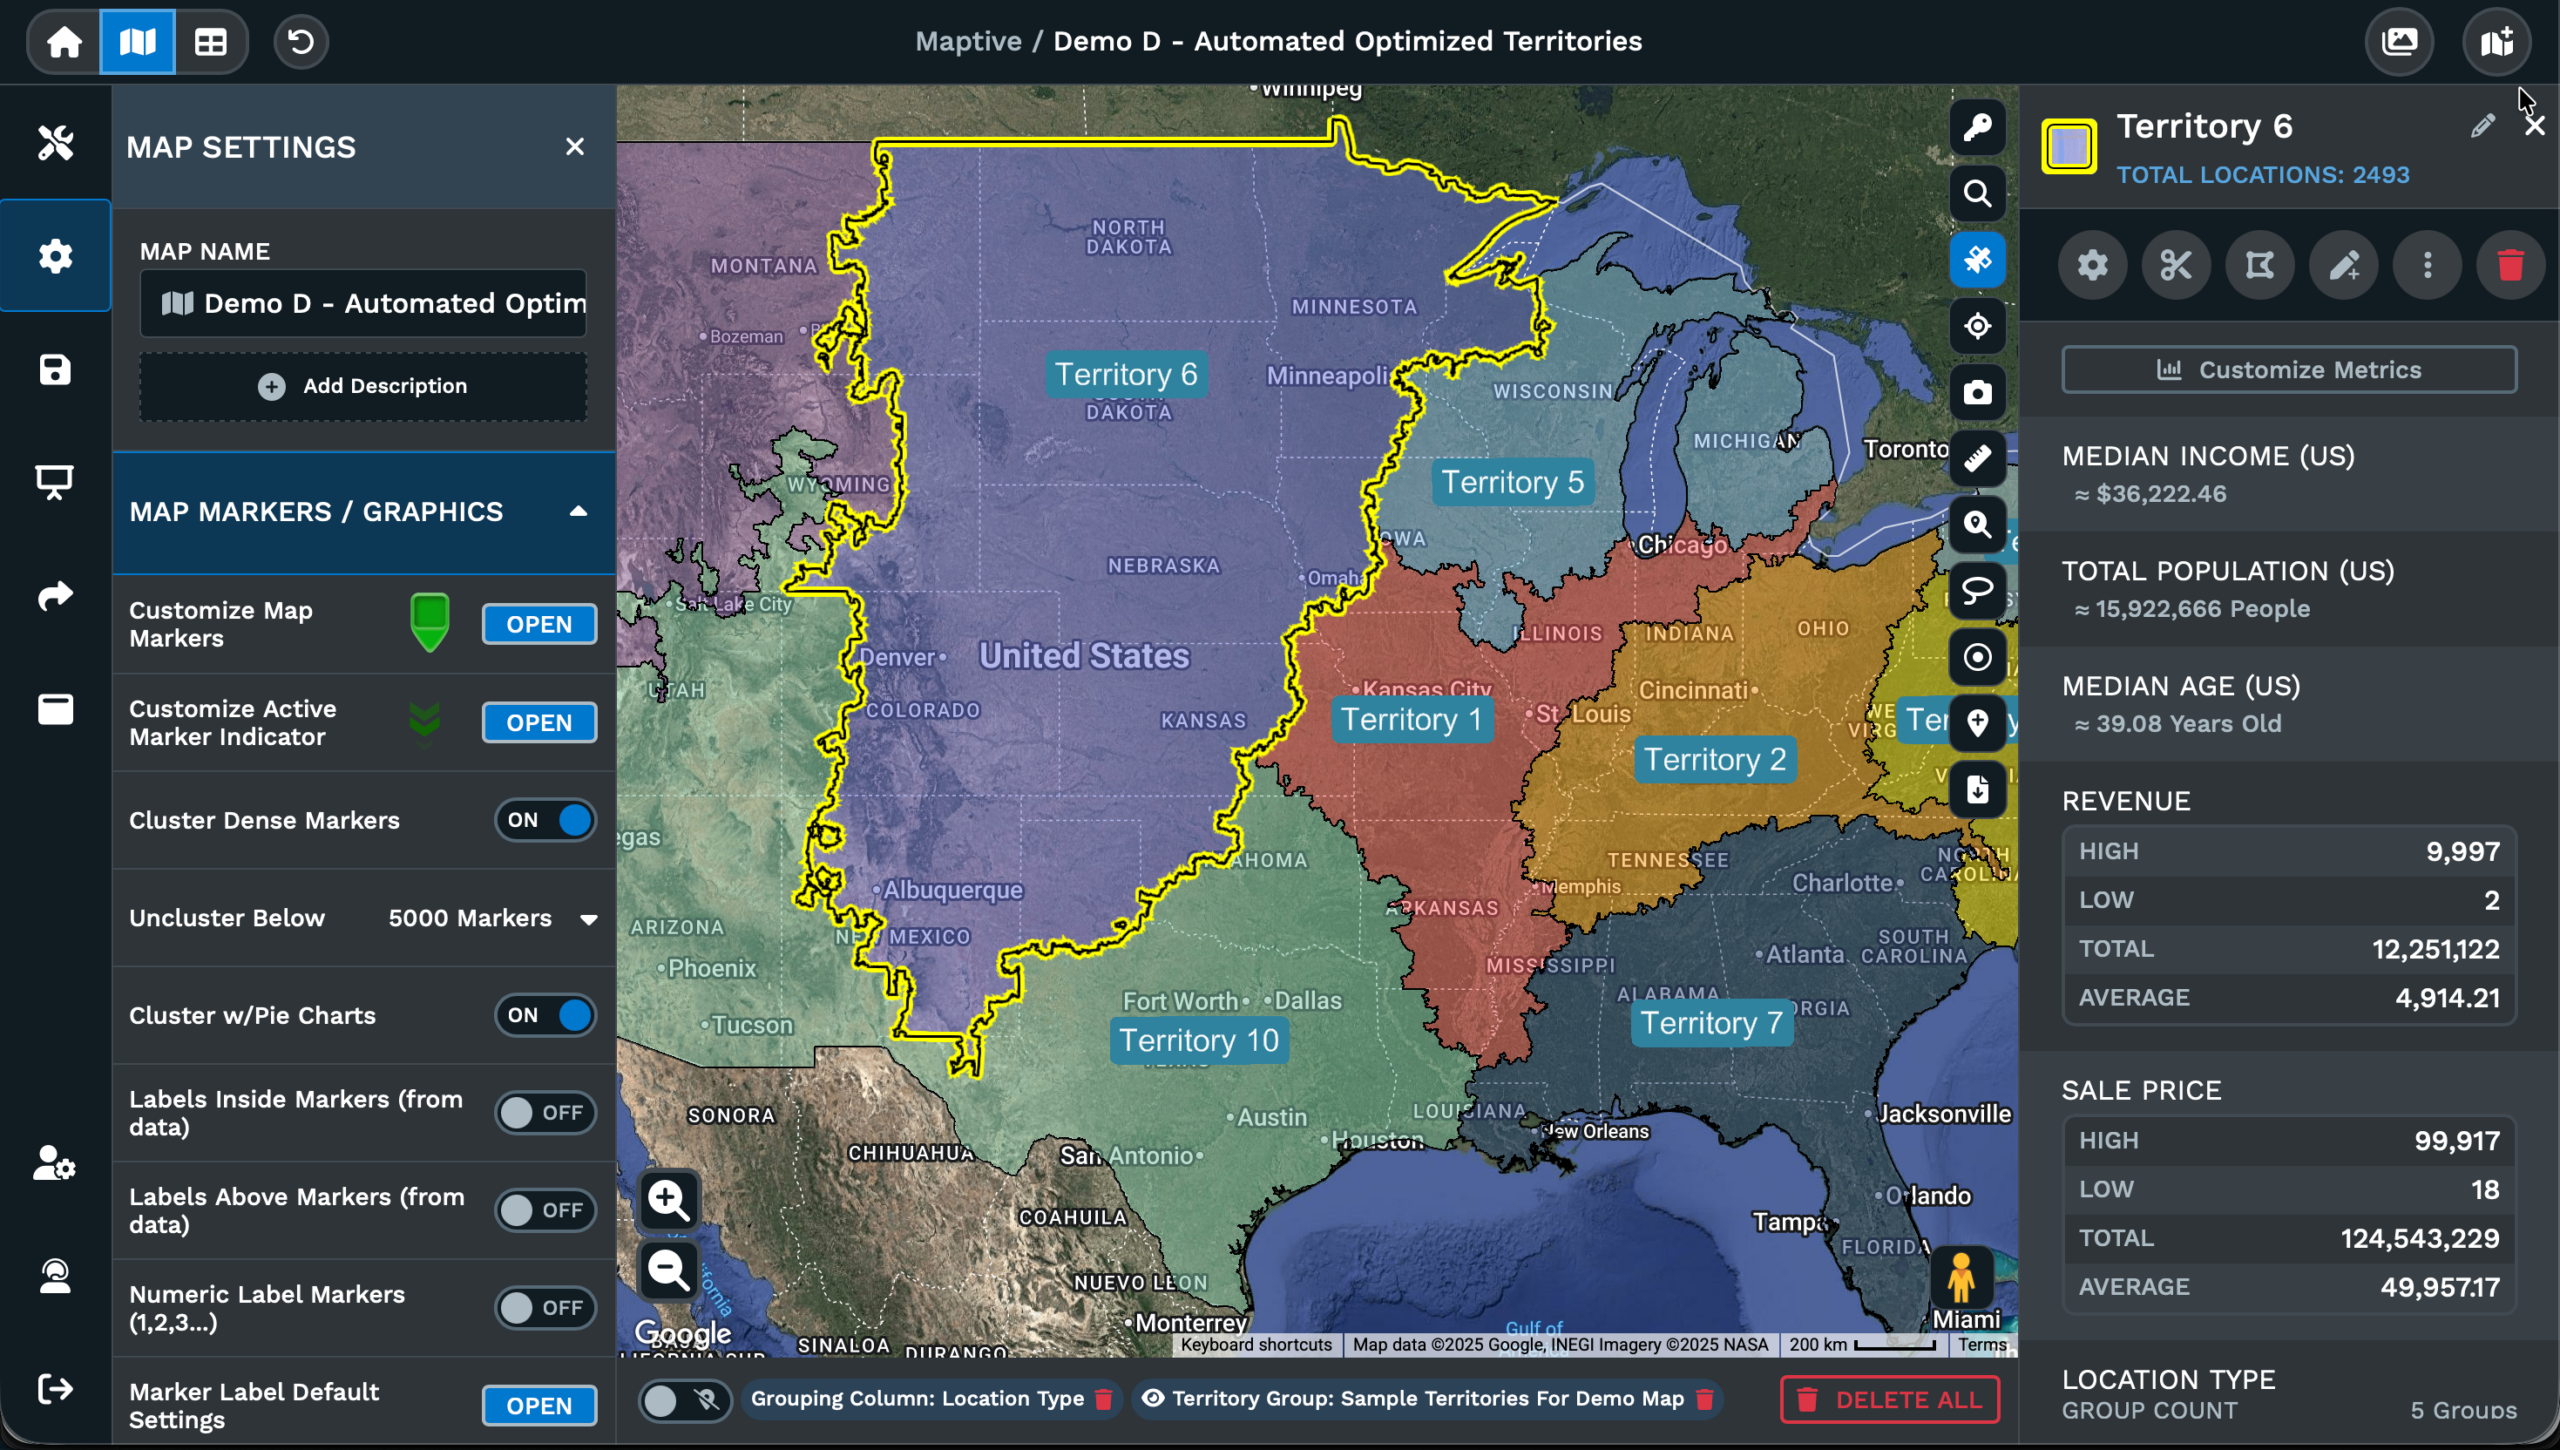
A demographic overlay is a colored layer placed on top of a base map that shades regions by a Census variable. In Maptive the variable is yours to pick inside the Boundary Tool. Choose a boundary set, set the fill type to Demographic Census Data, and you control which demographic group and which metric inside that group ends up coloring the map you are working on for that question.
The fill type sits next to 4 other options on the same Boundary Tool dropdown: No Fill, My Numerical Data, My Group or Territory Data, and Marker Count. Picking Demographic Census Data tells the tool to pull from the Census set rather than from your spreadsheet, so you do not need to import any data to color the map by population, income, age, or another demographic field on the Census list.
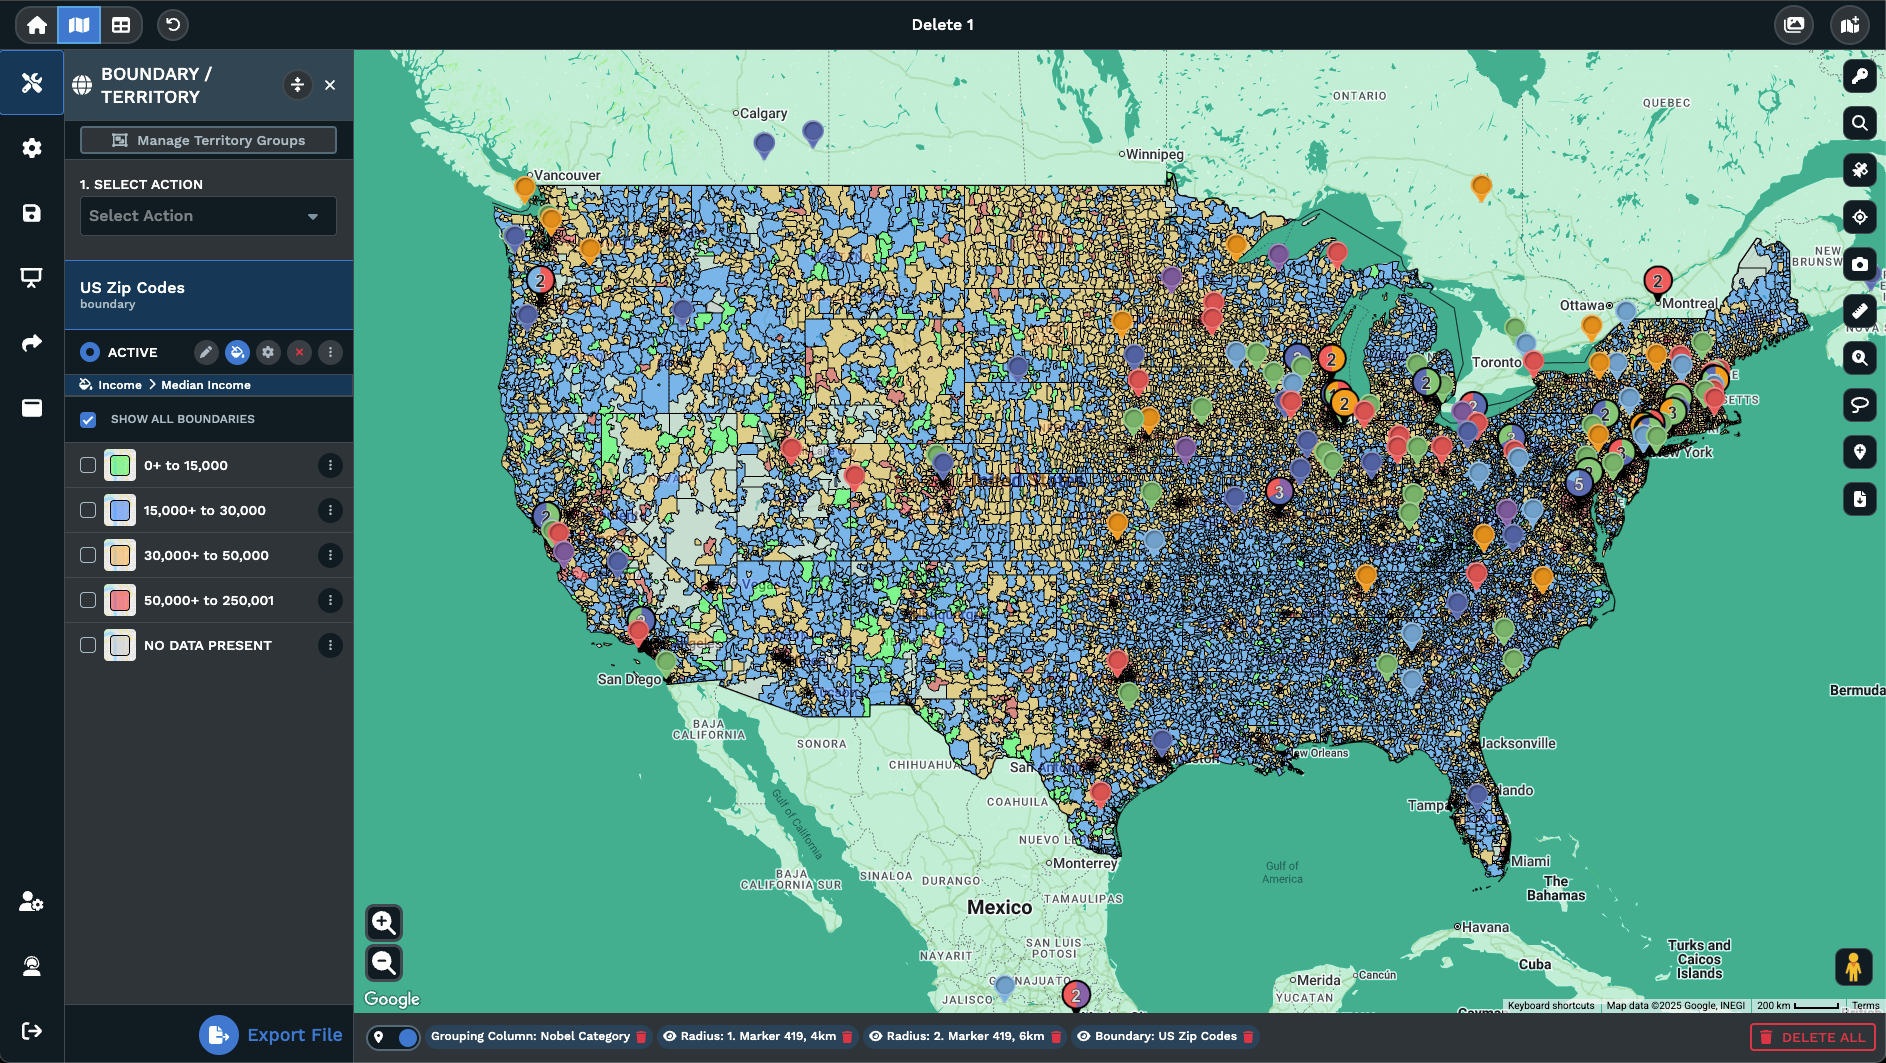
When the fill loads, a key appears showing the numeric ranges that were calculated for the colors, and each region prints its name plus the total for that metric on the label. Fill Settings let you change the number of ranges, switch from value ranges to percentage ranges, and pick the color per range so the map reads the way you want it to read for the audience that you have in front of you for the briefing in the room.
US and Canada Census
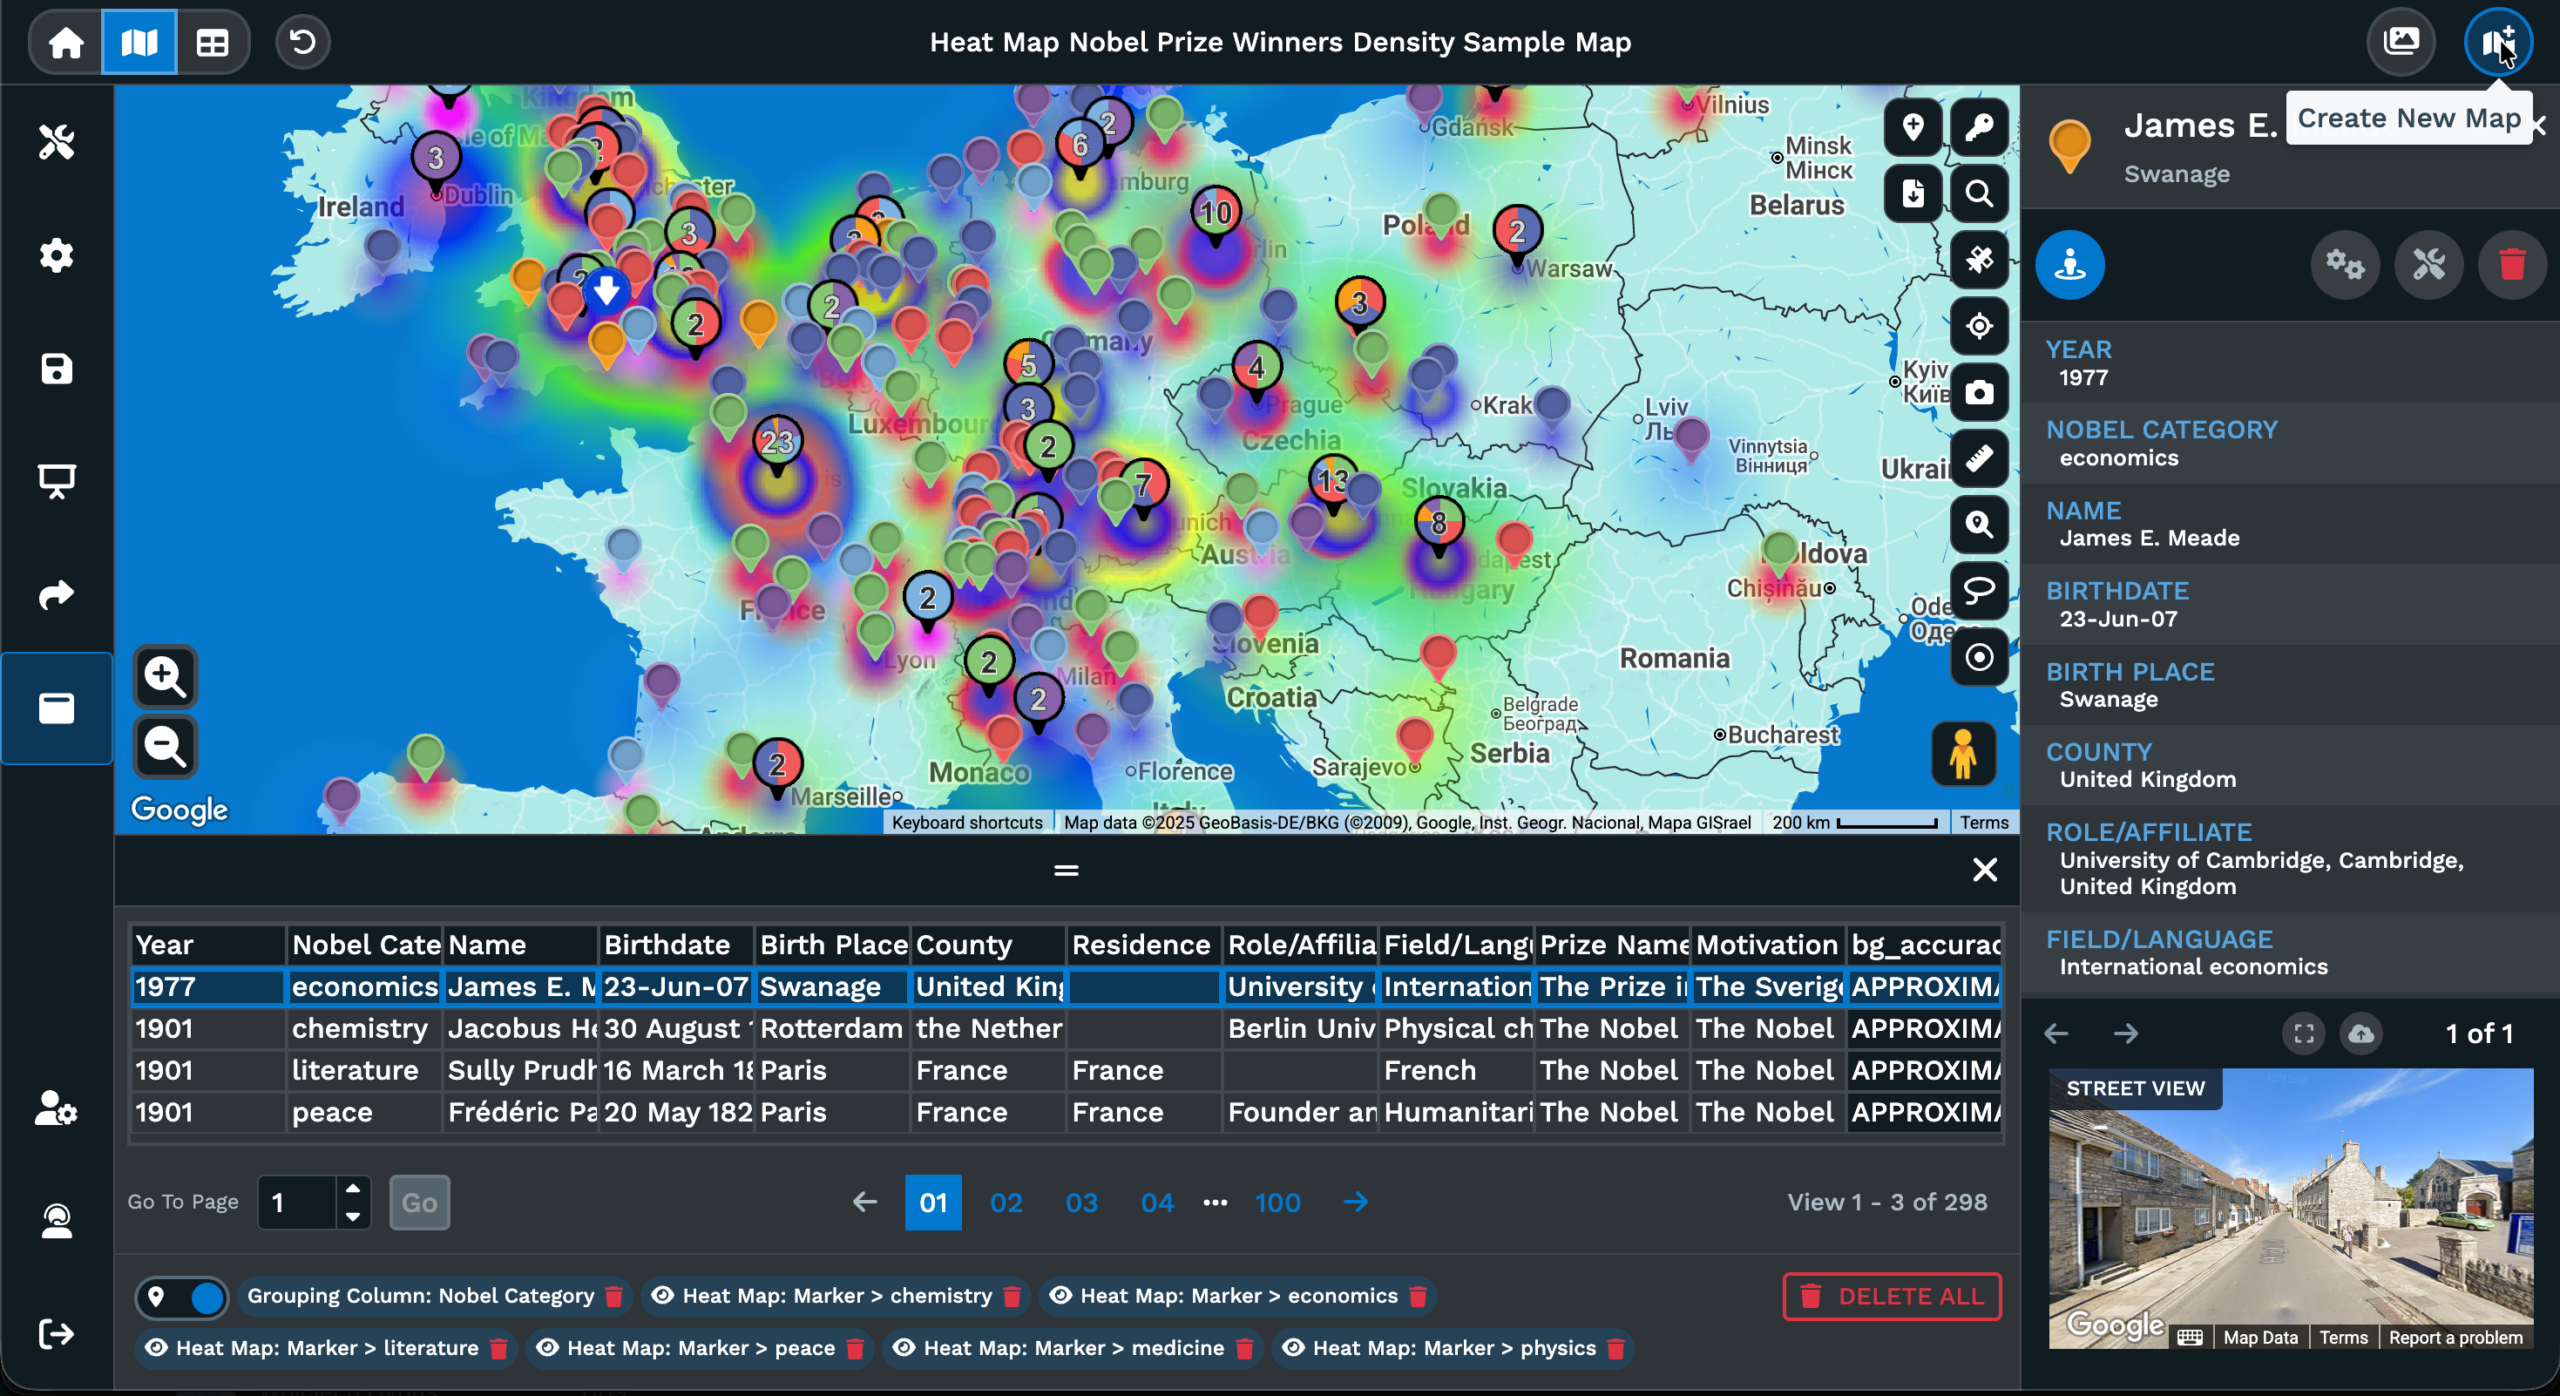
Maptive carries 2 Census sources side by side inside the same product. The doc on the Boundary Tool states the Demographic Census Data fill option only currently exists for boundaries in the US and Canada, so cross-border work runs on the same workflow rather than a second tool. Pick the boundary set for either country, choose Demographic Census Data, and the dropdowns update to the demographic groups available for that region.
The Customize Metrics dialog on the Boundaries, Territories, Radius, and Drive Time Polygon tools carries the same Region toggle. Choice 2 in that dialog is Demographic Data, and Choice 2A is the Region selector with United States and Canada as the 2 values. Choice 2B is the demographic group, and Choice 2C is the demographic field you add to the pop-out for that tool by clicking Add to Proximity Details.
A country outside the US or Canada is not currently covered by the Census fill, and the doc says so on Option 5 of the Boundary Tool. The Boundary Tool can still color a boundary set in another country through My Numerical Data if you have a numeric column in your data to use. The doc points to that path inside the same Option 5 section as a workaround for you.
Inside the Pop-Out
The pop-out on a boundary, drawn territory, radius, or drive time polygon is where the Census numbers actually show up for a single area on the map. Open a region with a click, and the pop-out lists the metrics the tool is currently set to show. Customize Metrics opens a dialog where you build that list, with Spreadsheet Data on the left and Demographic Data on the right side of the dialog.
Inside Demographic Data, the Region dropdown sets US or Canada, the Demographic Group dropdown sets the category, and the Demographic dropdown sets the specific field you want to see in the pop-out. Click Add to Proximity Details to drop each into the pop-out. You can add as many as you want and remove any of them later through the same dialog, and the changes carry across every region of that same tool type.
Labels on the boundaries themselves are controlled by Boundary Settings, in the Boundary Formatting tab inside the popup. Include Name puts the boundary name onto the map, Include Value prints the metric the boundary is colored by, and Custom Value lets you print a different metric than the fill so the label can carry a Census field while the color carries a separate field for the same map view.
FAQs About Demographic Overlays
How do I add demographic data to a map?
Open Map Tools, open the Boundary Tool, and pick the boundary set you want. Set the fill type to Demographic Census Data, then pick the Demographic Group and the Fill Data metric inside that group. Click Load Boundaries and the map shades every region by that metric, with a key showing the ranges and a label on each region carrying the name and the total. You can also add Census fields to the pop-out on a radius or drive time polygon through Customize Metrics inside that tool.
What is a demographic overlay?
A demographic overlay is a colored fill placed onto a base map that shades regions by a Census variable, so the map reads as a picture of population, income, or another demographic field. In Maptive the fill is part of the Boundary Tool fill type list and is called Demographic Census Data. Pick a boundary set, choose Demographic Census Data as the fill, then pick the demographic group and the metric you want. The colored map carries the metric the moment Load Boundaries runs.
How do I see Census data on a map?
Open the Boundary Tool, pick a boundary set for the US or Canada, then choose Demographic Census Data on the fill type dropdown. Pick the Demographic Group and the metric, then click Load Boundaries to color every region by that metric. To read the number for a single region, click on it and the pop-out opens with the totals listed inside. Customize Metrics on that pop-out lets you add more Census fields to the area from the Demographic Data section of the same dialog.
Can I overlay income data on a map?
You can color a boundary set by an income metric if the Demographic Group you pick inside the Boundary Tool carries that metric, and you can add an income field to a radius or drive time polygon pop-out through Customize Metrics. The Demographic Data section of that dialog asks for the Region, the Demographic Group, and the specific field. Click Add to Proximity Details and the income field appears in the pop-out for that area on the map and every other area of the same tool.
How do I find the population in a radius?
Drop a radius around any point with the Distance Radius Tool, then click on the radius to open the pop-out. Click Customize Metrics, then go to the Demographic Data section. Pick the Region, pick the Demographic Group, and pick the population field as the specific demographic. Click Add to Proximity Details and the population total appears in the pop-out for that radius. The same workflow runs on a drive time polygon, a boundary, or a drawn territory through the same Customize Metrics dialog.
Does the demographic fill cover countries other than the US and Canada?
The Boundary Tool doc says the Demographic Census Data fill option only currently exists for boundaries in the US and Canada. A boundary set in another country can still be colored by a numeric variable through the My Numerical Data fill option if you have a numeric column in your own data to point at. The doc points to that option as the path for non-US, non-Canada boundary coloring. The Demographic Data dropdowns in Customize Metrics also list the United States and Canada as the available Region values.
Can I show more than 1 Census metric on the same map?
You can add more than 1 fill to the same boundary set. The doc gives 2 paths: add a new fill the same way you added the first fill with the same boundary set picked, or open Fill Settings on the active set and click Add More Fills. Only 1 fill displays at a time, and an active-fill indicator shows the number of the active fill on screen. Click the indicator to switch the active fill without redrawing the boundary set on the map.
How do I label the regions with the metric?
Open Boundary Settings on the boundary set and stay in the Boundary Formatting tab. The lower section of the popup controls the label. Toggle Include Name to print the region name, Include Value to print the metric the boundary is colored by, and Include Legend to print the metric name in the label. Use Custom Value if you want the label to carry a different field than the color carries. Background Color and Font Color on the same popup control how the label sits on the map.
Can the Census data ignore the marker filters I apply?
Yes. Boundary Settings on the active boundary set carries an Ignore Filters toggle. When a fill is colored by your spreadsheet data the colors normally update as you filter markers on the map. Turn Ignore Filters on and the fill stays constant regardless of which filters or searches you run on the markers. The toggle sits with the other Boundary Options like Line Width, Combine Groups, Hide Areas W/O data, and Disable Boundary Hover and Click on the same Boundary Formatting tab of the popup.
How do I remove a Census fill I no longer need?
Open Fill Settings on the boundary set and click Customize Fills in the submenu, and a modal opens with the fills you have on that set. Pick the fill you want gone and click the red garbage can icon next to it. The fill comes off the map without removing the rest of the boundary set or the other fills you stacked on it. The remaining fills stay, and the active-fill indicator shifts to a fill still on the set.