


Map Provider Density & Count Facilities in a Radius
How many hospitals sit within 25 miles of this site, and where does the market get crowded? Maptive counts competing or target facilities inside any radius and shades a market by how many fall in each ZIP code or county.
No credit card required
- Upload a facility list, drop a radius around a site, and read the count of hospitals, clinics, or dealers inside it.
- Set the ring anywhere from 20 to 60 miles and resize it to test a wider or tighter trade area.
- Draw one radius around every site at once with Apply To Group, so each location keeps its own count.
- Shade ZIP codes or counties by how many facilities land in each one for a market-wide density read.
- Add a heat map for a smooth concentration view that shows where providers cluster and where they thin out.
- Find the nearest facilities to any point, then export the rows inside a ring for a workbook or report.
Trusted by teams at









Size Up Every Market Before You Commit
It has saved me hundreds of hours across account-manager territories and warehouse routing, and it is easy to use.
Counting Facilities in Maptive
-
1
Plot the Facility List
Upload your facility list from Excel, CSV, or a Google Sheet, or paste it in. Maptive geocodes the addresses and corrects messy entries or missing ZIP codes, so hospitals, clinics, or dealers land on the map without GIS skills or code. Group the markers by type with the Grouping Tool if you want competitors in one color and your own sites in another.
-
2
Drop a Radius and Read the Count
In Map Tools, open Distance Radius Circles and center a ring on a site by typing an address, clicking the map, or picking a marker. Set Proximity Within to the size you want, from 20 to 60 miles, and click Add Proximity Radius. To count facilities inside, click the ring and open Customize Metrics, then choose Spreadsheet Data and Group Count. The pop-out returns how many rows fall in the circle.
-
3
Ring Every Site at Once
To answer the same question for a whole portfolio, set the radius to Apply To Group and pick the group column value. Maptive draws a ring of the same size around every marker in that group, and each one reads its own count through Customize Metrics. This turns a one-site check into a portfolio-wide density read without redrawing a single circle.
-
4
Shade the Market by Density
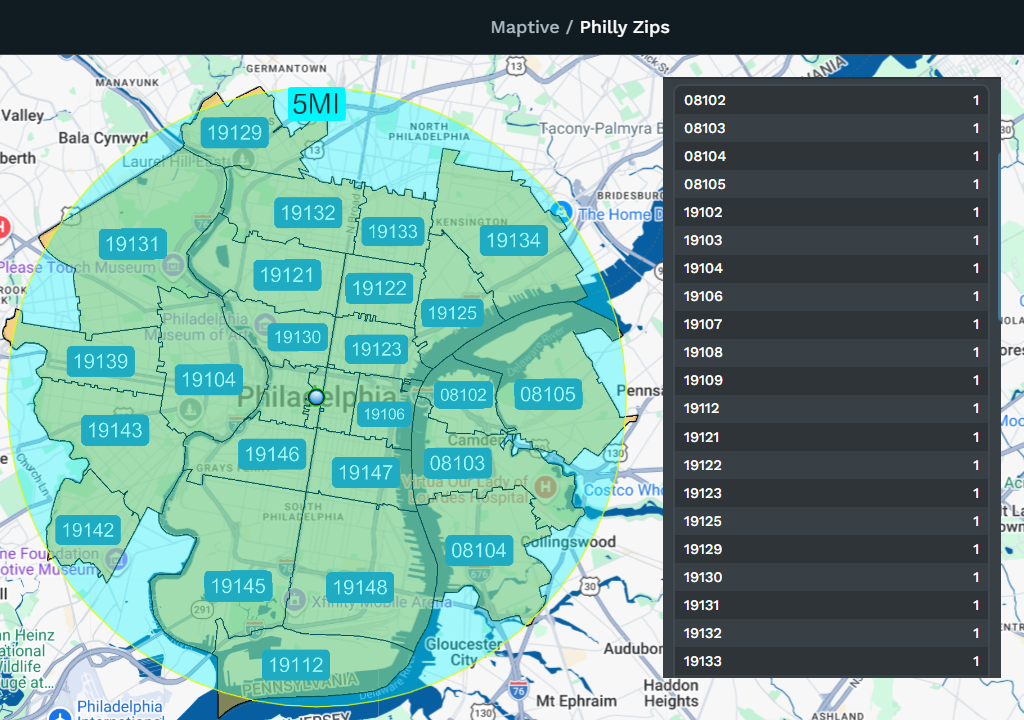
For a market-wide view, open the Boundary Tool, pick a boundary set like ZIP Codes or Counties, and set the fill type to Marker Count / Location Density. Click Load Boundaries and each region colors by how many facilities land inside it, with a key of numeric ranges and the total printed on each area. Add a heat map by marker density for a smooth concentration layer on top.
Try It on Your Own Facility List
Start the 10-day free trial with no credit card and every tool unlocked. Upload your facility list, drop a radius on a site, and read the count of providers inside it in minutes. Want a hand? A Maptive specialist will build the first density map alongside you and set the rings to the trade area you care about.
No credit card required
Frequently Asked Questions
How many hospitals are within 25 miles of this site?
Center a Distance Radius on the site by typing its address or clicking the map, set Proximity Within to 25 miles, and add the ring. Click it and open Customize Metrics, choose Spreadsheet Data, and pick Group Count to read how many hospitals from your uploaded list fall inside. The number appears in the pop-out and updates as you resize or move the circle. Swap the radius to 20 or 60 miles to test a tighter or wider trade area, and the count follows the ring.
How do I visualize provider density in a market?
Two views cover it. The Boundary Tool fills ZIP codes or counties by a Marker Count / Location Density fill, so every region colors by how many providers land inside it, with a numeric key and the total on each area. For a smoother read, the Heat Mapping Tool by marker density puts a concentration gradient over the points, so clusters run hot and sparse areas run cold. Use the boundary fill to count by region and the heat map to see the shape of the market at a glance.
Can I count competing facilities inside a radius?
Yes. Drop a Distance Radius around any site, then click the ring and open Customize Metrics. Under Spreadsheet Data, pick Group Count and Maptive returns how many rows from your facility list fall inside the circle. If you color competitors and your own locations into separate groups with the Grouping Tool first, you can read each group's count against the same ring. The total recalculates whenever you resize the radius, so testing a 30-mile versus a 45-mile market takes one drag.
How do I count facilities around every location at once?
Set the Distance Radius to Apply To Group instead of Individual Location, then pick the group-column value that holds your sites. Maptive draws a ring of the same size around every marker in that group, and each ring keeps its own count through Customize Metrics and Group Count. This answers a portfolio-wide question in one step, so you compare how many competitors surround each store or clinic without drawing circles one at a time. Adjust the radius once and every ring resizes together.
Can I shade ZIP codes or counties by how many facilities fall inside?
Yes. Open the Boundary Tool, choose a boundary set such as ZIP Codes or Counties, and set the fill type to Marker Count / Location Density. Click Load Boundaries and each region colors by the number of facilities that land in it, with a color key of ranges and the count printed on each area. Fill Settings let you set the number of ranges, switch value ranges to percentage ranges, and pick a color per range, so saturated markets read darker and open ones read lighter.
What is the difference between a heat map and a boundary count?
A boundary count assigns an exact number to each ZIP code or county, so you read how many facilities sit in a defined region and compare regions directly. A heat map draws a smooth density gradient over the individual points, so it shows where providers concentrate without snapping to region lines. Use the boundary fill when you need a hard count per area for a report, and the heat map when you want the overall shape of the market, the clusters, and the gaps at a glance.
Can I find the nearest facilities to a candidate site?
Yes. The Location Finder ranks the facilities on your map by distance from a point you pick, so you see the closest hospitals, clinics, or dealers to a candidate site in order. This pairs with the radius count when you need both the total inside a ring and the specific nearest providers by name. Together they answer how crowded a market is and which competitors sit right next door, from one uploaded list.
How do I export the facilities inside a radius?
Click the radius and use its menu to Export Locations, or use Export File to pull every ring at once. Maptive sends the rows inside the circle to .xlsx, .tsv, .csv, or the clipboard, and you choose straight-line or driving distance, markers inside or outside the ring, and a closest-circle option when rings overlap. This hands you a clean workbook of the competing or target facilities in a market, ready for a site report.
How many facilities can I map at once?
Maptive holds up to 200,000 markers on a single map, so a full national facility list plots without splitting into batches. Geocoding fixes messy addresses and fills missing ZIP codes as the file loads, so the count you read from any ring or region covers the whole list. Large maps stay responsive because Maptive draws them on a WebGL layer, which keeps panning and zooming smooth even with tens of thousands of hospitals or dealers on one view.
Can I compare facility density across several markets?
Yes. Shade every ZIP code or county by a Marker Count fill and the color key ranks each market by how many facilities fall inside, so saturated and open areas read at a glance. To compare specific sites, ring each one with Apply To Group and read the counts side by side. Export the boundary totals or the radius rows to a workbook when you need the numbers next to each other, so a market-saturation review runs from one map.








