


Overlay Census Demographics on Your Customer Map
Looking at a customer list and wondering who lives around them? Maptive colors any U.S. or Canada map by the census metric you pick, then reads the totals back from inside any region, radius, or drive-time area.
No credit card required
- Upload your accounts, then shade ZIP codes, counties, or states by a census metric around them.
- Read median household income, population, age, or household detail on every region.
- Click any area, radius, or drive-time ring to pull the census totals inside it.
- Choose from more than 50 census variables at five levels, down to the block group.
- Stack two metrics on the same map and switch between them without redrawing.
- Cover the U.S. and Canada in the same workflow, with no GIS skills.
Trusted by teams at









See the Market Behind Your Accounts
True insight into our data is vital to our success, and Maptive gives us exactly that.
Building It in Maptive
-
1
Open the Boundary Tool
In Map Tools, open the Boundary Tool and pick the boundary set you want, from US States and counties to ZIP codes or census tracts.
-
2
Choose the Census Fill
Set the fill type to Demographic Census Data, then pick the demographic group and the metric inside it, like median household income or population. Click Load Boundaries and every region colors by that number.
-
3
Read the Numbers in the Pop-Out
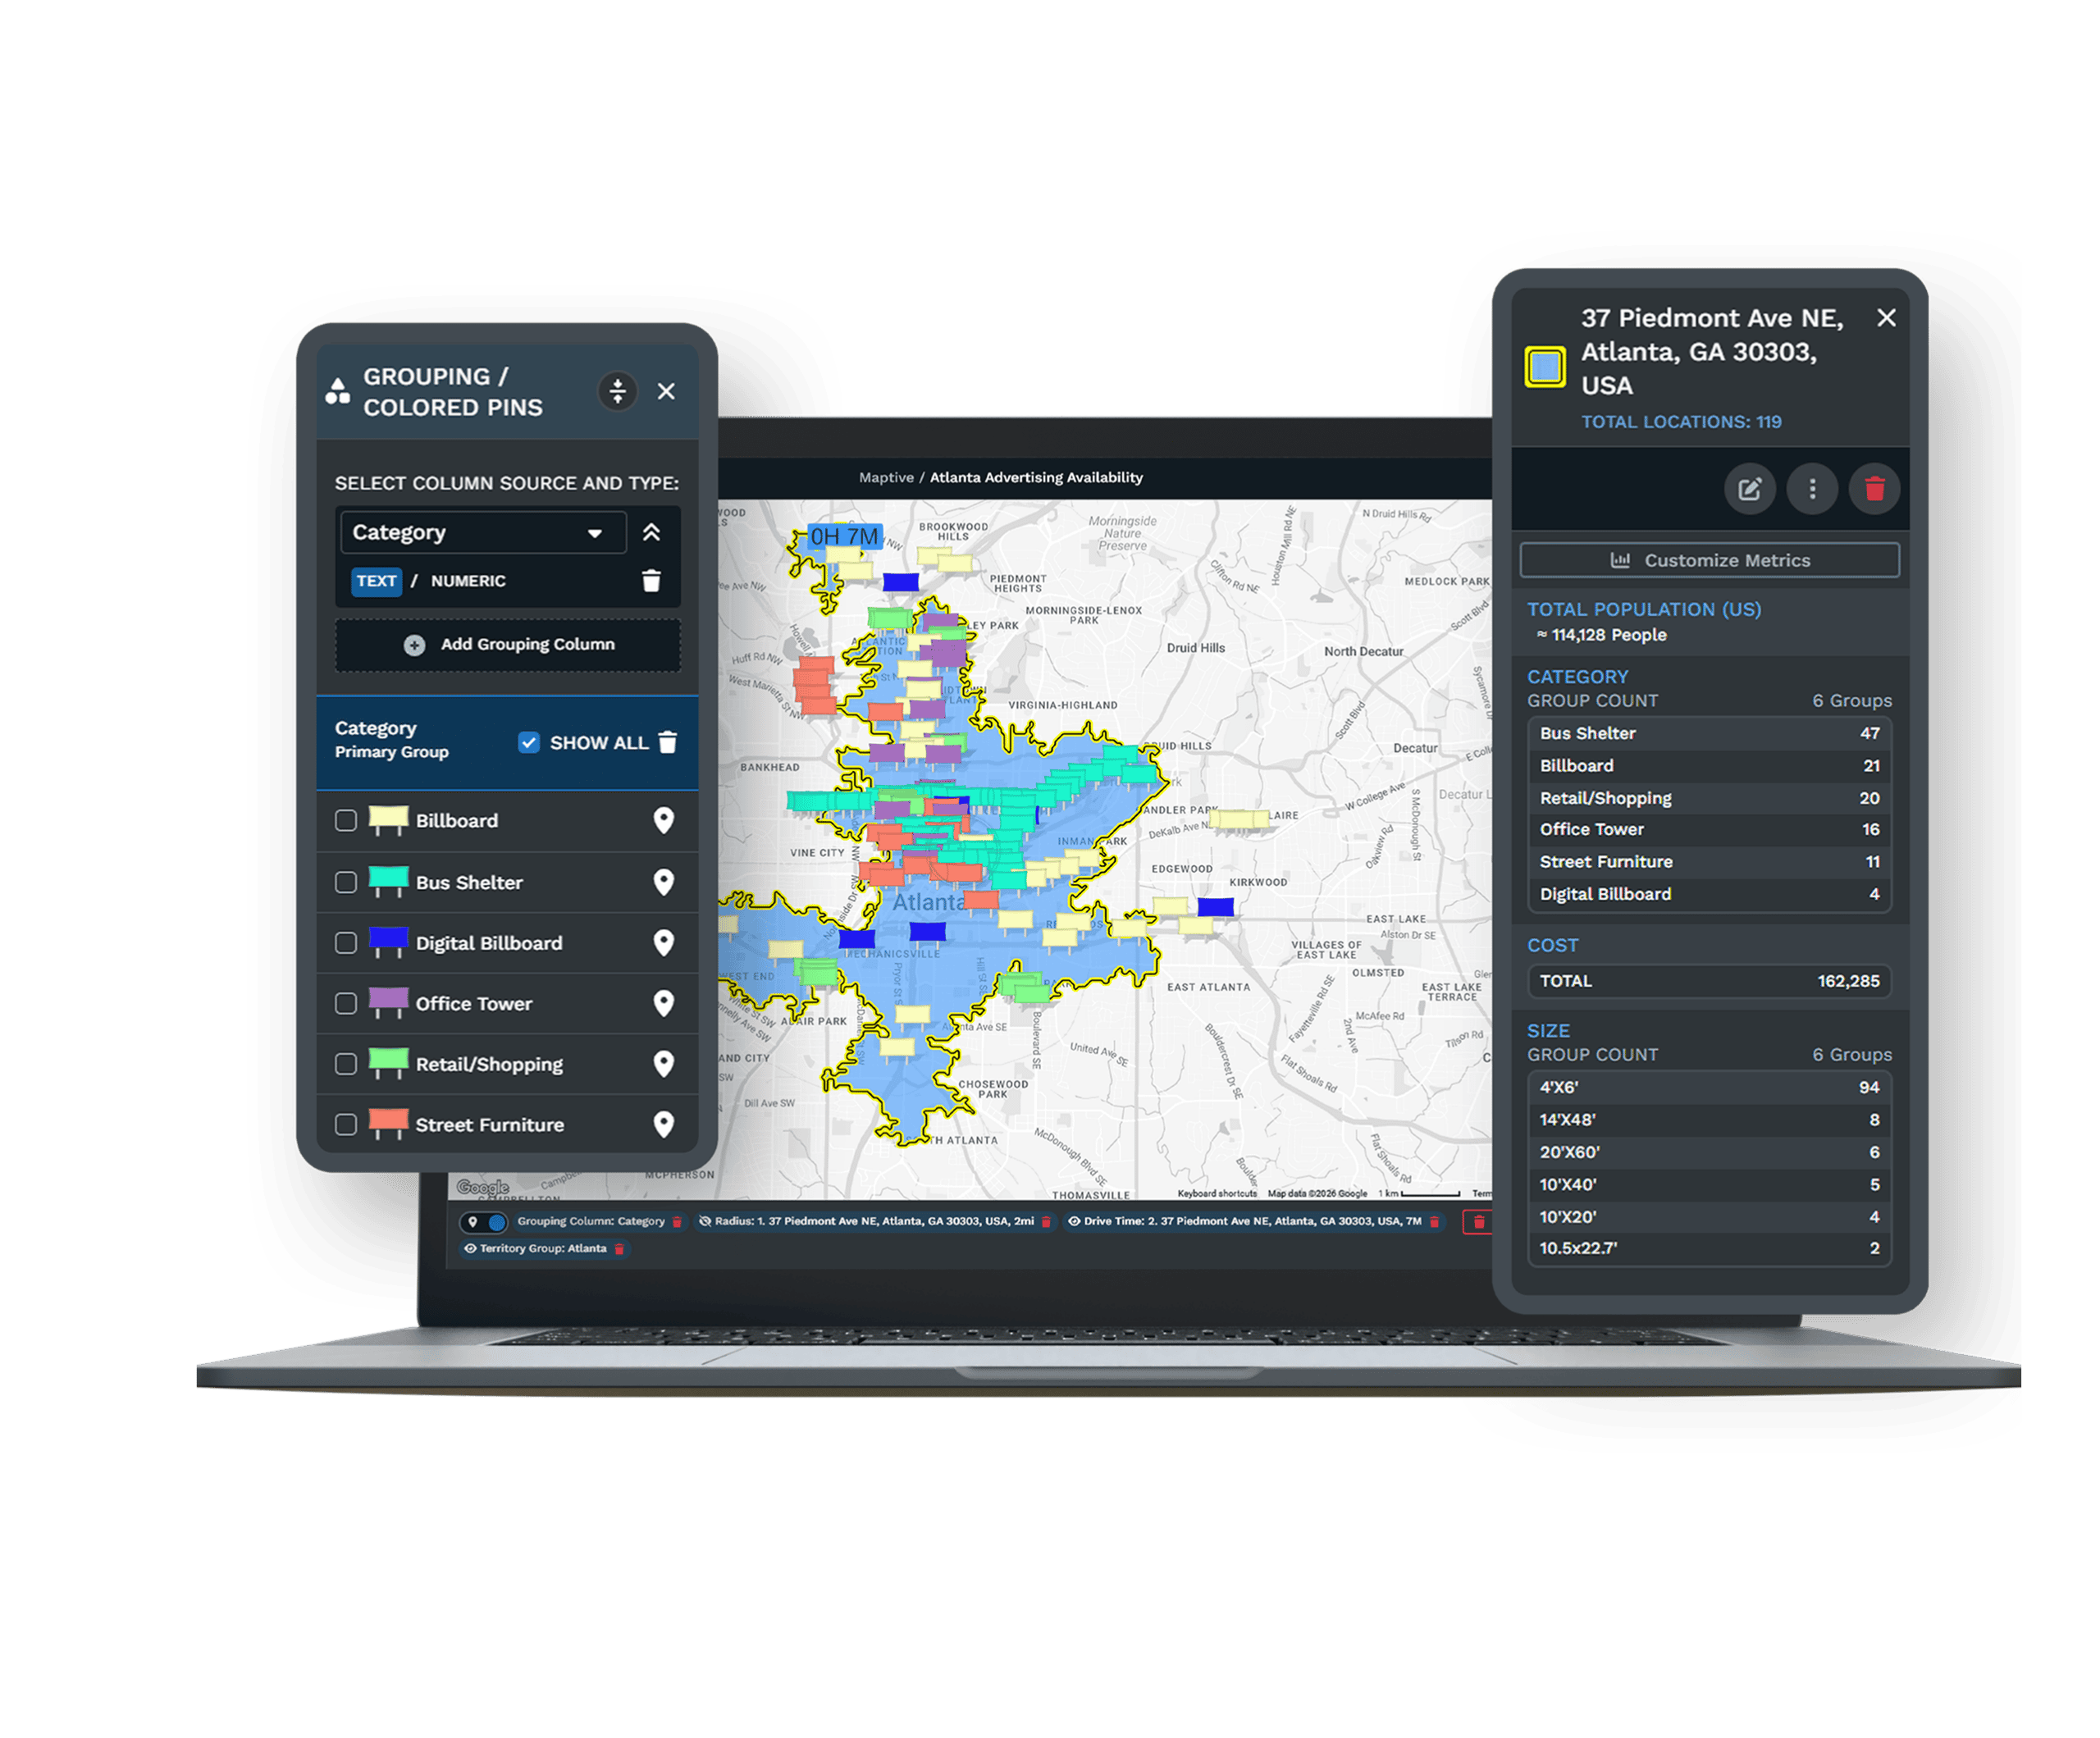
Click any region, radius, or drive-time polygon, and the pop-out lists the census totals for that area. Customize Metrics lets you add more fields, from age to household composition, to the same pop-out.
-
4
Tune the Ranges and Labels
Fill Settings change the number of ranges, switch value ranges to percentages, and set the color per range. Turn on Include Value or Include Legend so each region prints its number on the map.
See the Data Around Your Customers
Start the 10-day free trial with no credit card. Upload your account list, open the Boundary Tool, and shade your market by income or age on your own data. Want a hand? A Maptive specialist will build the first demographic map with you.
No credit card required
Frequently Asked Questions
How do I add demographic data to my customer map?
Upload your customer list, then open the Boundary Tool and pick a boundary set, such as ZIP codes or counties. Set the fill type to Demographic Census Data, choose a demographic group, and pick the metric you want, like median household income or population. Click Load Boundaries and the map shades every region by that number, with a color key of ranges and the total printed on each area. Your accounts stay on top, so you read the demographics right around them. Nothing installs, and more than 50 census variables come with every plan.
Can I see income by ZIP around my accounts?
Yes. Shade ZIP codes by median household income through the Boundary Tool, then plot your accounts on top so you see the income around each one. To read a single area, click the ZIP and the pop-out lists the income and any other census fields you added through Customize Metrics. You can also drop a radius or a drive-time ring around an account and pull the income and population inside it. That makes it easy to tell which customers are in higher-income areas and which markets look most like your best ones.
What census data does Maptive include?
Maptive includes more than 50 U.S. Census variables, covering median household income, population density, age, and household composition, at five levels from state and county down to ZIP code, census tract, and block group. The data comes from official government sources and is included on every plan at no extra cost. Canadian census data works the same way. A growing library of market data, drawn from a long-standing data partnership, adds spending and household detail alongside the census figures, so you read each account against the market around it rather than in isolation.
Can I shade ZIP codes or counties by demographics?
Yes. The Boundary Tool fills ZIP codes, counties, states, tracts, or block groups by the census metric you choose, which turns a plain map into a color-shaded read of your market. Fill Settings let you set the number of ranges, switch from value ranges to percentage ranges, and pick the color for each range, so the areas that matter are easy to see. You can also print the number on each region with Include Value, and the legend with Include Legend, so the map reads on its own without the side panel open.
What geographic levels can I view demographics at?
Maptive reads census data at five levels, from state and county down to ZIP code, census tract, and block group. Start wide to compare regions, then zoom to tract or block-group level to see how one neighborhood differs from the next. Working at the right level keeps a national view readable and a local one detailed. The same demographic fill works at every level, so you change the boundary set without changing the steps you follow to color it.
Can I pull demographics inside a radius or drive-time area?
Yes. Draw a radius ring or a drive-time polygon around any address, click it, and open Customize Metrics in the pop-out. Under Demographic Data, set the region to the U.S. or Canada, pick the demographic group, and add the fields you want, like population and households. The totals appear in the pop-out and update as you move or resize the area. This gives you fast market sizing around a customer, a store, or a candidate site, without pulling a separate census table or leaving the map.
Do I need GIS skills to overlay census data?
No. The demographic fill is a menu choice in the Boundary Tool, so you add census data without GIS training or code. You pick a boundary set, choose Demographic Census Data as the fill, and select a metric, and the map shades itself. Reading a single area is one click, and Customize Metrics builds the pop-out from dropdowns. Most people have demographics on their map in their first session, and the US and Canada support team helps set up the first layer if you get stuck.
Can I show more than one demographic metric on the same map?
Yes. You can stack two or more census fills on the same boundary set, then switch the active one through the fill indicator without redrawing the map underneath. Only one fill shows at a time, so the map stays readable while you compare income against population for the same regions. You can also show one metric in the color and print a different one on the label with Custom Value, so a single map view shows two numbers per region at once.
Does Maptive have Canadian demographic data?
Yes. Alongside U.S. Census data, Maptive also has Canadian government demographics in the same product. In the Boundary Tool and in Customize Metrics, a region toggle switches the source between the United States and Canada, so a team that sells on both sides of the border works from one map instead of a separate file for each country. The demographic fill covers U.S. and Canadian boundaries, and a boundary set in another country can still be colored by a numeric column from your own data.
Can I overlay my own data alongside census data?
Yes. The Boundary Tool can fill regions by your own numbers, like sales or membership, as well as by census data, so you shade the map by performance one moment and by demand the next. Reading the two together shows where your results line up with the market and where a high-income or high-density area has little coverage. Because filtering your markers can change a fill colored by your own data, an Ignore Filters toggle holds that fill steady while you filter the points on top.
How current is the census data?
The demographic data comes from the U.S. Census Bureau and Statistics Canada and is built into the platform, so you map the official published figures without importing or updating anything yourself. Because the data is built in rather than sitting in your file, every map and every shared view reads from the same source. A map you shared last week shows the same official figures when a colleague opens the link today, rather than a stale export.








