


Export a Presentation-Ready Map for PowerPoint or PDF
Need a clean map you can copy and paste into PowerPoint for the board without the software clutter around it? Maptive builds the map from your data, strips the interface, and exports a branded PNG or PDF you drop straight into a slide.
No credit card required
- Export any map as a PNG or PDF, up to a 2048 by 2048 poster size for large slides and handouts.
- Draw crisp county, state, or ZIP outlines with the Boundary Tool set to No Fill.
- Match the deck with custom range colors, brand-colored markers, and your own logo pins.
- Print names, values, and a legend right on the map, so a slide explains itself without a side panel.
- Hide the toolbar and interface for a screenshot-ready view.
- Prefer interactive? Share a password-protected link or embed the live map instead of an image.
Trusted by teams at









Give the Board a Map It Can Read
Excellent geo-data front end tool for presentations and business visualization.
Building the Slide in Maptive
-
1
Outline the Regions With No Fill
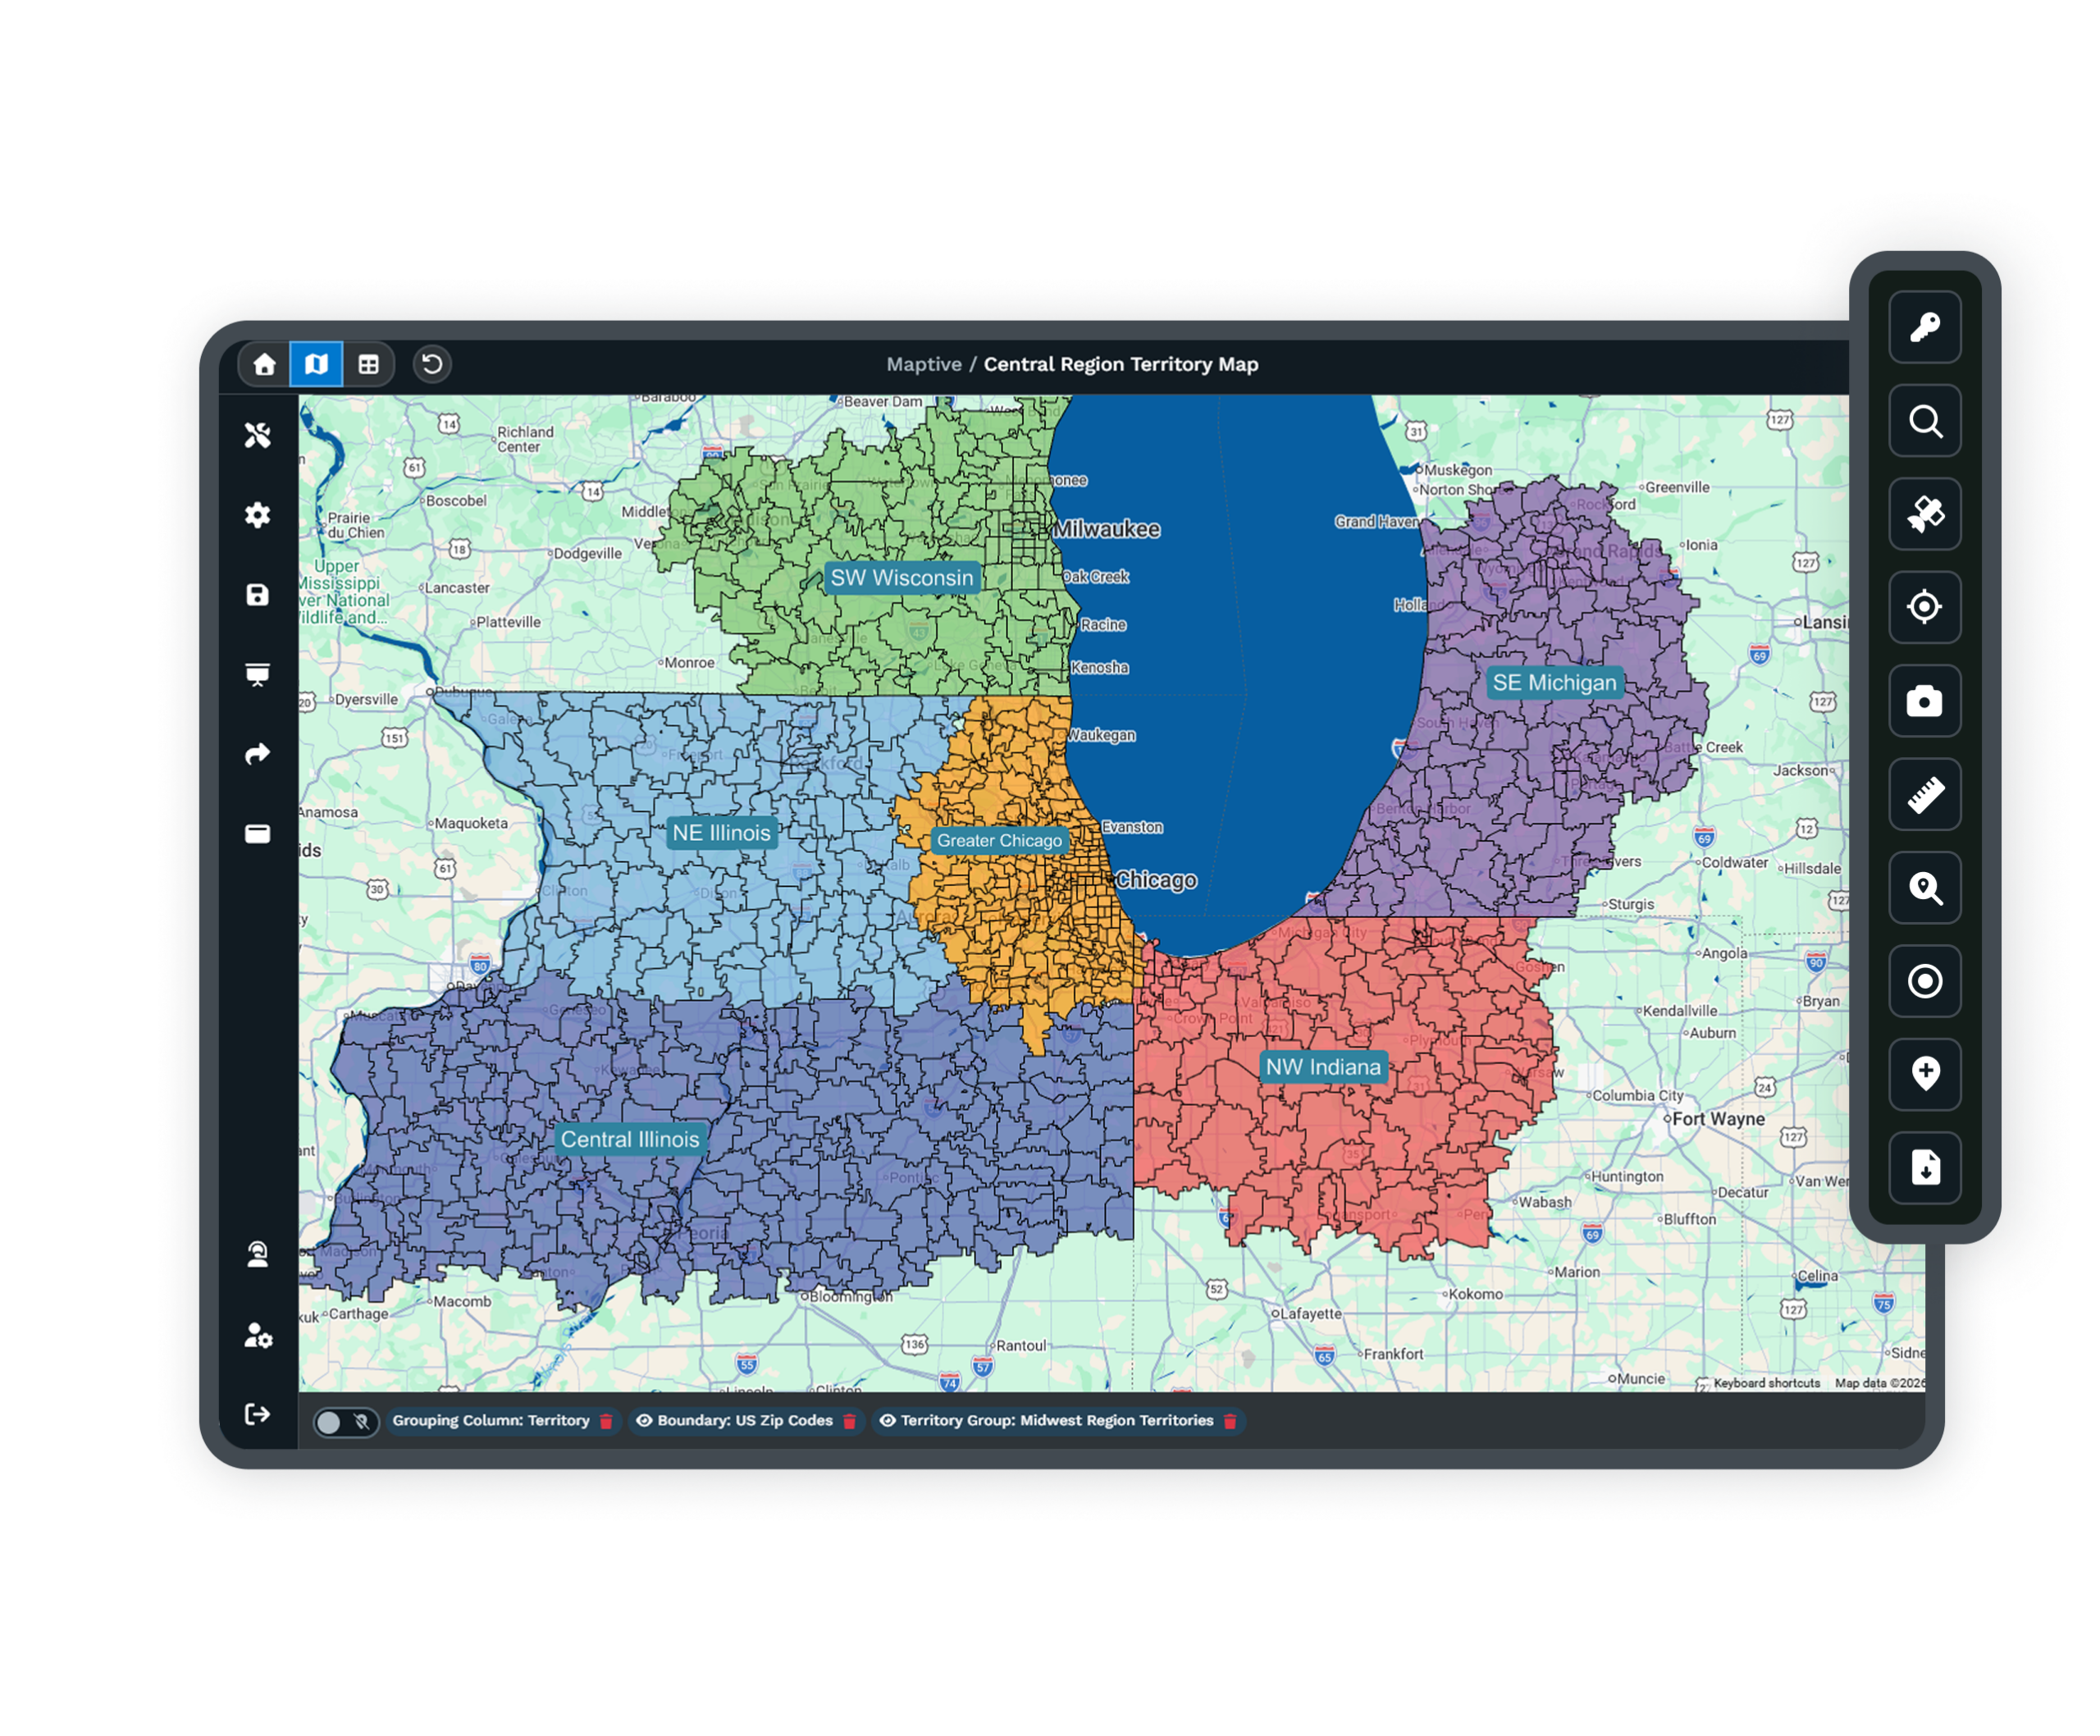
In Map Tools, open the Boundary Tool and pick your boundary set, from US States and counties to ZIP codes. Choose the No Fill type for clean outlines, or hand-color regions to build territories. In Boundary Formatting, set the line width and line color so the borders read at slide size, and turn on Hide Areas W/O Data to drop empty regions.
-
2
Color and Brand the Markers
Open the Grouping Tool to color-code your points by a category or a value range, which builds the legend the board will read. Set each group's color to match the deck. To carry the brand further, open Custom Markers and upload your own logo or pin images, or pick from the built-in pin styles, so the map looks like it belongs in your presentation.
-
3
Label the Map and Hide the Interface
Back in the Boundary Tool, turn on Include Name, Include Value, and Include Legend so each region prints its label and the key appears on the map itself. Use Custom Value if you want to print a different metric than the fill color. Then hide the toolbar and interface for a clean view, so nothing but the map and its legend shows before you capture it.
-
4
Export the Image or Share a Link
Open Export Map Image and save the view as a PNG or PDF, at poster size up to 2048 by 2048 for a large slide or a printed handout. Drop the file into PowerPoint or your PDF deck. If the room would rather click around the map, use presentation mode, send a password-protected link, or paste the one-line embed into an internal page.
Start Your Presentation Map Free
Start the 10-day free trial with no credit card and build the map on your own data. Upload your list, outline the regions, brand the markers, and export the first slide image the same day. Want a hand? A Maptive specialist will set up a board-ready map with you and show you where the export options live.
No credit card required
Frequently Asked Questions
How do I export a map image into a presentation?
Open Export Map Image from the tools and save the current view as a PNG or a PDF. The PNG drops straight into a PowerPoint slide, and the PDF suits a printed handout or a PDF deck. You can export at poster size, up to 2048 by 2048 pixels, when the slide or the print run needs a larger, sharper image. Set your labels and legend before you export, so the picture shows its own key and reads on the slide without the side panel open.
Can I make a branded map for a board meeting?
Yes. Set the map colors to match your deck through custom range colors in the Boundary Tool and group colors in the Grouping Tool. Open Custom Markers to upload your own logo or pin images, or choose from the built-in pin styles, so the points look on-brand. Add names, values, and a legend on the map itself, then hide the interface for a clean capture. Export the result as a PNG or PDF, or share a password-protected link if the board would rather click through a live version.
How do I make a clean county-outline map with no shading?
Open the Boundary Tool, pick the US Counties boundary set, and choose the No Fill type. That draws the county borders without coloring the regions, which gives you a clean outline map. In Boundary Formatting, set the line width and line color so the borders read at slide size, and turn on Hide Areas W/O Data to drop counties you are not showing. Add your markers or a few labels on top, then export the view as a PNG or PDF for the slide.
Can I copy and paste a Maptive map into PowerPoint?
You export the map as an image first, then place it in the slide. Open Export Map Image, save a PNG, and insert that file into PowerPoint the same way you add any picture. The PNG holds your outlines, colors, markers, and legend exactly as you set them on screen. For a live option instead of a static picture, share a password-protected link or paste the one-line embed into an internal page, so the map stays interactive during the meeting.
What image formats and sizes can I export?
Maptive exports the map as a PNG or a PDF through Export Map Image. The PNG suits slides and screens, and the PDF suits printed handouts and PDF decks. Both can go up to a 2048 by 2048 poster size, which covers a full-bleed slide or a printed board. Set the map view, labels, and legend the way you want them first, because the export captures the current view, so what you see on screen is what lands in the file.
Can I put the legend and region names on the map itself?
Yes. In the Boundary Tool, turn on Include Name to print each region's name, Include Value to print its number, and Include Legend to place the color key on the map. That way the exported image explains itself on the slide, without a separate caption or the side panel open. If you want the label to show a different metric than the fill color, use Custom Value to print that number instead, so one map view can carry two figures per region.
How do I hide the toolbar and interface before a screenshot?
Turn off the interface elements for a clean view, so the map and its legend are the only things on screen. That removes the surrounding controls before you capture the map. For a slide, the cleaner route is Export Map Image, which saves the map as a PNG or PDF without the tools around it. For a live walk-through, presentation mode gives you a full-screen version to show on the meeting screen.
Can I share an interactive map instead of an image?
Yes. When the room would rather click around than look at a picture, share the live map through a password-protected link, so only people with the password open it. You can also use a public link for a wider audience, or paste a one-line HTML embed into an internal page or intranet. Presentation mode gives you a full-screen view to drive from your own laptop during the meeting, and the shared map reads from the same data as the file you export.
Will the exported map match the colors in my slide deck?
It will, because you set the colors before you export. In Fill Settings, pick the color for each range so the shading matches your deck, and in the Grouping Tool set each group's marker color the same way. Custom Markers lets you swap in your own logo or pin images for a closer match. Once the view looks right, Export Map Image captures those exact colors in the PNG or PDF, so the slide and the map read as one piece.
How current is the map when I share the link during a meeting?
A shared map reads from the same data as your working map, so the link shows the current view when a colleague opens it. If you export a PNG or PDF, that file is a snapshot from the moment you saved it, which is what you want for a fixed slide. For anything that changes between meetings, the password-protected link or the embed keeps the audience on the live version rather than an older picture in a deck.








