


Map Casino Player Revenue & Analytics by Geography
Want to see where your casino players drive in from and how much gaming revenue each area brings? Maptive plots your carded-player file by home address or ZIP, then builds heat maps and revenue-shaded zones so you read guest counts and dollars by geography.
No credit card required
- Upload a carded-player list (your gaming-venue guests) with a home address or ZIP column plus revenue, theo, or visit fields, and geocoding corrects messy addresses and missing ZIPs.
- Build a Marker Density heat map to see where your players come from, with hot pockets marking the neighborhoods that feed the floor.
- Switch the heat to Represents Numerical Data and weight it by revenue, so the intensity follows player value instead of raw head count.
- Draw player zones with the Territory Drawing Tool or Boundary Tool, then read guest count and total revenue inside each one.
- Shade ZIP codes by player count or by revenue with the Boundary Tool, so a single fill ranks the areas that matter most.
- Share a password link or open presentation mode so the analytics team reads the same player map.
Trusted by teams at









See Where Your Players and Their Revenue Come From
It has saved me hundreds of hours across account-manager territories and warehouse routing, and it is easy to use.
Building the Player Map in Maptive
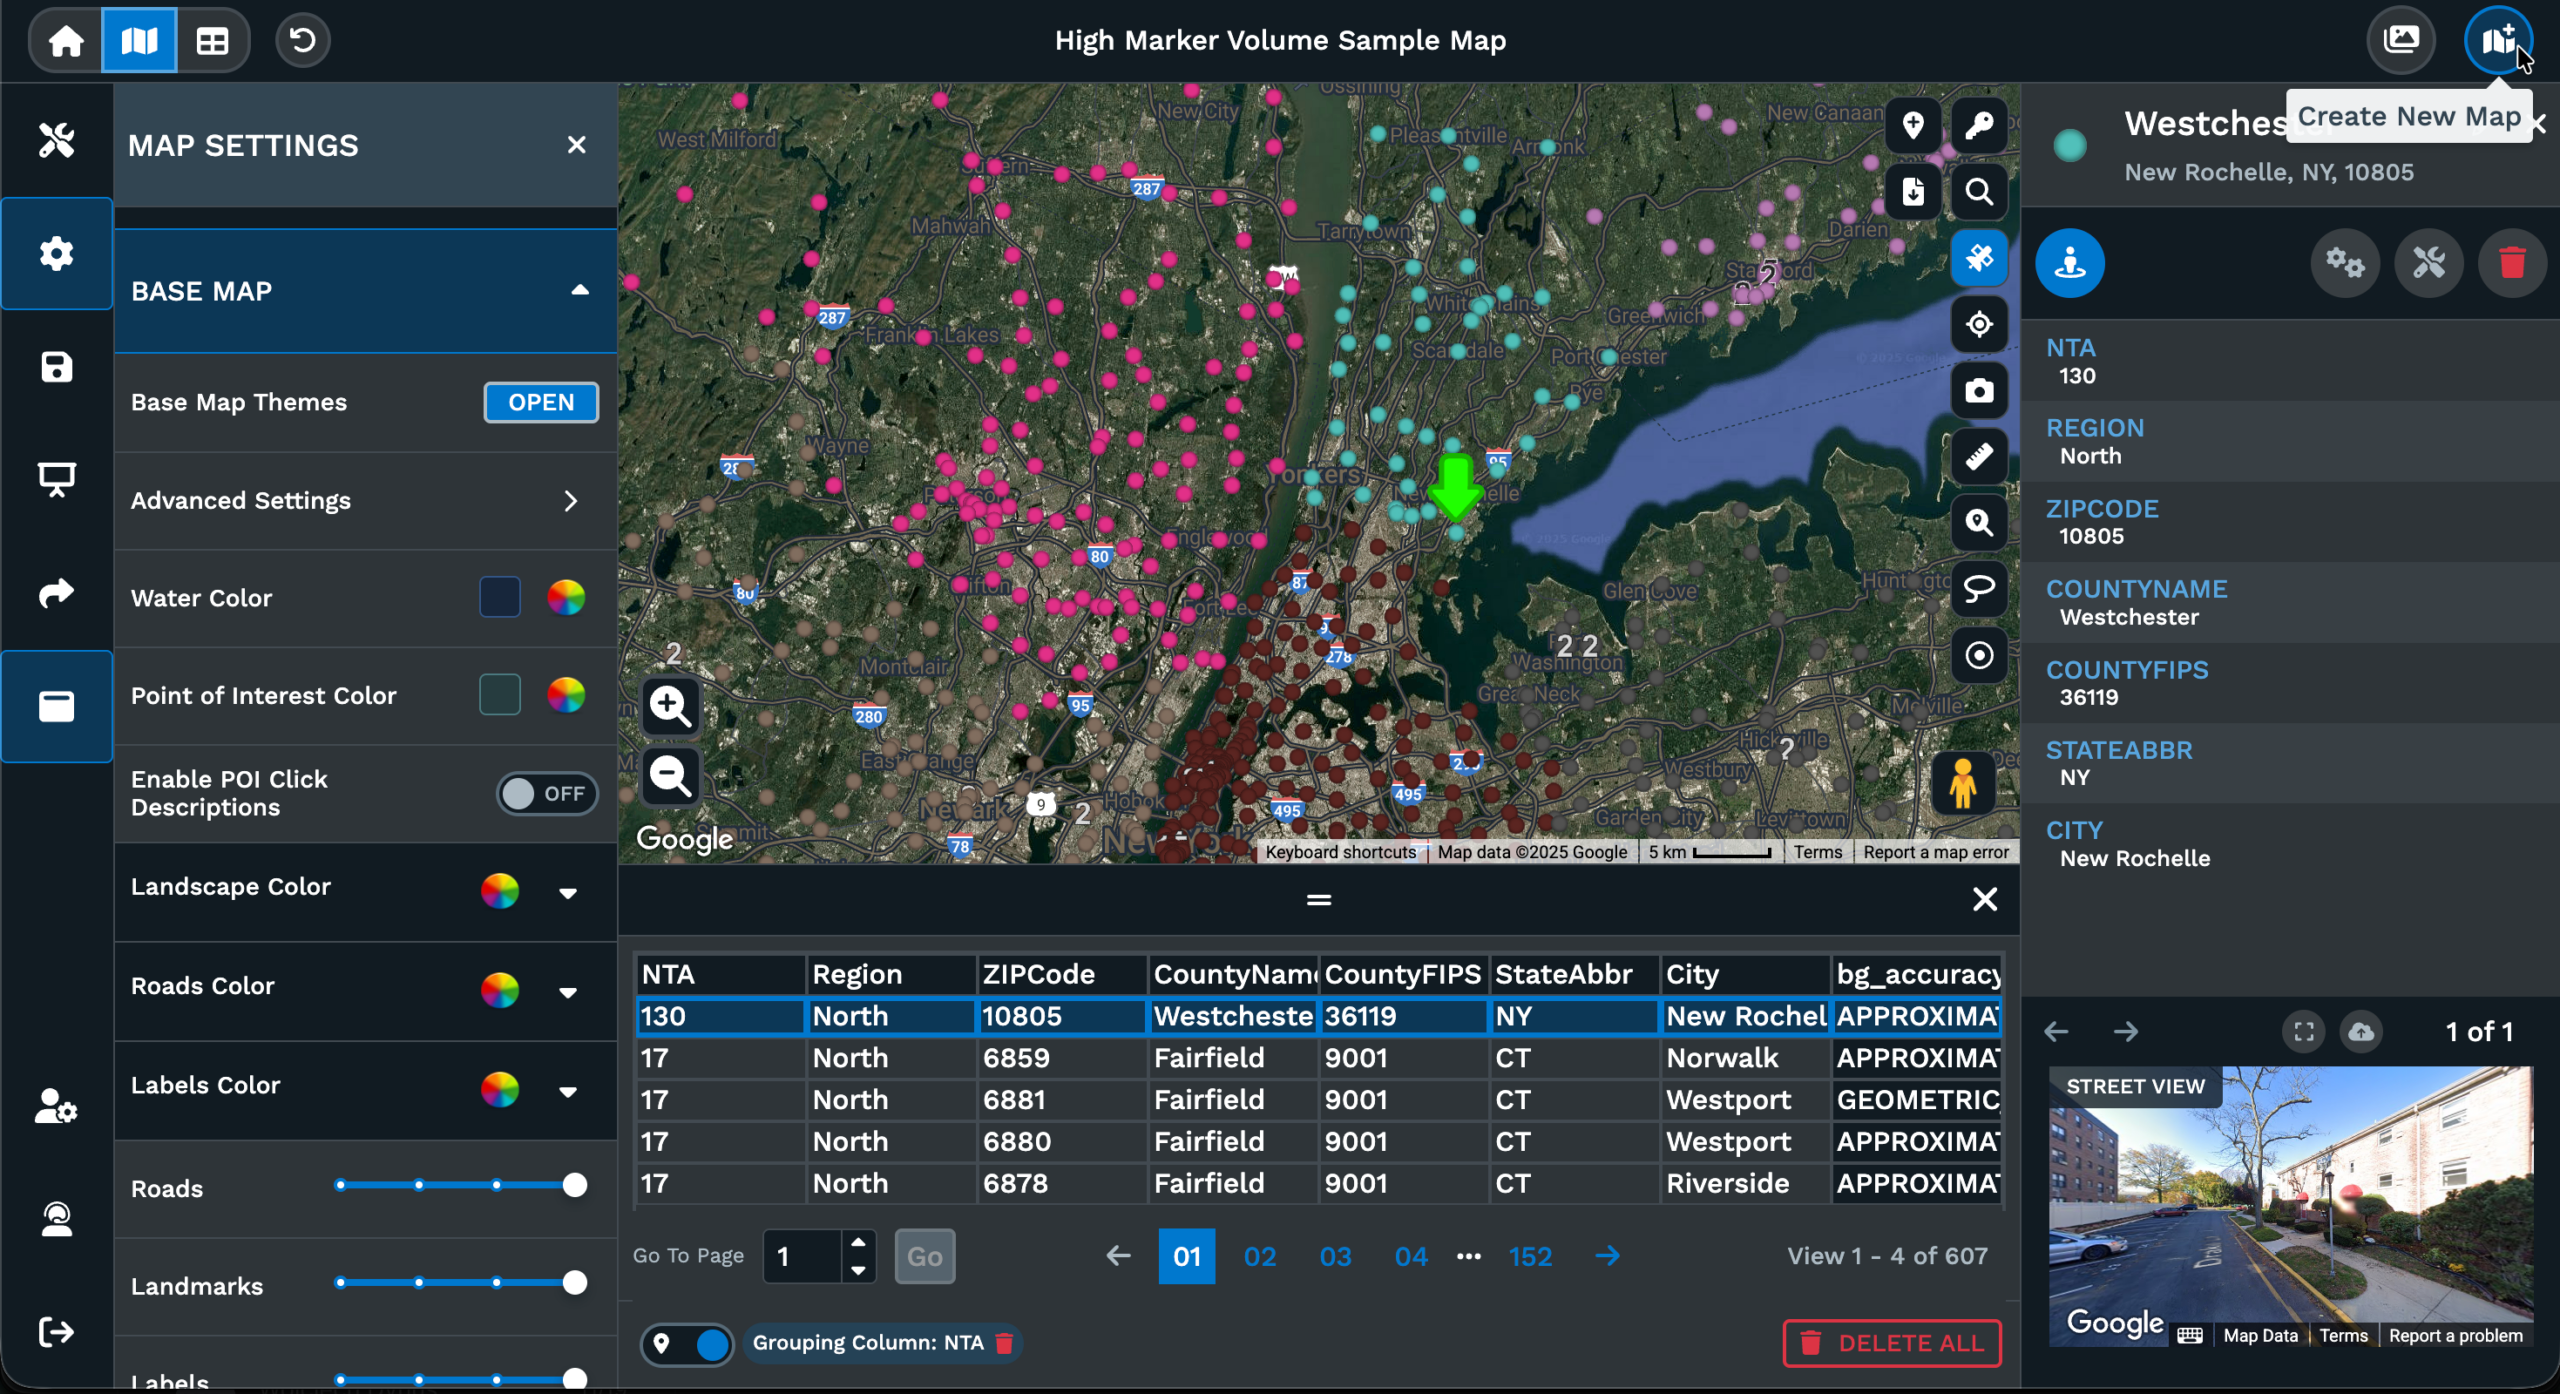
-
1
Upload the Player File
Bring in your player list from Excel, a CSV, a Google Sheet, or a paste, with a home address or ZIP column and the numbers you track, like revenue, theo, or visit count. Geocoding places each player and corrects incomplete addresses, so a file that missed some ZIP codes still maps. One map holds up to 200,000 markers, enough for a full player database.
-
2
Map Where Players Come From
Open the Heat Mapping Tool from Map Tools and pick Marker Density to see where your players cluster, then click Add Heat Map. To read value instead of count, switch the style to Represents Numerical Data and point it at your revenue column, and the heat weights by dollars rather than head count. Adjust radius, opacity, and intensity until the top areas read at a glance, then Hide Map Markers to leave only the gradient.
-
3
Draw Zones and Read Guest Count and Revenue
Open the Territory Drawing Tool and trace a player zone around a region, or use the Boundary Tool to select ZIP codes and Convert Boundaries into Territories. Click the zone and open Customize Metrics, then under Spreadsheet Data set Group Count on your player ID for guest count and Sum on your revenue column for total dollars. Each zone prints its own player count and revenue, so a market reads as one number.
-
4
Shade ZIP Codes by Players or Revenue
For a ranked read, open the Boundary Tool, pick the ZIP Codes boundary set, and choose a fill. Marker Count colors each ZIP by how many players fall inside it, while My Numerical Data colors by a number you pick, such as Sum of revenue. Click Load Boundaries and a color key of ranges appears, with each ZIP showing its name and total.
Start Mapping Your Player Data
Begin the 10-day free trial with no credit card and load your own player file. Upload the addresses, build a heat map of where players come from, and draw a zone to total its revenue on the first session. Want a hand? A Maptive specialist will build the first player heat map and zone read with you.
No credit card required
Frequently Asked Questions
How do I map player revenue by ZIP?
Upload your player file with a ZIP or address column and a revenue column, then open the Boundary Tool and pick the ZIP Codes boundary set. Set the fill to My Numerical Data, choose Sum as the function, and select your revenue column, then click Load Boundaries. Every ZIP colors by total player revenue, with a key of ranges and the dollar total printed on each area. Fill Settings let you set the number of ranges and the color for each one.
Can I build heat maps of where my players come from?
Yes. Open the Heat Mapping Tool, keep the Marker Density style, and click Add Heat Map, and the map lights up where your player home addresses cluster. The gradient marks the neighborhoods that feed your floor without rolling the points up into boundaries first. Adjust radius, opacity, and intensity so the hot pockets read the way you want, and hide the underlying markers so only the density shows. Build a second heat map alongside it and the colors auto-differ for a side-by-side read.
How do I show a revenue heat map instead of a player count?
Switch the heat map style to Represents Numerical Data and point it at your revenue, theo, or coin-in column. The heat then weights by that value, so the intense areas mark where the money comes from rather than where the most players live. This matters when a handful of high-value players in one area outweigh a crowd of low spenders in another. Keep a plain Marker Density heat map beside it to compare where many players cluster against where the revenue lands.
How do I read guest count and total revenue for a zone?
Draw a zone with the Territory Drawing Tool or select ZIP codes in the Boundary Tool and convert them into a territory. Click the zone and open Customize Metrics, then under Spreadsheet Data add Group Count on your player ID for the guest count and Sum on your revenue column for the dollar total. Editing the metric set updates every zone of that type, so each drawn area reports the same player count and revenue fields for a clean comparison.
Can I draw my own player zones on the map?
Yes. The Territory Drawing Tool lets you trace a zone directly on the map when a market follows no ZIP or county line, so a marketing region or a competitor catchment reads as one shape. If your zones follow ZIP codes or counties, use the Boundary Tool to select the areas and Convert Boundaries into Territories, which groups them into one named unit. Either way you click the zone and read its player count and revenue through Customize Metrics.
What player data do I need to upload?
A home address or ZIP code per player is enough to place them on the map, and geocoding corrects incomplete addresses and missing ZIP codes. Add the numbers you track, such as revenue, theo, coin-in, or visit count, and any of them can drive a heat map or a boundary fill. A player ID column lets you count guests per zone with Group Count. You upload from Excel, a CSV, a Google Sheet, or a paste, and no GIS skills are needed.
Can I shade ZIP codes by how many players live there?
Yes. Open the Boundary Tool, choose the ZIP Codes boundary set, and pick the Marker Count fill, which colors each ZIP by how many player rows fall inside it. Click Load Boundaries and the map ranks your ZIP codes by player density, with a color key and a count printed on each area. This shows the ZIP codes that send the most guests, separate from the revenue view. Switch the same boundary set to a My Numerical Data fill to compare player count against revenue for the same ZIPs.
How many players can I map at once?
One map holds up to 200,000 markers, so a full player database plots on a single map without splitting the file. It runs on WebGL through the Google Maps Platform, so a large point set stays responsive as you pan and zoom. A heat map reads the whole set as a density gradient, and boundary fills total every player inside each ZIP or zone.
Can I share the player map with my analytics team?
Yes. Share a password-protected link so only your team opens the map, publish a public link, or drop a one-line HTML embed into an internal page. Presentation mode gives a full-screen view for a floor meeting or a marketing review. You can also export the map image as a PNG or PDF, up to a 2048 by 2048 poster. Everyone reads the same player heat map and zone totals from one source instead of trading screenshots.
Can I compare two player zones side by side?
Yes. Draw each zone with the Territory Drawing Tool or build them from ZIP codes in the Boundary Tool, then open Customize Metrics on each and add the same Group Count and Sum fields. Because editing the metric set updates every zone of that type, both zones report guest count and total revenue in the same layout. Color each zone differently to show a marketing region and a competitor catchment next to each other on one view.








