


Shade Ad Inventory by Demographics on a Coverage Map
An advertiser asks who lives around your billboards and inside your station coverage, and the pitch needs an answer on one map? Maptive plots your inventory, shades the ZIP codes under it by income or ethnicity, and reads the demographics inside every coverage ring.
No credit card required
- Plot billboards, transit boards, or stations with your own logos and pin styles.
- Shade the ZIP codes under each site by median household income, ethnicity, or another census metric.
- Ring every location with a coverage radius, one circle per site, in a single step.
- Read population, income, and household detail inside each ring from a pop-out.
- Export the finished map as a PNG or PDF for the advertiser proposal deck.
- Share a password-protected link so a buyer opens the same map you pitched.
Trusted by teams at









Prove the Audience Behind Your Inventory
Maptive helps us drastically with compliance, marketing, and itinerary planning.
Building the Coverage Map in Maptive
-
1
Plot Your Ad Inventory
Upload your list of billboards, transit boards, or station towers as an Excel, CSV, or Google Sheet, and geocoding places each row even when a ZIP is missing. Open Map Tools, pick Custom Markers, and upload your own logo or choose from more than 20 pin styles, so each format on the map reads at a glance.
-
2
Shade the ZIPs by Demographics
Open the Boundary Tool in Map Tools and pick the ZIP Codes boundary set. Set the fill type to Demographic Census Data, choose the demographic group, and pick the metric, such as median household income or an ethnicity count, then click Load Boundaries. Every ZIP under your inventory colors by that number, with a key of ranges printed beside the map.
-
3
Ring Each Site With Coverage
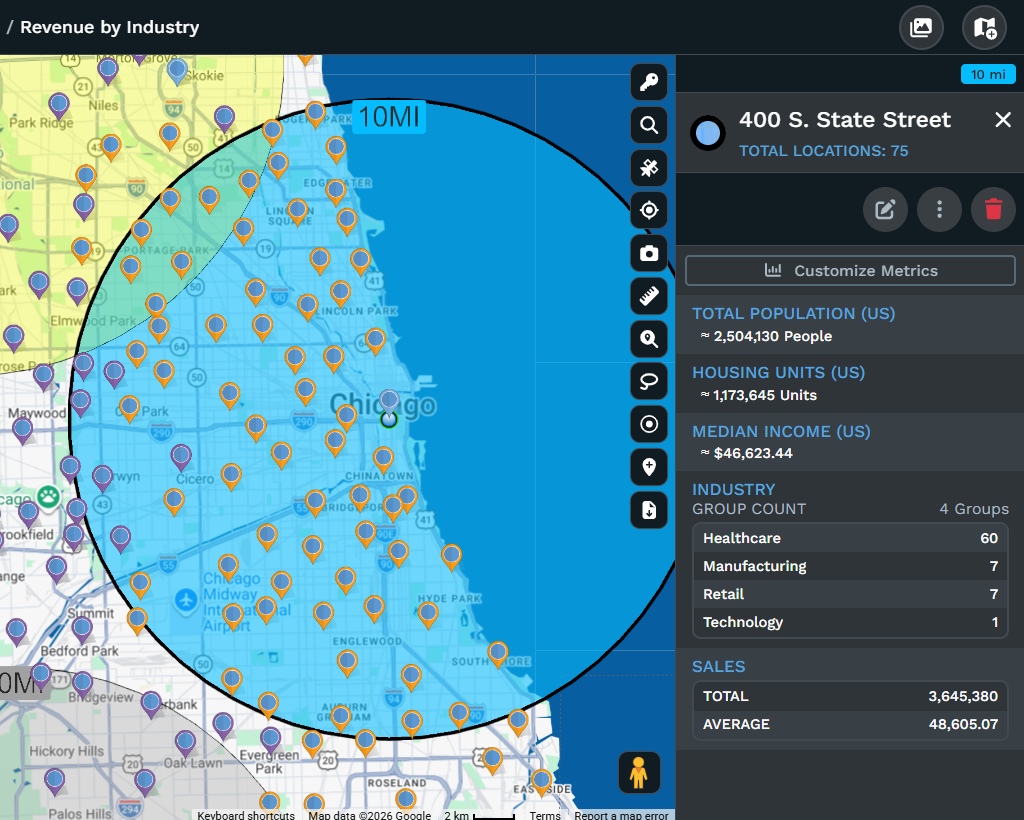
Open Distance Radius Circles and set Proximity Within to the reach you sell, in miles or kilometers. Set Apply To Group and pick the column that names your sites, and Maptive draws one coverage ring around every location at once. Click any ring and open Customize Metrics, then under Demographic Data add population, income, or households to read the audience inside that circle.
-
4
Export the Map for the Pitch
With the inventory shaded and ringed, open Export Map Image and save a PNG or PDF, or a poster up to 2048 by 2048, to drop into the proposal deck. To let the advertiser open the live map, share a password-protected link or a public link, or paste the one-line embed into a portal.
Build Your First Advertiser Map Free
Start the 10-day free trial with no credit card and load your own inventory list. Plot the sites, shade the ZIP codes by income, ring each location, and read the audience inside within one session. Want a hand? A Maptive specialist will build the first coverage map with you before your next pitch.
No credit card required
Frequently Asked Questions
How do I shade my ad locations by income?
Plot your inventory, then open the Boundary Tool in Map Tools and pick the ZIP Codes boundary set. Set the fill type to Demographic Census Data, choose the demographic group, and pick median household income, then click Load Boundaries. Every ZIP under your sites colors by income, with a key of ranges printed beside the map. Your billboards or towers stay on top, so a buyer sees the income right around each one. More than 50 census variables come with every plan at no extra cost.
Can I show station coverage rings over demographics?
Yes. Shade the ZIP codes by a census metric through the Boundary Tool first, then open Distance Radius Circles and draw a ring at the reach you sell around each station. The ring is on top of the shaded ZIPs, so the map shows the coverage area and the audience under it together. Click any ring and open Customize Metrics to read the population and income inside that circle. Both layers print on the same map, which makes the coverage and the demographics one picture for the advertiser.
How do I plot my billboards or stations on a map?
Upload your inventory as an Excel file, CSV, or Google Sheet, or paste it in, and geocoding places every row and corrects messy addresses or missing ZIPs. To make each format read at a glance, open Custom Markers in Map Tools and upload your own logo or pick from more than 20 pin styles, so transit boards and towers carry different icons. Maptive holds up to 200,000 markers on one map, so a full regional inventory fits without trimming the list.
What demographics can I shade ad inventory by?
The Boundary Tool fills your ZIP codes from more than 50 U.S. Census variables, including median household income, population density, age, ethnicity, and household composition, sourced from the U.S. Census Bureau. Canadian inventory works the same way against Statistics Canada data. A growing library of market data adds spending and household detail alongside the census figures, so a proposal can lead with the metric the advertiser cares about most. You can also print a second number on each ZIP label with Custom Value, so one map view shows two figures.
Can I read the population inside each coverage ring?
Yes. Click a coverage ring and open Customize Metrics in the pop-out, then under Demographic Data set the region to the U.S. or Canada, pick the demographic group, and add population, income, or households with Add to Proximity Details. The totals appear for that ring and update if you move or resize it. Under Spreadsheet Data you can also sum or count your own columns inside the circle, such as face count or spot inventory, so one pop-out shows the audience and the ad numbers side by side.
How do I build a coverage map for an advertiser proposal?
Plot your inventory with Custom Markers, shade the ZIP codes under it by income or ethnicity through the Boundary Tool, then ring each site with Distance Radius Circles. Set Apply To Group so every location gets one ring at once, and read the audience inside each ring with Customize Metrics. Export the map as a PNG or PDF for the deck, and share a link so the buyer opens the live version. The whole map builds from menu choices, with no GIS skills or code.
Can I export the map for a pitch deck?
Yes. Open Export Map Image and save a PNG or a PDF, or a poster up to 2048 by 2048 pixels for a printed leave-behind, then drop the file into the proposal deck. The export captures your inventory pins, the shaded ZIP codes, the coverage rings, and the legend as one image. Because you control the ranges and colors in Fill Settings before you export, the map matches the look of the rest of the pitch rather than a default template.
Can I share the ad inventory map with an advertiser?
Yes. Share a password-protected link when a buy is confidential, a public link for a wider audience, or paste the one-line HTML embed into a sales portal. The advertiser opens the same map you pitched, with the inventory, the shaded ZIP codes, and the coverage rings intact, and can click a ring to read the audience inside it. Presentation mode gives you a full-screen view for a live walkthrough on a call, so the map shows the story without a separate slide.
Do I need GIS skills to build a media coverage map?
No. Each step is a menu choice, so you plot the inventory, shade the ZIPs, and ring the sites without GIS training or code. You upload a spreadsheet, pick a fill in the Boundary Tool, and draw rings from Distance Radius Circles, and the map builds itself from dropdowns. Reading the audience inside a ring is one click through Customize Metrics. Most sellers have a coverage map ready in their first session, and the U.S. and Canada support team helps set up the first one if you get stuck.
Can I draw one coverage ring per station at once?
Yes. In Distance Radius Circles, set Apply To Group and choose the column that names your sites, and Maptive draws a ring of the same reach around every location in that value. That saves drawing a circle by hand for each board or tower across a regional buy. Each ring keeps its own pop-out, so you click any one and read the population and income inside it through Customize Metrics. You can also export the locations inside a ring to xlsx, csv, or the clipboard for a follow-up list.








