


Map Competitors Against Your Locations to See Overlap
Where do you overlap with the competition, and where is the open space nobody has taken? Maptive plots your sites and theirs on one map, colors each side its own way, and rings your stores so overlap, saturation, and white space read at a glance.
No credit card required
- Upload your locations and competitor addresses in one file and let geocoding fix the messy ones.
- Mark each row as yours or a competitor, then color the two sides as distinct pin sets with the Grouping Tool.
- Swap in brand logos or icons for each side with Custom Markers, so rivals are recognizable on sight.
- Ring your stores with Distance Radius circles and see which competitors fall inside each one.
- Shade regions by how many sites they hold to read saturation, then find the nearest competitor to any store.
- Overlay demand with a demographic fill to find the areas that have buyers but no coverage, your white space.
Trusted by teams at









Read Overlap, Saturation, and White Space
Really wonderful product. A great sales tool for our team.
Building the Competitor Map in Maptive
-
1
Load Your Sites and Theirs in One File
Upload a single Excel, CSV, or Google Sheet that holds both sets of addresses, with a column that marks each row as yours or a competitor. Geocoding corrects messy addresses and fills in missing ZIP codes, so no GIS skills or hand-cleaning are needed. Up to 200,000 markers fit on one map.
-
2
Color Each Side with the Grouping Tool
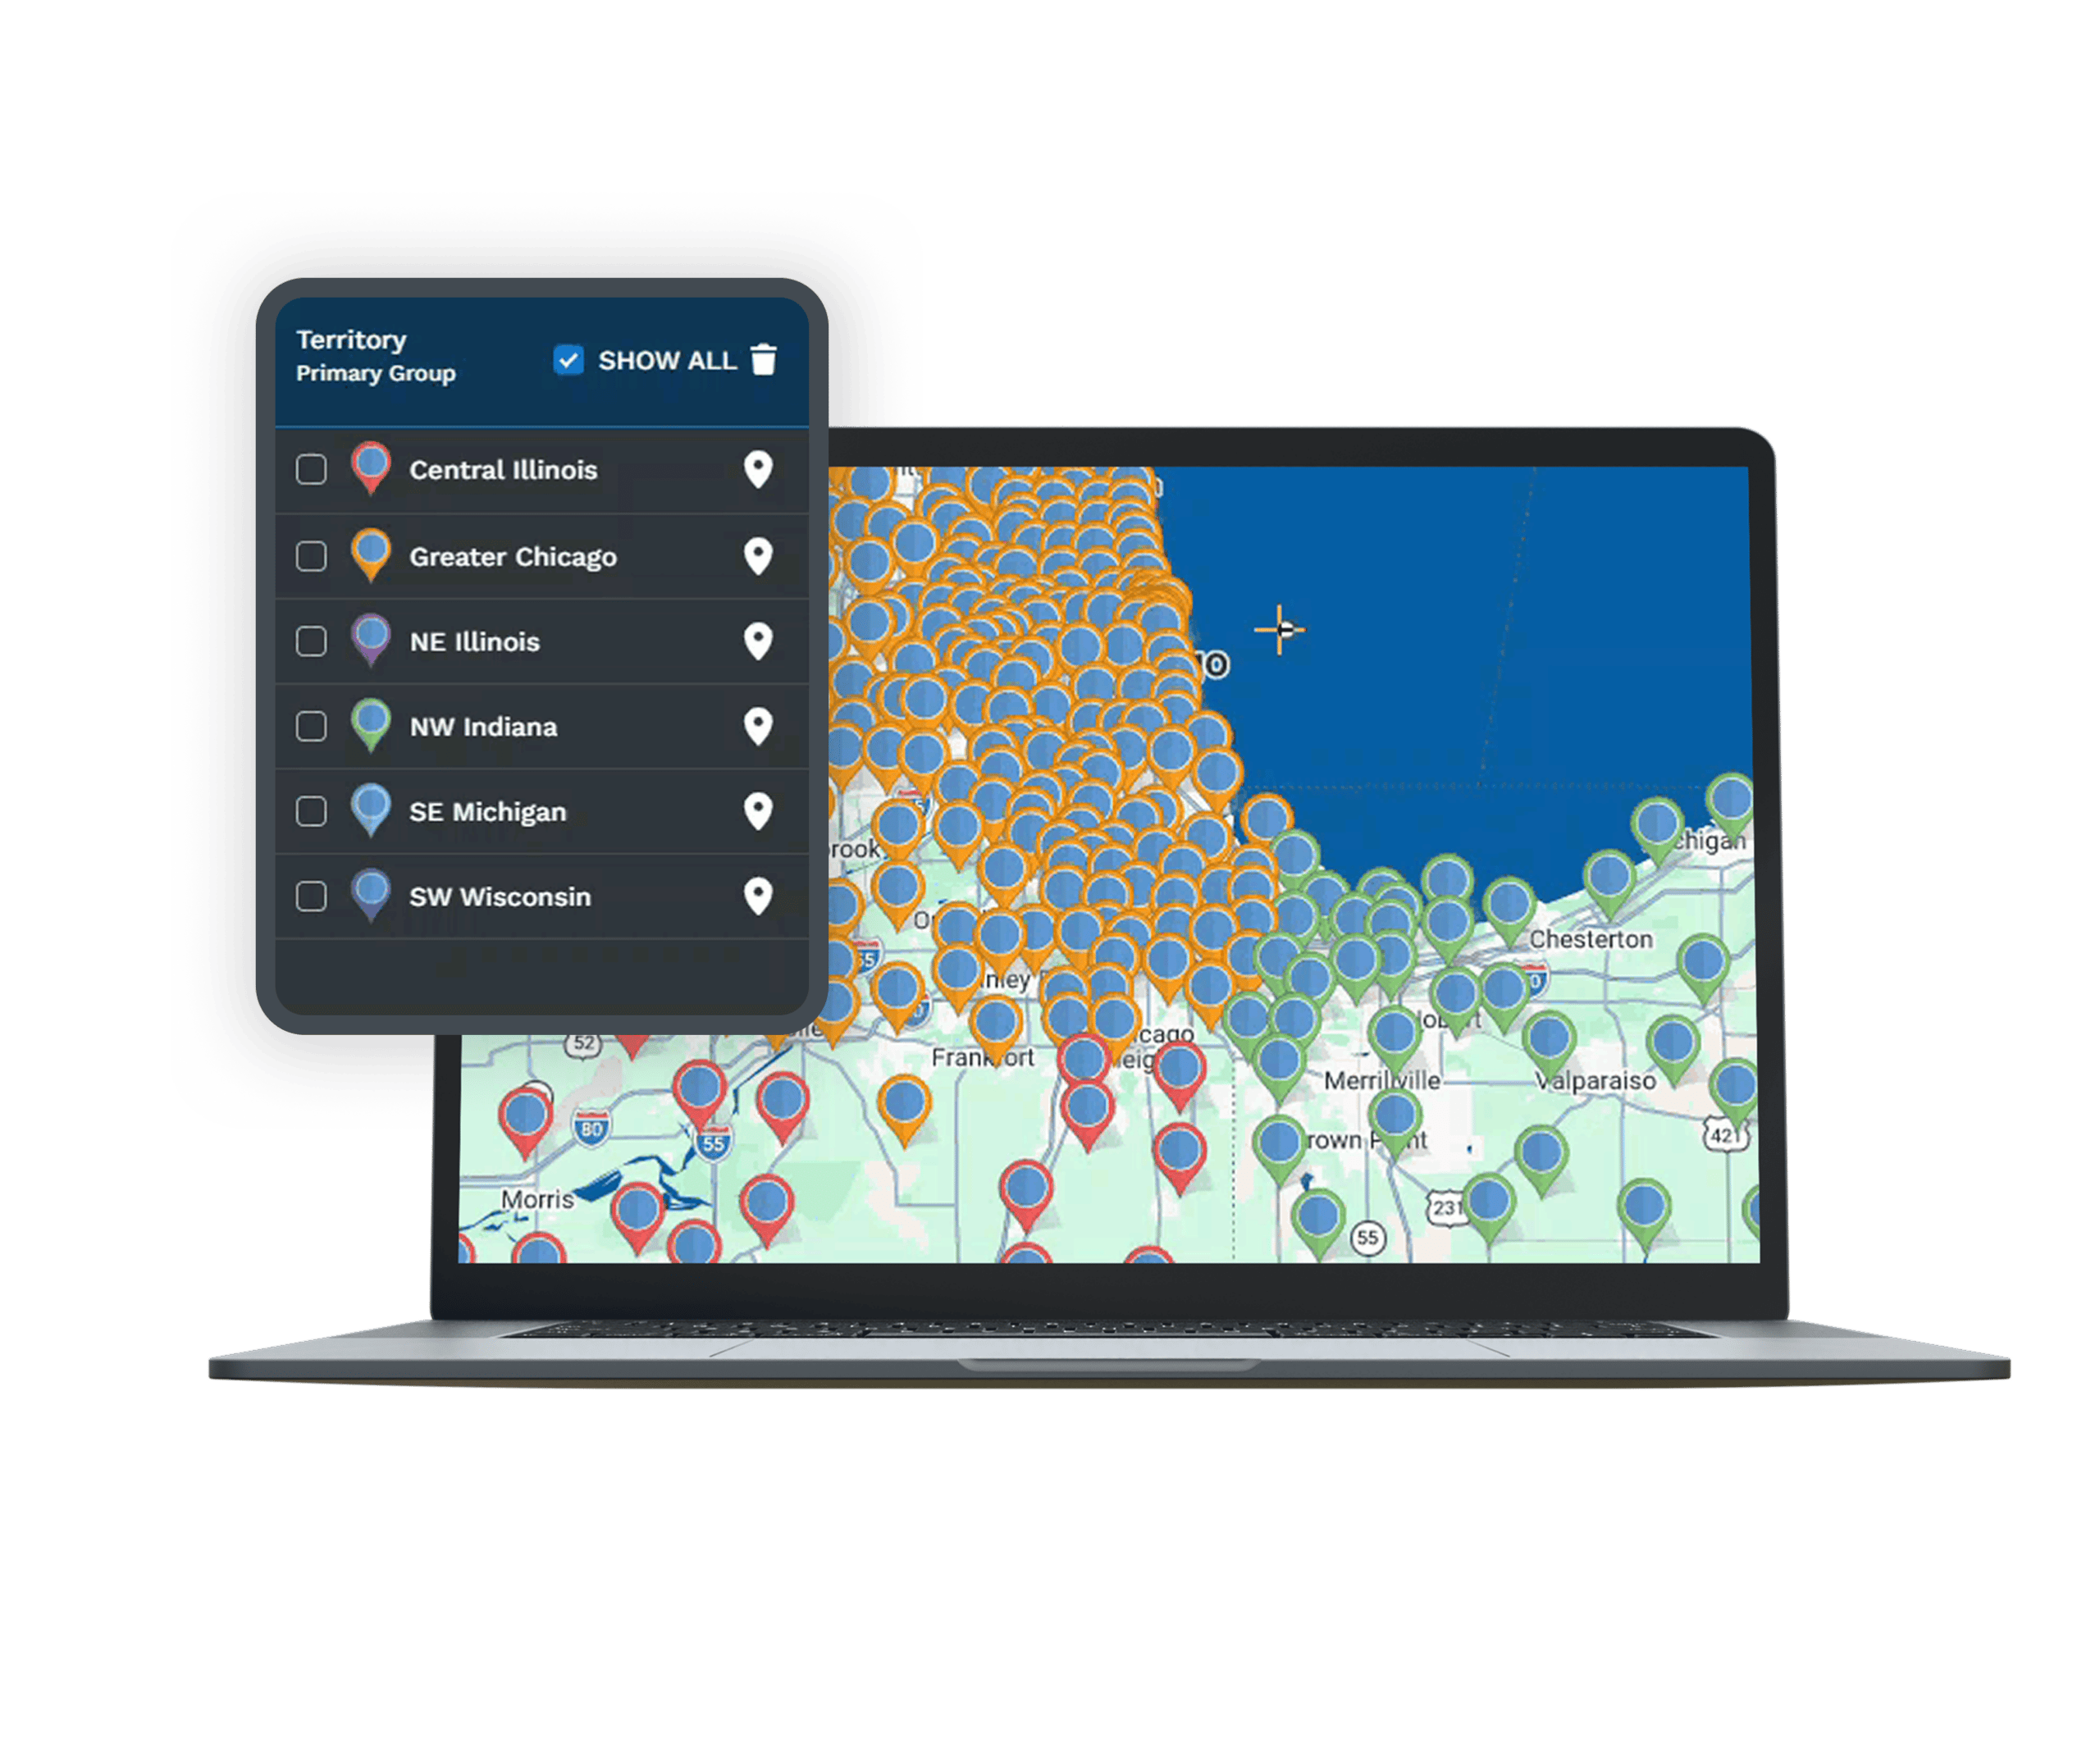
In Map Tools, open the Grouping Tool, pick the type column, and choose Group Now. Your locations and the competitor locations color as two distinct pin sets, and the legend labels each one. Set the color and marker style per group so your stores and the rivals never blur together.
-
3
Swap in Logos with Custom Markers
Open Custom Markers to upload your own images and assign a brand logo or icon to each side, or pick from more than 20 pin styles. Recognizable markers turn a two-color map into one where every point names its owner, which helps in a review meeting or a shared link.
-
4
Ring Your Stores and Read the Overlap
Open Distance Radius Circles and drop a ring on each store, or Apply To a Group to ring every one of your locations at a chosen size in miles. Any competitor inside a ring is a head-to-head overlap. Run Location Finder from a store to list the nearest rivals, and use the Boundary Tool's marker-count fill to shade regions by how many sites they hold, so saturation reads by area.
Map Your Market Against the Competition
Start the 10-day free trial with no credit card and every tool unlocked. Upload your locations and competitor addresses, color the two sides, and ring your stores to see where you overlap and where the open space is. Want a hand? A Maptive specialist will build the first competitor map with you and set up the rings and saturation fill.
No credit card required
Frequently Asked Questions
How do I plot competitors next to my locations?
Put both sets of addresses in one file with a column that marks each row as yours or a competitor, then upload it. Geocoding places every point, correcting messy addresses along the way. Open the Grouping Tool, pick that type column, and choose Group Now, and the two sides color as separate pin sets with a legend. From there you ring your stores, count who falls inside, and shade regions by density. Everything is on one map, so you compare your footprint against the competition without a second file.
Can I use different logos or colors for competitors and my stores?
Yes. The Grouping Tool gives each side its own color and marker style, so your stores and the competitors read as two distinct sets on the map. For sharper recognition, open Custom Markers and upload a brand logo or icon for each group, or pick from more than 20 built-in pin styles. A logo map is easy to read in a review meeting, since every point names its owner without a glance at the legend. You control the color, size, and image per group, and the legend updates to match.
Where do we overlap with competitors and where is the open space?
Overlap shows up where competitor pins land close to yours, and the Distance Radius Tool makes it exact. Ring each store at a set distance and any rival inside that ring is a head-to-head. For open space, shade a region by a demographic metric like population or household income with the Boundary Tool, then read the high-demand areas that hold none of your markers. Those are the buyers with no store nearby, the white space you can move into before a competitor does.
How do I see which competitors are inside my trade area?
Open Distance Radius Circles and center a ring on a store by typing its address, clicking the marker, or clicking the map. Set the size in miles or kilometers, then add the radius, or use Apply To a Group to ring every one of your stores at once. Any competitor pin inside a ring falls in that store's trade area. You can export the locations inside a circle to a spreadsheet, choosing straight-line or driving distance and markers inside or outside, so the overlap becomes a working list.
Can I measure market saturation by area?
Yes. Open the Boundary Tool, pick a boundary set like ZIP codes or counties, and set the fill type to Marker Count. Load Boundaries and each area colors by how many sites fall inside it, with a key of ranges down the side. Map all the points to read total saturation, or filter to competitors only to see where rivals cluster. Fill Settings let you set the number of ranges and switch between value ranges and percentage ranges, so the crowded areas and the thin ones separate cleanly on the map.
How do I find the nearest competitor to each of my stores?
Use the Location Finder, which lists the closest locations to a point you pick. Center it on a store and it ranks the nearest competitor markers by distance. For a visual read, the Distance Radius Tool rings a store and shows every rival inside the ring, and exporting that circle gives you the competitors sorted by straight-line or driving distance. Between the two, you get both a ranked list and a map, so you know which competitor is closest to each of your sites.
Do I need separate maps for my locations and competitor locations?
No. Both sets live on one map, loaded from one file. A single type column tells the Grouping Tool which rows are yours and which belong to competitors, and it colors them as two sets on the same view. Keeping everyone on one map is the point, since overlap and white space only show up when your footprint and the competition sit side by side. You can filter to one side at a time when you want a cleaner read, then bring both back with a click.
How do I add competitor addresses to the map?
List the competitor addresses in the same file as your own sites, one row each, with a column marking them as competitors. Paste from a spreadsheet, upload an Excel or CSV file, or connect a Google Sheet. Geocoding reads each address, corrects the messy ones, and fills in missing ZIP codes, so a rough list still maps. New rows drop onto the same map under the same grouping.
Can I spot white space where there is demand but no coverage?
Yes. Shade a region by a demographic metric with the Boundary Tool's Demographic Census Data fill, choosing something like population density, household income, or age. Load Boundaries and every area colors by that number. Keep your locations and the competitors plotted on top, then read the high-demand areas that hold no markers from either side. Those areas have buyers and no store, which is the white space worth entering. Click any one for its census totals through Customize Metrics to confirm the demand before you commit.
How many locations can I map at once?
One map holds up to 200,000 markers, so a full store network and a long competitor list fit together with room to spare. The map draws with WebGL on the Google Maps Platform, so a large point set stays responsive as you zoom and pan. Color-code the two sides, ring your stores, and shade for saturation on one map, without splitting the data across files.








