


Find Demographic Micro-Segments Inside One ZIP Code
Sending one mailer to a whole ZIP code when the blocks inside it earn twice what their neighbors do? Maptive drops below the ZIP boundary and shades each census tract or block group by income and age, so you read the sub-segments hiding under one flat average.
No credit card required
- Open the Boundary Tool on census tracts or block groups, a level finer than the ZIP itself.
- Shade each tract by median household income, median age, or another census metric with the Demographic Census Data fill.
- Read the color key of ranges to see how one block inside the ZIP compares with the next.
- Switch Value Ranges to Percentage Ranges and turn on Include Value so each tract prints its number.
- Import your own segment scores instead, and color tracts by them with the My Numerical Data fill.
- Export the tracts in a chosen range, or inside an area you draw, into a direct-mail list.
Trusted by teams at









See the Segments Under One ZIP
Really wonderful product. A great sales tool for our team.
Building It in Maptive
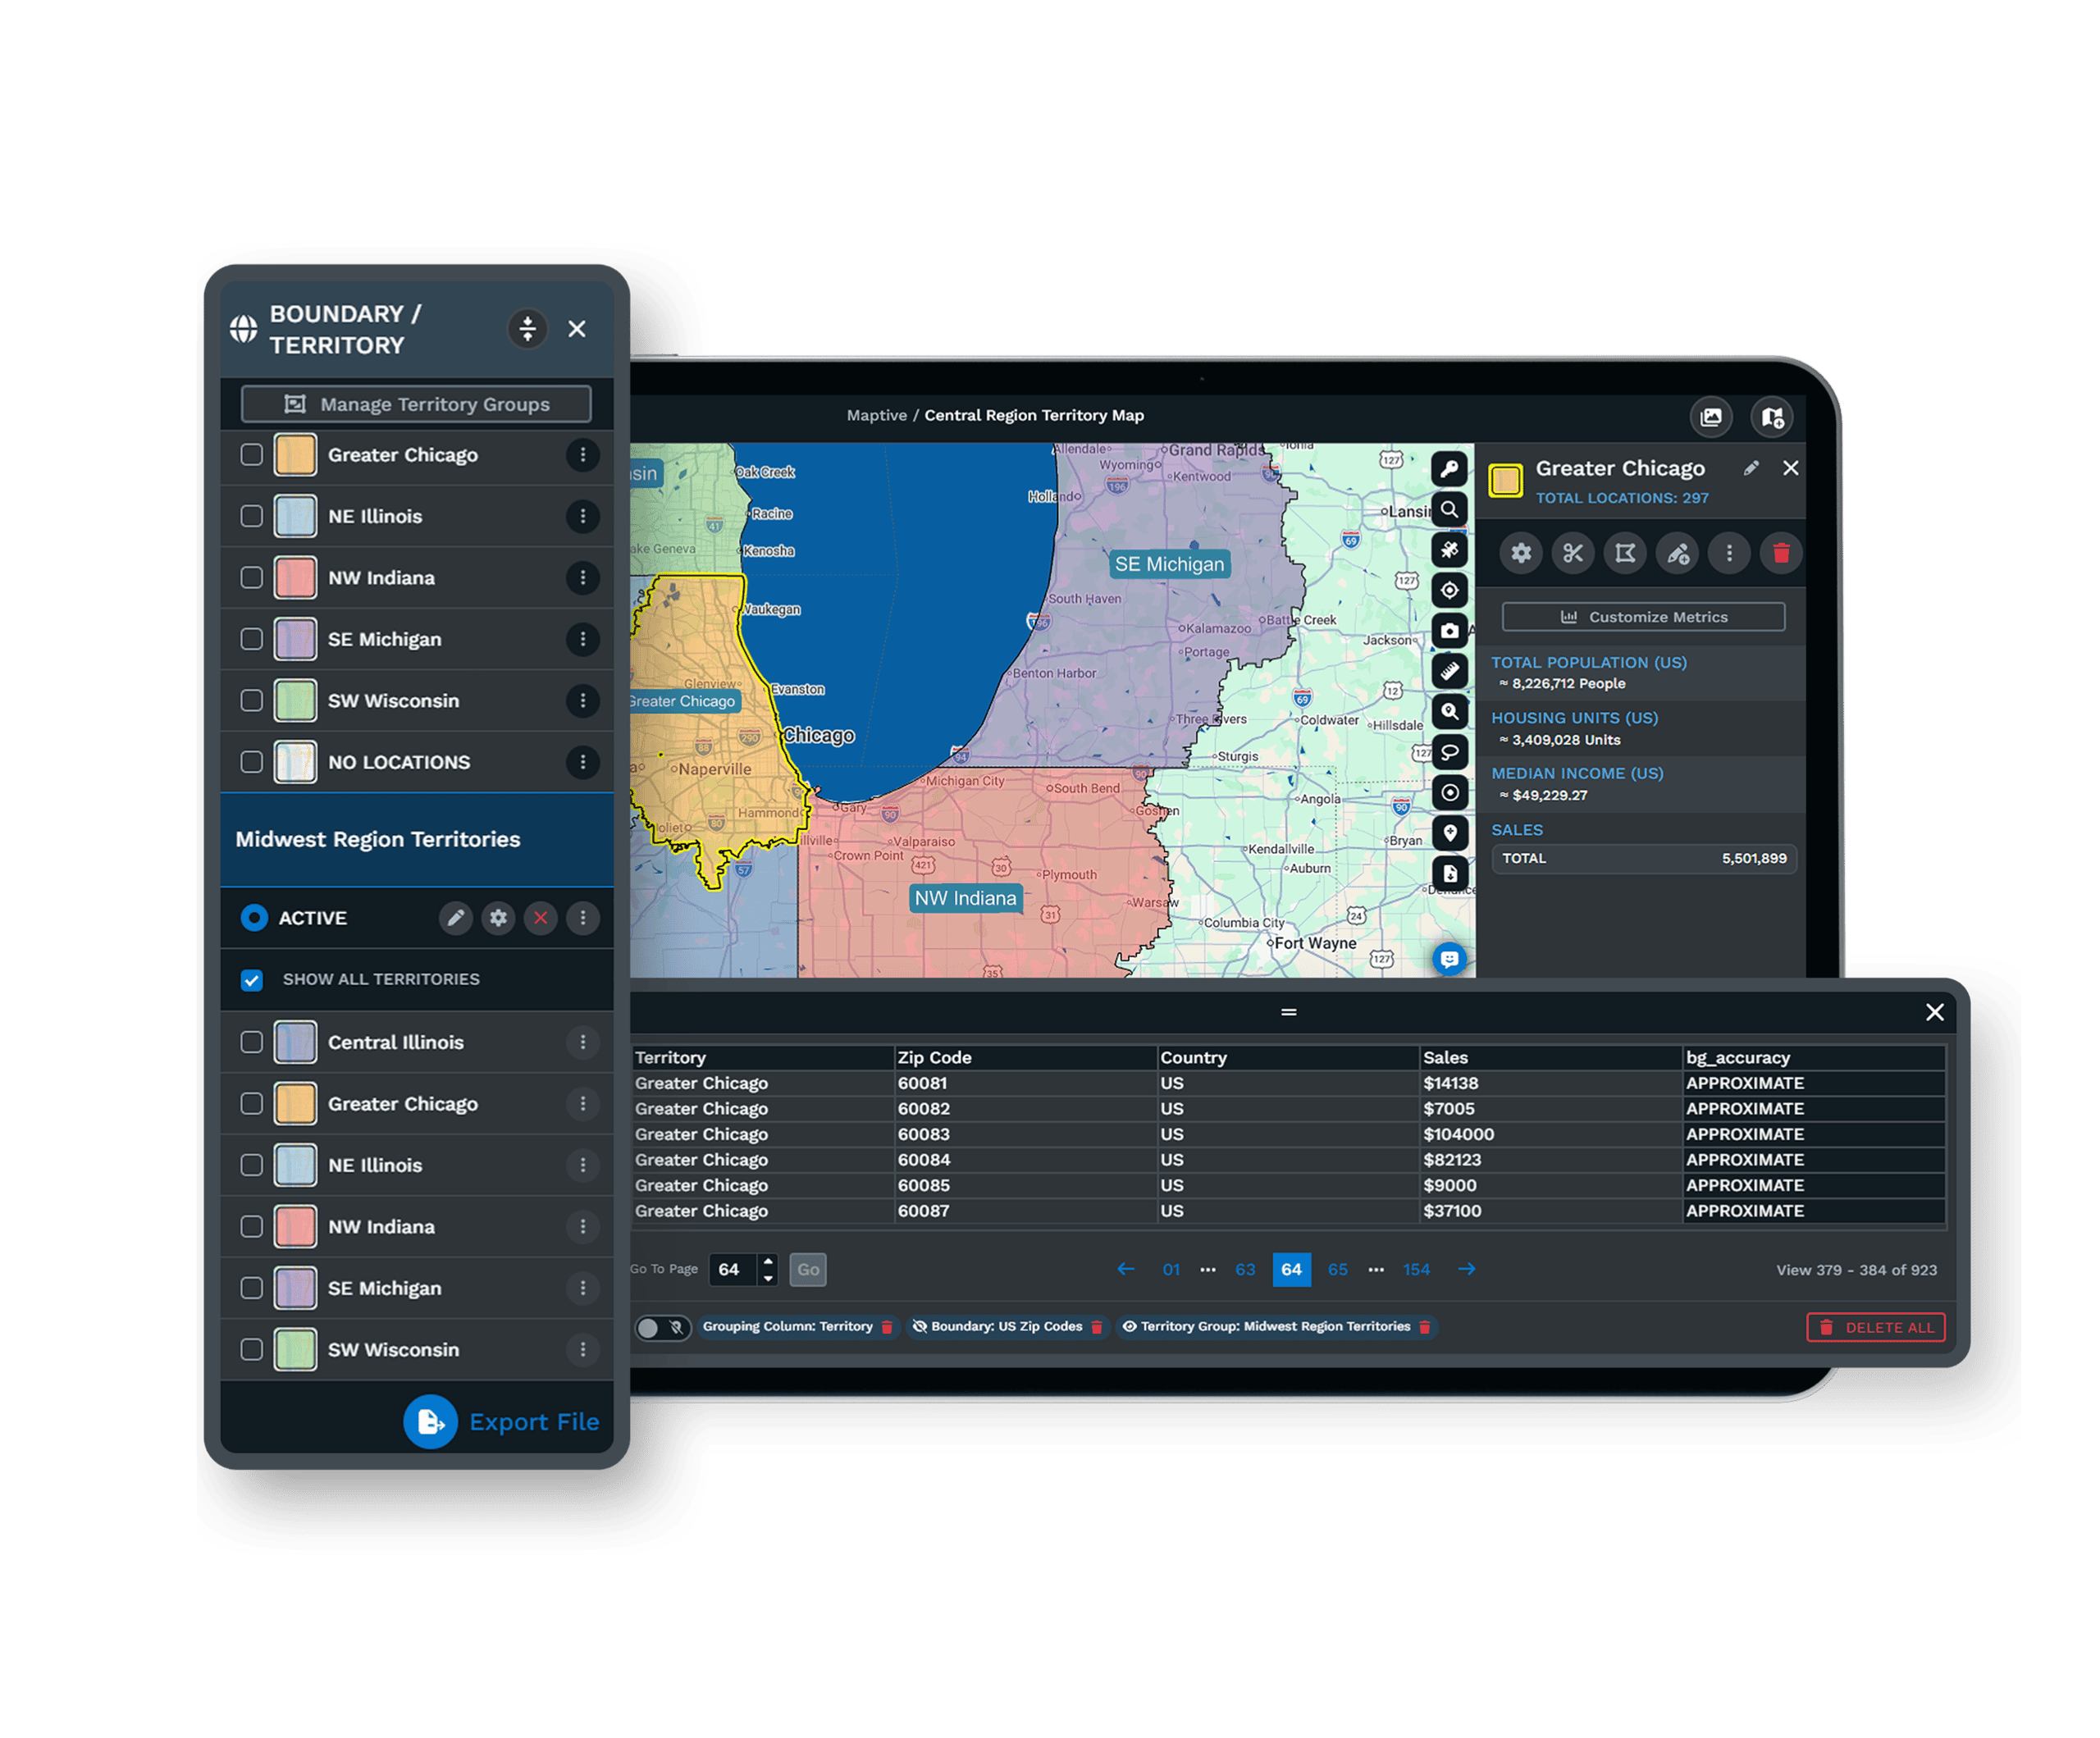
-
1
Drop Below the ZIP
In Map Tools, open the Boundary Tool and pick a boundary set finer than ZIP Codes, either census tracts or block groups. Both sit under the ZIP, so each one covers a smaller, more uniform pocket of households than the whole code.
-
2
Shade the Tracts by a Census Metric
Set the fill type to Demographic Census Data, pick the demographic group, and choose a metric such as median household income or median age. Click Load Boundaries and every tract inside the ZIP colors by that number, so the one average splits into the richer and leaner blocks underneath it.
-
3
Set the Ranges and Labels
Open Fill Settings, then Customize Fills, to set the number of ranges and pick Value Ranges or Percentage Ranges. Percentage Ranges pull out the top and bottom pockets by the high-to-low span. Turn on Include Value so each tract prints its number, and Include Legend to show the key.
-
4
Pull the Direct-Mail List
Select the tracts you want with the Lasso Tool, or draw a zone with the Territory Drawing Tool, then use Export Data to pull the rows inside as an .xlsx, .csv, or .tsv file. To color tracts by your own model instead, switch the fill to My Numerical Data. If the tract code numbers will not plot, set Sync Data to Data so Maptive matches them by text rather than by point.
Sub-Segment Your First ZIP
Start the 10-day free trial with no credit card and load your own list. Open the Boundary Tool on census tracts, shade one ZIP by income, and read the blocks that beat the average. Want a hand? A Maptive specialist will sub-segment your first ZIP with you and set up the export.
No credit card required
Frequently Asked Questions
How do I find different demographic segments inside one ZIP code?
Open the Boundary Tool in Map Tools and pick a boundary set finer than ZIP Codes, either census tracts or block groups. Set the fill type to Demographic Census Data, choose a demographic group, and pick a metric like median household income or median age. Click Load Boundaries and every tract inside the ZIP colors by that number, with a key of ranges. One ZIP that read as a single average now shows the richer and leaner blocks underneath it, each with its total printed on the map.
Can I target sub-areas within a ZIP for direct mail?
Yes. Once the tracts inside a ZIP are shaded by income or age, read the color key and pick the ranges you want to reach. Select the blocks that fit with the Lasso Tool, or draw a zone around them with the Territory Drawing Tool, then use Export Data to pull the rows inside. The export gives you the tract or block-group rows as an .xlsx, .csv, or .tsv file, which becomes the address frame for a mailing. You reach the high-value blocks inside the ZIP instead of mailing the whole code at one rate.
Why do demographics vary inside a single ZIP code?
A ZIP code is a mail-delivery boundary, not a demographic one, so a single code often holds several kinds of household. One end of the ZIP can run to higher incomes and older owners while another end skews younger and rents. At the ZIP level those differences average into one number that hides them. Census tracts and block groups sit below the ZIP and each cover a smaller, more uniform pocket, so shading them shows the income and age swings that the ZIP average flattens out.
What boundary level is finer than a ZIP code?
Census tracts and block groups both fall below the ZIP code. A tract covers a neighborhood-sized area, and a block group is smaller again, so both let you read demographics at a finer grain than a whole ZIP. In the Boundary Tool, pick census tracts or block groups as the boundary set instead of ZIP Codes, then apply the Demographic Census Data fill. Maptive includes more than 50 census variables at five levels, from state and county down to ZIP, tract, and block group, on every plan.
Can I import my own segment scores instead of census data?
Yes. If you already score blocks with a model or a segment index, add that number as a column in your upload. In the Boundary Tool, set the fill type to My Numerical Data, choose a function like Average or Sum, and point it at your score column, then Load Boundaries. The tracts color by your own number rather than a census metric, so your segmentation drives the map. You can hold that fill steady with the Ignore Filters toggle while you filter the markers on top.
How do I build a direct-mail list from the tracts?
Shade the tracts inside the ZIP, then decide which ranges you want from the color key. To capture a block of them, select the area with the Lasso Tool or draw a zone with the Territory Drawing Tool, then use Export Data to pull the rows inside. The file comes out as .xlsx, .csv, or .tsv, ready to hand to a mail house as the tract or block-group frame for the drop.
What census variables can I map at the tract or block-group level?
Maptive includes more than 50 U.S. Census variables, including median household income, median age, population, household size, and homeowner status, and Canadian census data works the same way. Each one maps at five levels, so the same metric you read for a county also reads for a single census tract or block group. In the Boundary Tool you pick the demographic group first, then the exact metric inside it. A growing library of market data adds spending and household detail alongside the census figures for a fuller read of each block.
My census tract numbers will not plot. What should I do?
Census tract and block-group identifiers are long code numbers that do not always geocode like a street address. In the Boundary Tool, open Boundary Settings and set Sync Data to Data instead of Geometry. That matches your rows to boundaries by a text column, the tract number, rather than by point-in-polygon placement, so tracts that never plotted as points still join their shapes. Use the same option for incomplete addresses. Once the match runs, the fill colors those tracts and the totals appear on each one.
How do I control the color ranges inside the ZIP?
Open Fill Settings, then Customize Fills. Set the number of ranges, then choose Value Ranges or Percentage Ranges. Value Ranges put an equal count of tracts in each band, while Percentage Ranges split by the high-to-low span of the numbers, which pulls out the top and bottom pockets. Set the color and opacity per band so the richest or oldest tracts read fast. Turn on Include Value to print each tract's number on the map and Include Legend to show the key. Those are the two classification options Maptive offers.
Do I need GIS skills to sub-segment a ZIP?
No. Going below the ZIP is a boundary-set choice and a fill choice in the Boundary Tool, with no GIS training or code. You upload a list, pick census tracts or block groups, choose the Demographic Census Data or My Numerical Data fill, and the map colors itself. Reading a single tract is one click, and the export is a menu choice. Most people shade their first ZIP in one session, and the U.S. and Canada support team helps set up the first map and the mailing export if you get stuck.








