


Define a Store Trade Area & Analyze the Catchment
Someone says the market is these eight ZIP codes, so how do I map that trade area and read who is inside it? Maptive turns a set of ZIP codes or counties into one named catchment, then reads the census population and your own rows inside it.
No credit card required
- Select a set of ZIP codes or counties in the Boundary Tool and color them as one named trade area.
- Convert the selected boundaries into a territory, so an eight-ZIP market reads as a single unit.
- Draw a freehand catchment with the Territory Drawing Tool when your market follows no boundary line.
- Set a Drive Time Polygon for a drive-based service area around a store or branch.
- Read census population, income, and age inside the catchment from Customize Metrics.
- Sum or count your own rows inside the area, from patient origin to account value, and compare defined markets.
Trusted by teams at









Read the Population Inside a Defined Market
I have used several mapping tools, and Maptive is by far the most user-friendly and most comprehensive available.
Building It in Maptive
-
1
Select the Catchment Boundaries
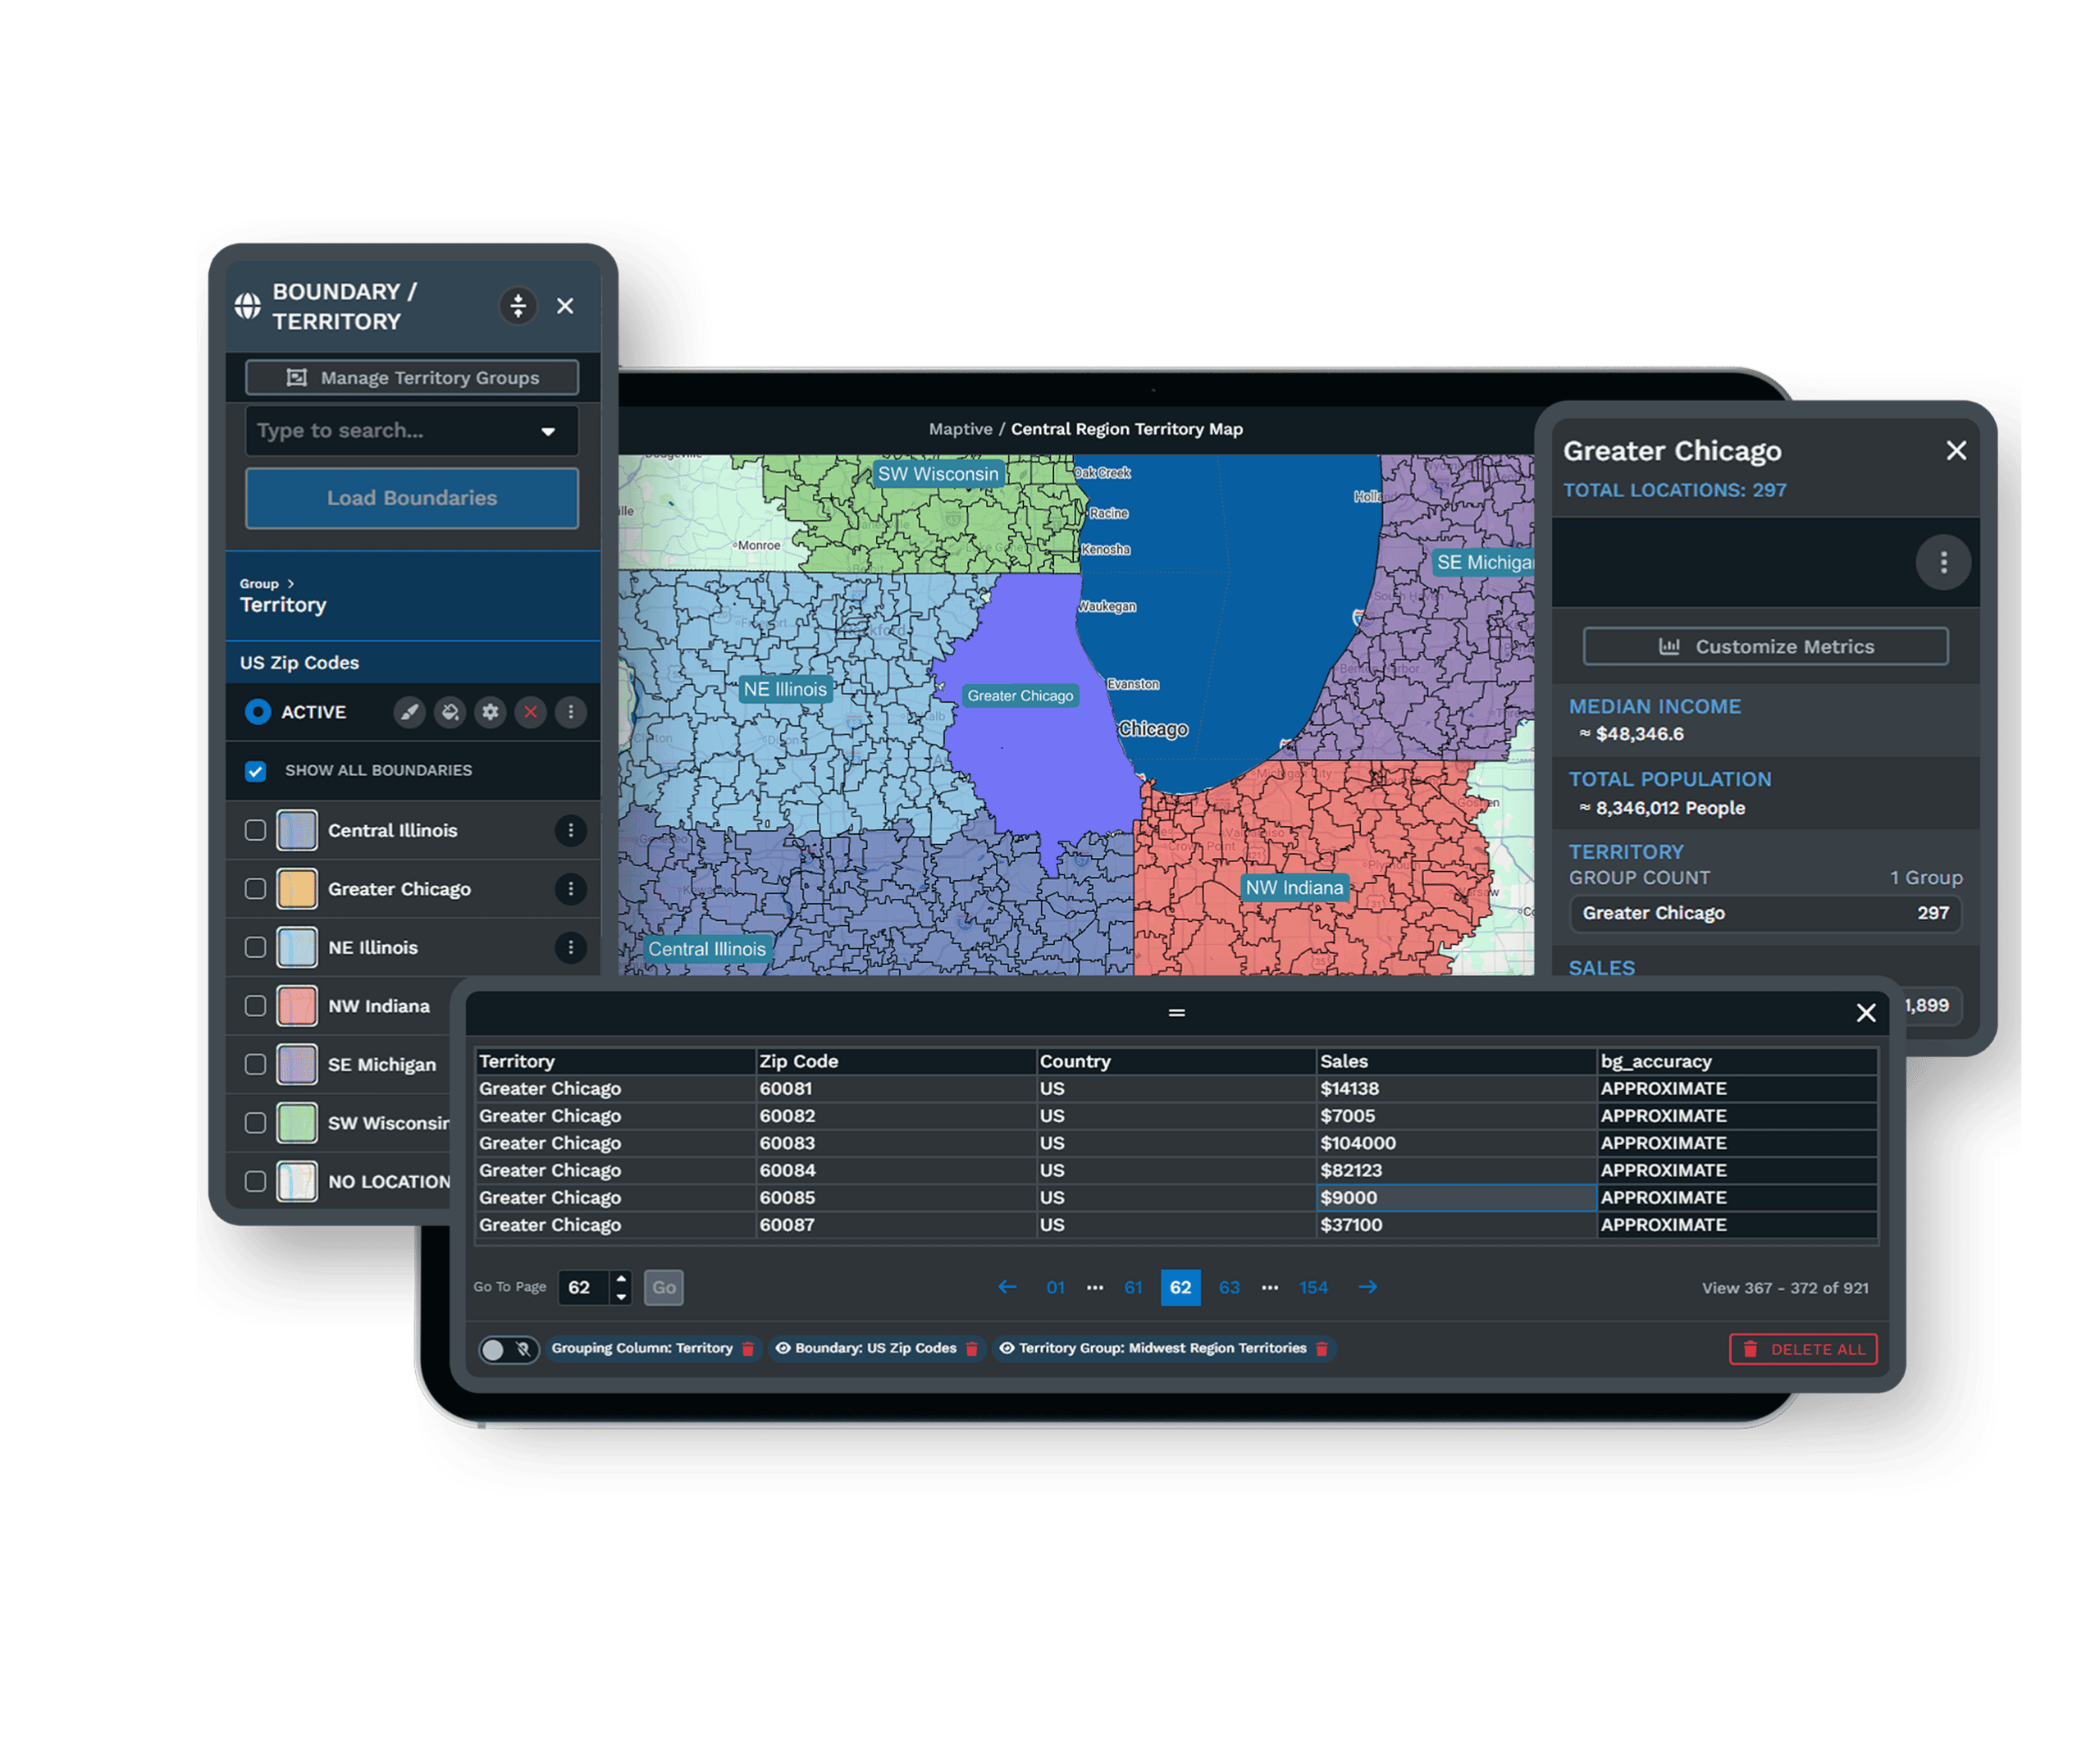
Open Map Tools and pick the Boundary Tool, then choose ZIP Codes or Counties as the boundary set. Set the fill to No Fill and click each boundary that belongs to the market to hand-color your catchment. For a store trade area of eight ZIP codes, select those eight and they read as one shaded area.
-
2
Turn the Selection Into a Territory
To hold the market as a single unit, use Convert Boundaries into Territories, which groups the selected ZIP codes or counties into one named territory. Combine Groups then totals the set, so a multi-ZIP market reads as one market rather than eight separate shapes.
-
3
Or Draw the Catchment by Hand
When a trade area follows no ZIP or county line, open the Territory Drawing Tool and trace the zone directly on the map. For a drive-based service area, open Drive Time Polygon instead, enter the store address, and set the minutes someone drives to reach it. The polygon is based on perfect driving conditions, not live traffic.
-
4
Read Who Is Inside
Click the territory, drawn zone, or polygon and open Customize Metrics. Under Demographic Data, set the region, pick population, median household income, or age, and select Add to Proximity Details. Spreadsheet Data sums or counts your own rows inside the same area, from patient origin counts to account value.
Define Your First Trade Area
Start the 10-day free trial with no credit card and build it on your own address list. Open the Boundary Tool, select the ZIP codes that make up your market, and read the population inside within a minute. Want a hand? A Maptive specialist will map your first catchment alongside you.
No credit card required
Frequently Asked Questions
How do I map a store's trade area?
Open the Boundary Tool, pick ZIP Codes or Counties as the boundary set, and set the fill to No Fill. Click each boundary that belongs to the store's market to hand-color them into one shaded catchment. To hold the market as a unit, run Convert Boundaries into Territories and the selected ZIP codes become one named territory. Click that territory and Customize Metrics reads the population, income, and household counts inside it. The whole trade area then reads as a single area you can size and compare against another store.
Who lives inside this catchment?
Click the catchment, a territory of ZIP codes, a hand-drawn zone, or a drive-time polygon, and open Customize Metrics in the pop-out. Under Demographic Data, set the region, pick population, median household income, or age, and select Add to Proximity Details. Each total appears for the ground inside the boundary, so one read answers how many people the market holds and what they look like. Add as many census fields as you want, and the pop-out totals them for the full catchment rather than one ZIP at a time.
Can I define a market as a set of ZIP codes?
Yes. In the Boundary Tool, choose ZIP Codes and set No Fill, then click the ZIP codes that make up the market to select them together. When someone says the market is these eight ZIP codes, those eight color as one catchment on the map. Convert Boundaries into Territories groups them into a named territory, and Combine Groups totals the set so it reads as one market. From there, Customize Metrics reports the population and income across all eight at once, not ZIP by ZIP.
How do I total a multi-ZIP trade area?
Select the ZIP codes in the Boundary Tool, then use Convert Boundaries into Territories to group them into one territory. Combine Groups merges the set into a single unit, so the map reports one total for the whole market instead of a figure per ZIP. Click the territory and open Customize Metrics, where Demographic Data sums the census population and income across the set. Spreadsheet Data does the same for your own rows, counting the accounts, patients, or sales that fall inside the full trade area.
Can I draw a catchment area that follows no boundary line?
Yes. When a market does not line up with ZIP or county borders, open the Territory Drawing Tool and trace the zone directly on the map. The drawn shape works the same as a boundary territory, so clicking it and opening Customize Metrics reads the census population and income inside. This suits a catchment defined by a river, a highway, or local knowledge rather than postal geography. You can draw several zones for competing markets and read each one's totals to compare the ground they cover.
How do I build a drive-based service area?
Open the Drive Time Polygon tool, enter the store or branch address or click its marker, and set the number of minutes someone drives to reach it. Click Add Drive Time Polygon and the shape maps the ground reachable by road. It is based on perfect driving conditions, not live or historical traffic, so the same address returns the same catchment every time. Click the polygon and Customize Metrics reads the population and income inside, giving a service area that follows roads rather than a straight-line ring.
Can I read patient origin or where my buyers come from?
Yes. Plot your patients or buyers on the map, define the catchment as a territory of ZIP codes or a drawn zone, and open Customize Metrics. Spreadsheet Data counts how many of your rows fall inside the area, so you read how many patients or buyers each defined market holds. Demographic Data adds the census population and income for the same ground, so you compare where people come from against who lives there. This turns a plain origin list into a sized, mapped market you can act on.
How do I compare two defined markets?
Build each market as its own territory or drawn zone, then click each one and open Customize Metrics to read its totals. Because each tool keeps its own set of metrics, the population, income, and your own row counts appear for each catchment separately, so you place two markets side by side on the same map. You can color each territory differently to tell them apart, and Combine Groups totals a multi-ZIP market so the comparison holds even when one market spans several ZIP codes and another spans a few.
Can I use counties instead of ZIP codes for a trade area?
Yes. The Boundary Tool offers US States, Counties, ZIP Codes, census tracts, and block groups, so you pick the level that matches how you define the market. Counties suit a wide service area, while ZIP codes suit a tighter store trade area or a zip-to-market crosswalk. Select the counties that make up the catchment, convert them into a territory, and read the population and income inside through Customize Metrics. The steps do not change with the level, so you move from counties to ZIP codes without relearning the workflow.
Do I need GIS skills to map a trade area?
No. Defining a catchment and reading who is inside is a set of menu choices, not a GIS task. You pick a boundary set, click the ZIP codes or counties that make up the market, and convert them into a territory, or you draw the zone by hand. Customize Metrics builds the demographic read from dropdowns, and Add to Proximity Details drops each total into the pop-out. Most people map their first trade area in their first session, and the US and Canada support team helps set up the first market if you get stuck.








