


Find Market Gaps & Untapped ZIP Codes to Enter Next
Which ZIP codes match your best customers but have no coverage yet? Maptive shades every ZIP by the demographics your strong markets share, then puts your own locations on top, so the same-profile areas with no markers read as the gap.
No credit card required
- Profile the ZIP codes where you already win, then read the census metrics they share through Customize Metrics.
- Shade every ZIP code in a region by those same variables with the Boundary Tool's Demographic Census Data fill.
- Plot your current locations on top, so covered and uncovered areas sit on one map.
- Read the color key for high-match ZIP codes that hold no markers, the white-space you can move into.
- Filter your points to one group or value to isolate a segment before you compare it against the shaded market.
- Cover the U.S. and Canada from one workflow, with no GIS skills and nothing to install.
Trusted by teams at









See the Markets You Have Not Entered Yet
Maptive helped us go beyond geography. The flexible analysis tools help us manage in ways beyond getting from point to point.
Building the Gap Map in Maptive
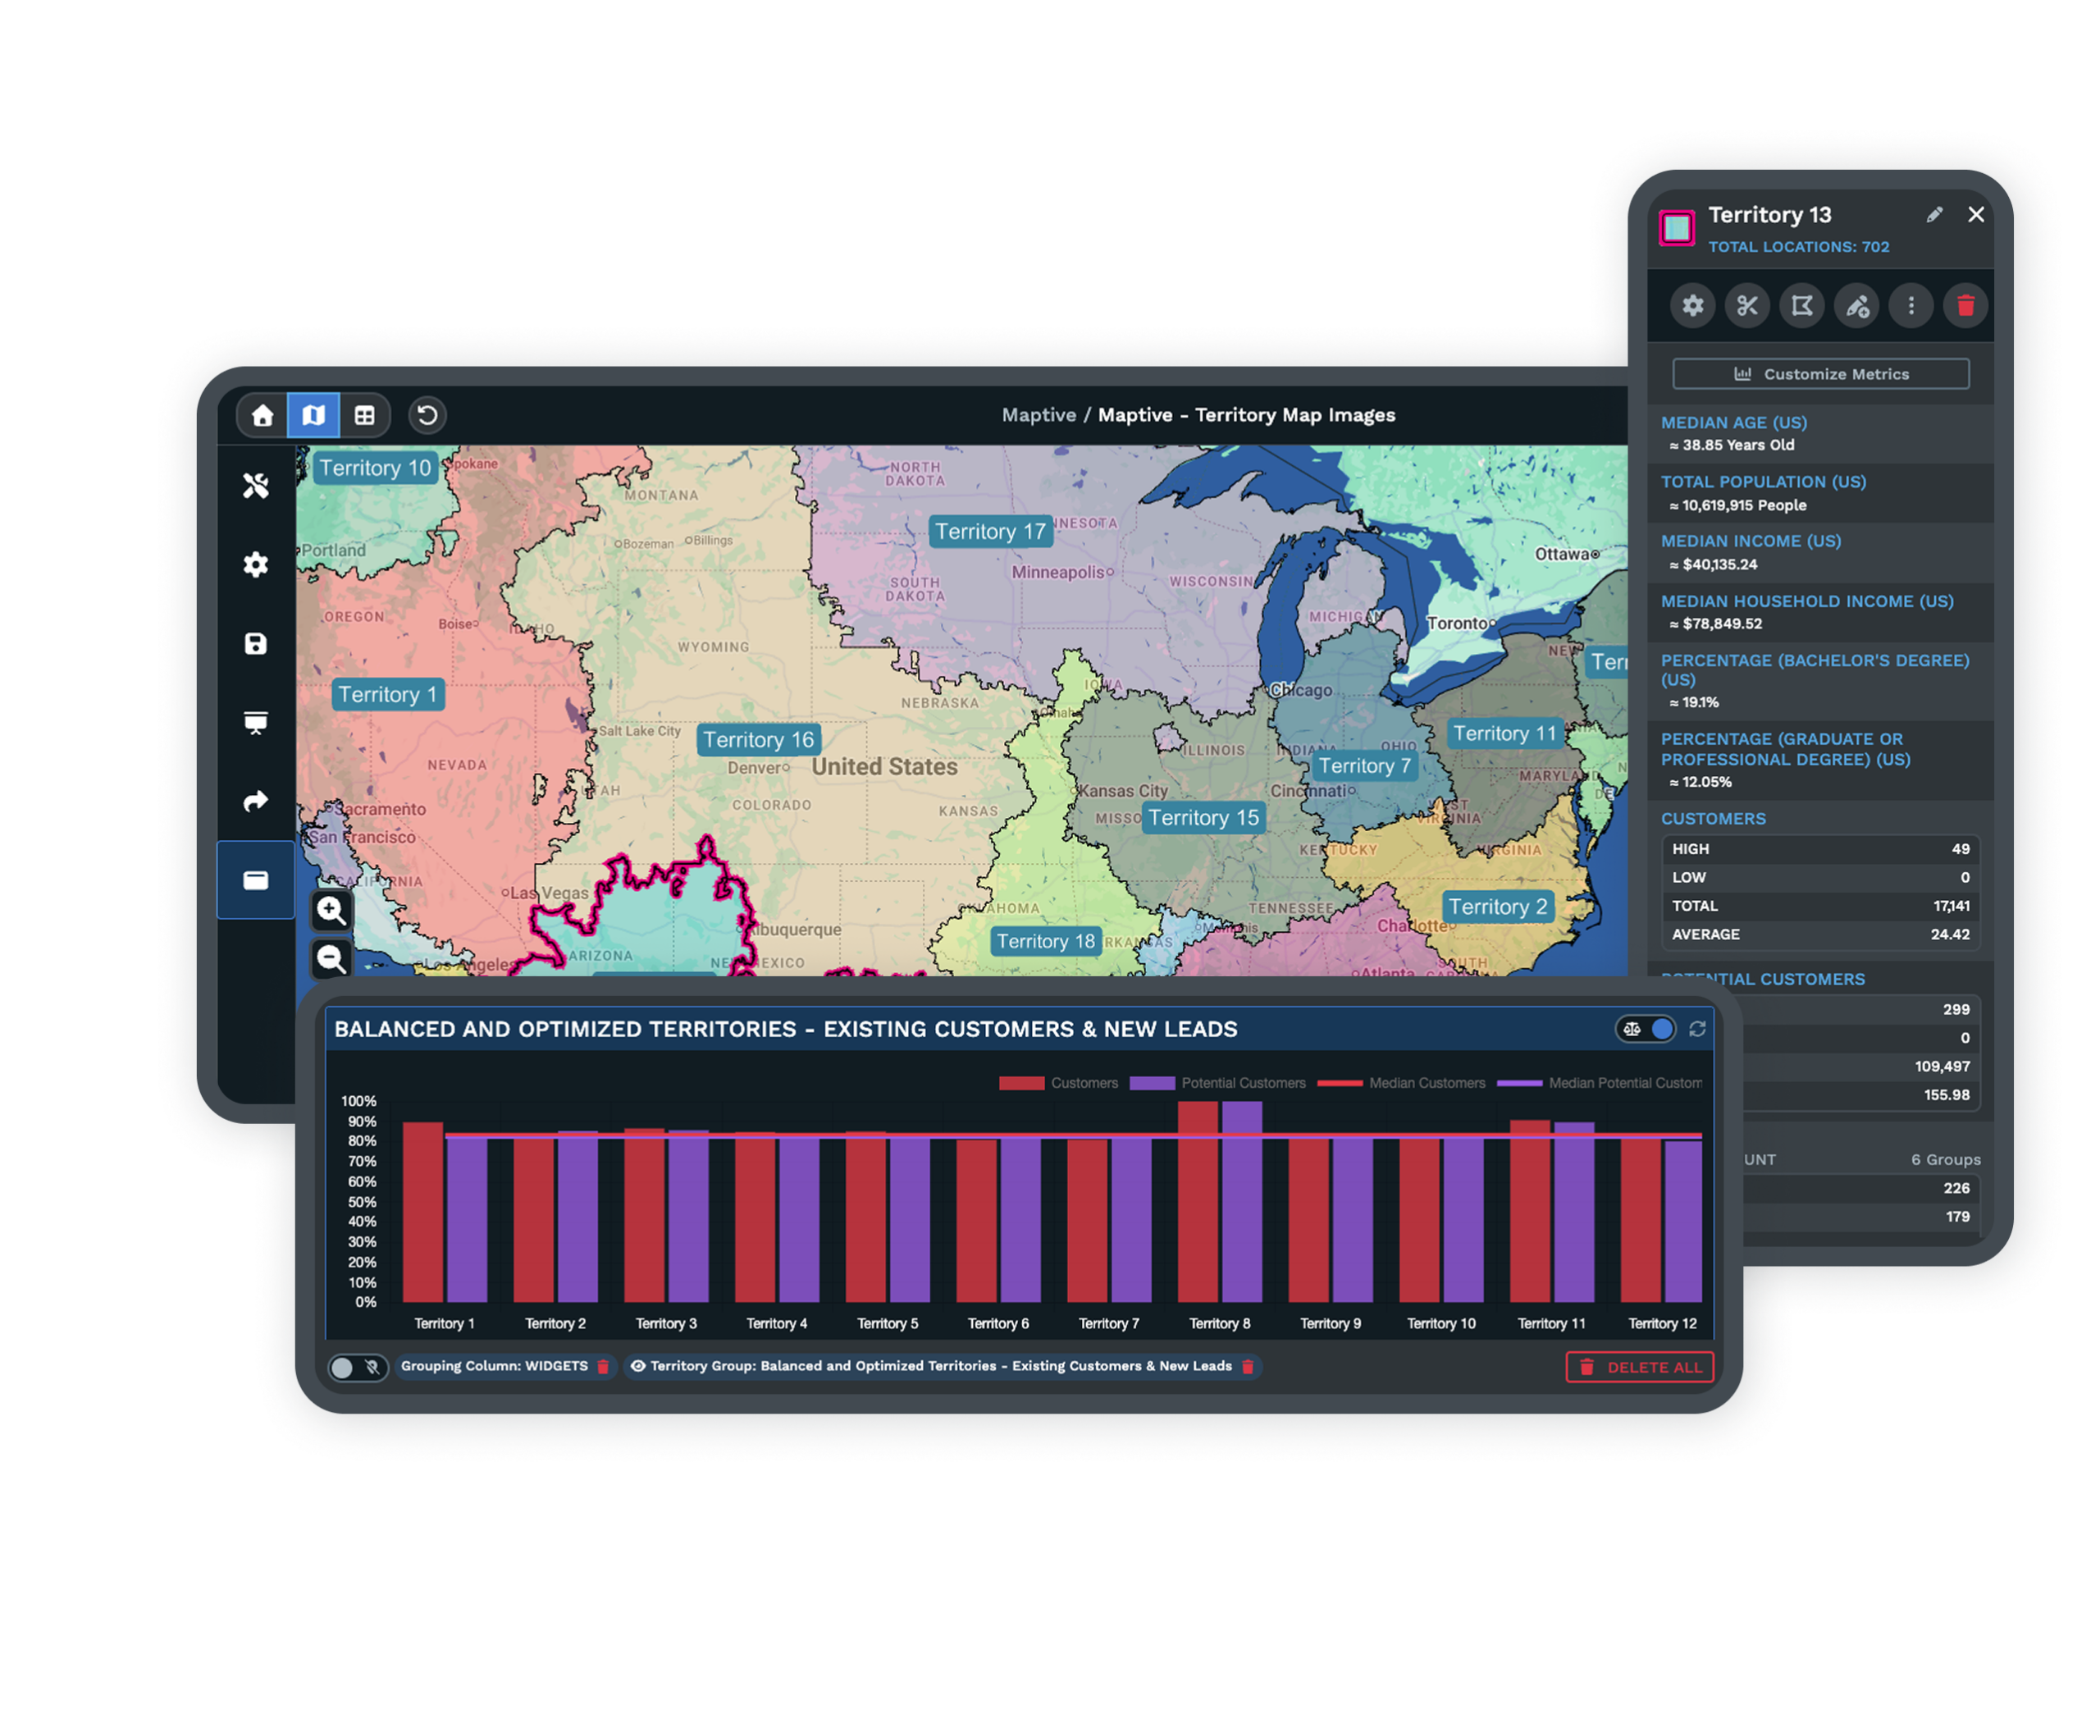
-
1
Profile Where You Already Win
Plot your locations, then click a strong ZIP code or draw a territory around your top accounts. Open Customize Metrics, set the source to Demographic Data, pick the U.S. or Canada region and a demographic group, and add the metrics your best markets share, like median household income, age, or population density.
-
2
Shade Every ZIP by Those Variables
In Map Tools, open the Boundary Tool and choose the ZIP Codes boundary set. Set the fill type to Demographic Census Data, pick the demographic group and the metric you profiled, and click Load Boundaries. Every ZIP colors by that number, with a key of ranges down the side.
-
3
Layer Your Footprint on Top
Keep your locations plotted above the shaded ZIP codes, so coverage and demand read together. Use the Filter Tool to narrow your points to one region or group. The census shading underneath stays put when you filter your markers, so only your coverage changes on screen.
-
4
Read the Key for the Gaps
Find the ZIP codes in the top range that carry no markers. Those are the high-match areas with no coverage. Click any one to confirm its census totals in the pop-out, then work down the ranges to order the opportunity.
Map Your White-Space on Your Own Data
Start the 10-day free trial with no credit card and every tool unlocked. Upload your locations, shade ZIP codes by the demographics your best markets share, and find the high-match areas you have not entered. Want a hand? A Maptive specialist will build the first gap map with you and point out the ZIP codes to watch.
No credit card required
Frequently Asked Questions
How do I find markets I'm not in yet?
Start with the ZIP codes where you already perform, and read the census metrics they share through Customize Metrics. Then open the Boundary Tool, shade every ZIP in your target region by those same variables, and plot your current locations on top. The high-match ZIP codes that hold no markers are the markets you have not entered. Click any one to confirm its demographics in the pop-out, and work down the color key to order which areas to pursue first.
Which ZIP codes match my best customers but have no coverage?
Profile your best customers first by reading the median household income, age, or density around your strong ZIP codes. Shade all ZIP codes by those metrics with the Boundary Tool's Demographic Census Data fill, then layer your locations over the top. The ZIP codes in the same color range as your winners, but with no markers, are matched areas with no coverage. The pop-out lists each one's census totals, so you can rank the closest matches before you commit to any of them.
What is market gap analysis on a map?
Market gap analysis pairs your current footprint with the demographics of the market around it, so you can see where demand and coverage do not line up. On a Maptive map, you shade ZIP codes by the census variables your best markets share, then plot your locations on top. Areas in a high-match range with no markers are the gaps, and areas already covered show both color and pins. Because the demographics come from the U.S. Census Bureau and Statistics Canada, the map reads from official figures.
How do I profile the demographics of my best ZIP codes?
Plot your locations, then click a strong ZIP code or draw a territory around your top accounts. Open Customize Metrics, set the source to Demographic Data, and choose the U.S. or Canada region and a demographic group. Add the metrics you care about, like median household income, population density, or age, and the totals appear in the pop-out. Reading two or three of your best areas gives you the profile to shade the rest of the map against, so you know which variables define a strong market for you.
Can I shade ZIP codes by the demographics my top markets share?
Yes. Open the Boundary Tool, choose the ZIP Codes boundary set, and set the fill type to Demographic Census Data. Pick the demographic group and the metric you profiled, such as median household income, then click Load Boundaries. Every ZIP code colors by that number, with a key of ranges down the side. Fill Settings let you set the number of ranges, switch value ranges to percentage ranges, and pick each color, so the ZIP codes in your target band are easy to pick out against the rest.
How do I layer my current footprint over demographic data?
Keep your locations plotted on the map while the Boundary Tool shades ZIP codes underneath them, so coverage and demand read on one view. Your markers stay on top of the fill, which means a covered ZIP shows both its color and your pins, and an uncovered ZIP shows color alone. You can also layer markers from one map with a boundary fill built on another, so a high-match area with no presence is easy to spot.
Can I filter my locations before comparing against the market?
Yes. The Filter Tool narrows your markers to one region, group, or value range, so you compare a single segment against the shaded ZIP codes rather than your whole list. Because the fill under your points comes from census data, it does not change when you filter your markers, so only your coverage moves on screen. That makes it easy to check one product line or one sales team against the market it should own, then reset the filter and repeat for the next segment.
What demographics can I use to find white-space?
Maptive includes more than 50 U.S. Census variables at five levels, from state and county down to ZIP code, census tract, and block group, plus Canadian census data in the same product. To find white-space, shade by the variables that define your best markets, such as median household income, population density, age, or household composition. A growing library of market data adds spending and household detail alongside the census figures. You can profile on one metric or add several through Customize Metrics, then read each ZIP against the market around it.
How do I prioritize which untapped ZIP codes to enter first?
Once the map is shaded and your footprint is on top, read the color key from the top range down. The uncovered ZIP codes in your highest-match band are the closest fit to your best markets, so they lead the list. Click each one for its census totals in the pop-out, and add a second metric through Customize Metrics if you want a tie-breaker, such as density behind income. From there you can export the map image or your data to hand a ranked target list to the team.
Do I need GIS skills to find market gaps?
No. Every step here is a menu choice, from the Demographic Census Data fill in the Boundary Tool to the metrics you add through Customize Metrics. You upload a spreadsheet, and Maptive geocodes messy addresses and missing ZIP codes for you, so your points land in the right place without cleanup. Shading the market, layering your footprint, and reading the gaps take no code and nothing to install. Most people build their first gap map in one session, and the U.S. and Canada support team will set up the first layer with you.








