


Pull Population & Income Within a Radius or Drive Time
How much population is within five miles of this address, and can I read the income inside that ring? Maptive drops a radius or a drive-time polygon around any location and reads the census population, income, and counts inside it.
No credit card required
- Drop a radius ring around any address, marker, or map click, sized in miles or kilometers.
- Draw a drive-time polygon in hours or minutes to size the area people can reach by road.
- Read census population, income, age, and household counts inside the shape from Customize Metrics.
- Sum or count your own rows inside the same area, from account value to store count.
- Apply one radius to a whole group to ring every location at once for fast market sizing.
- Export every location that falls inside a radius or drive-time area to a spreadsheet.
Trusted by teams at









Size the Market Around Any Location
Maptive is essential to how we understand the global distribution of our leaders, helping us reduce unnecessary travel time and costs.
Building It in Maptive
-
1
Draw a Radius Ring
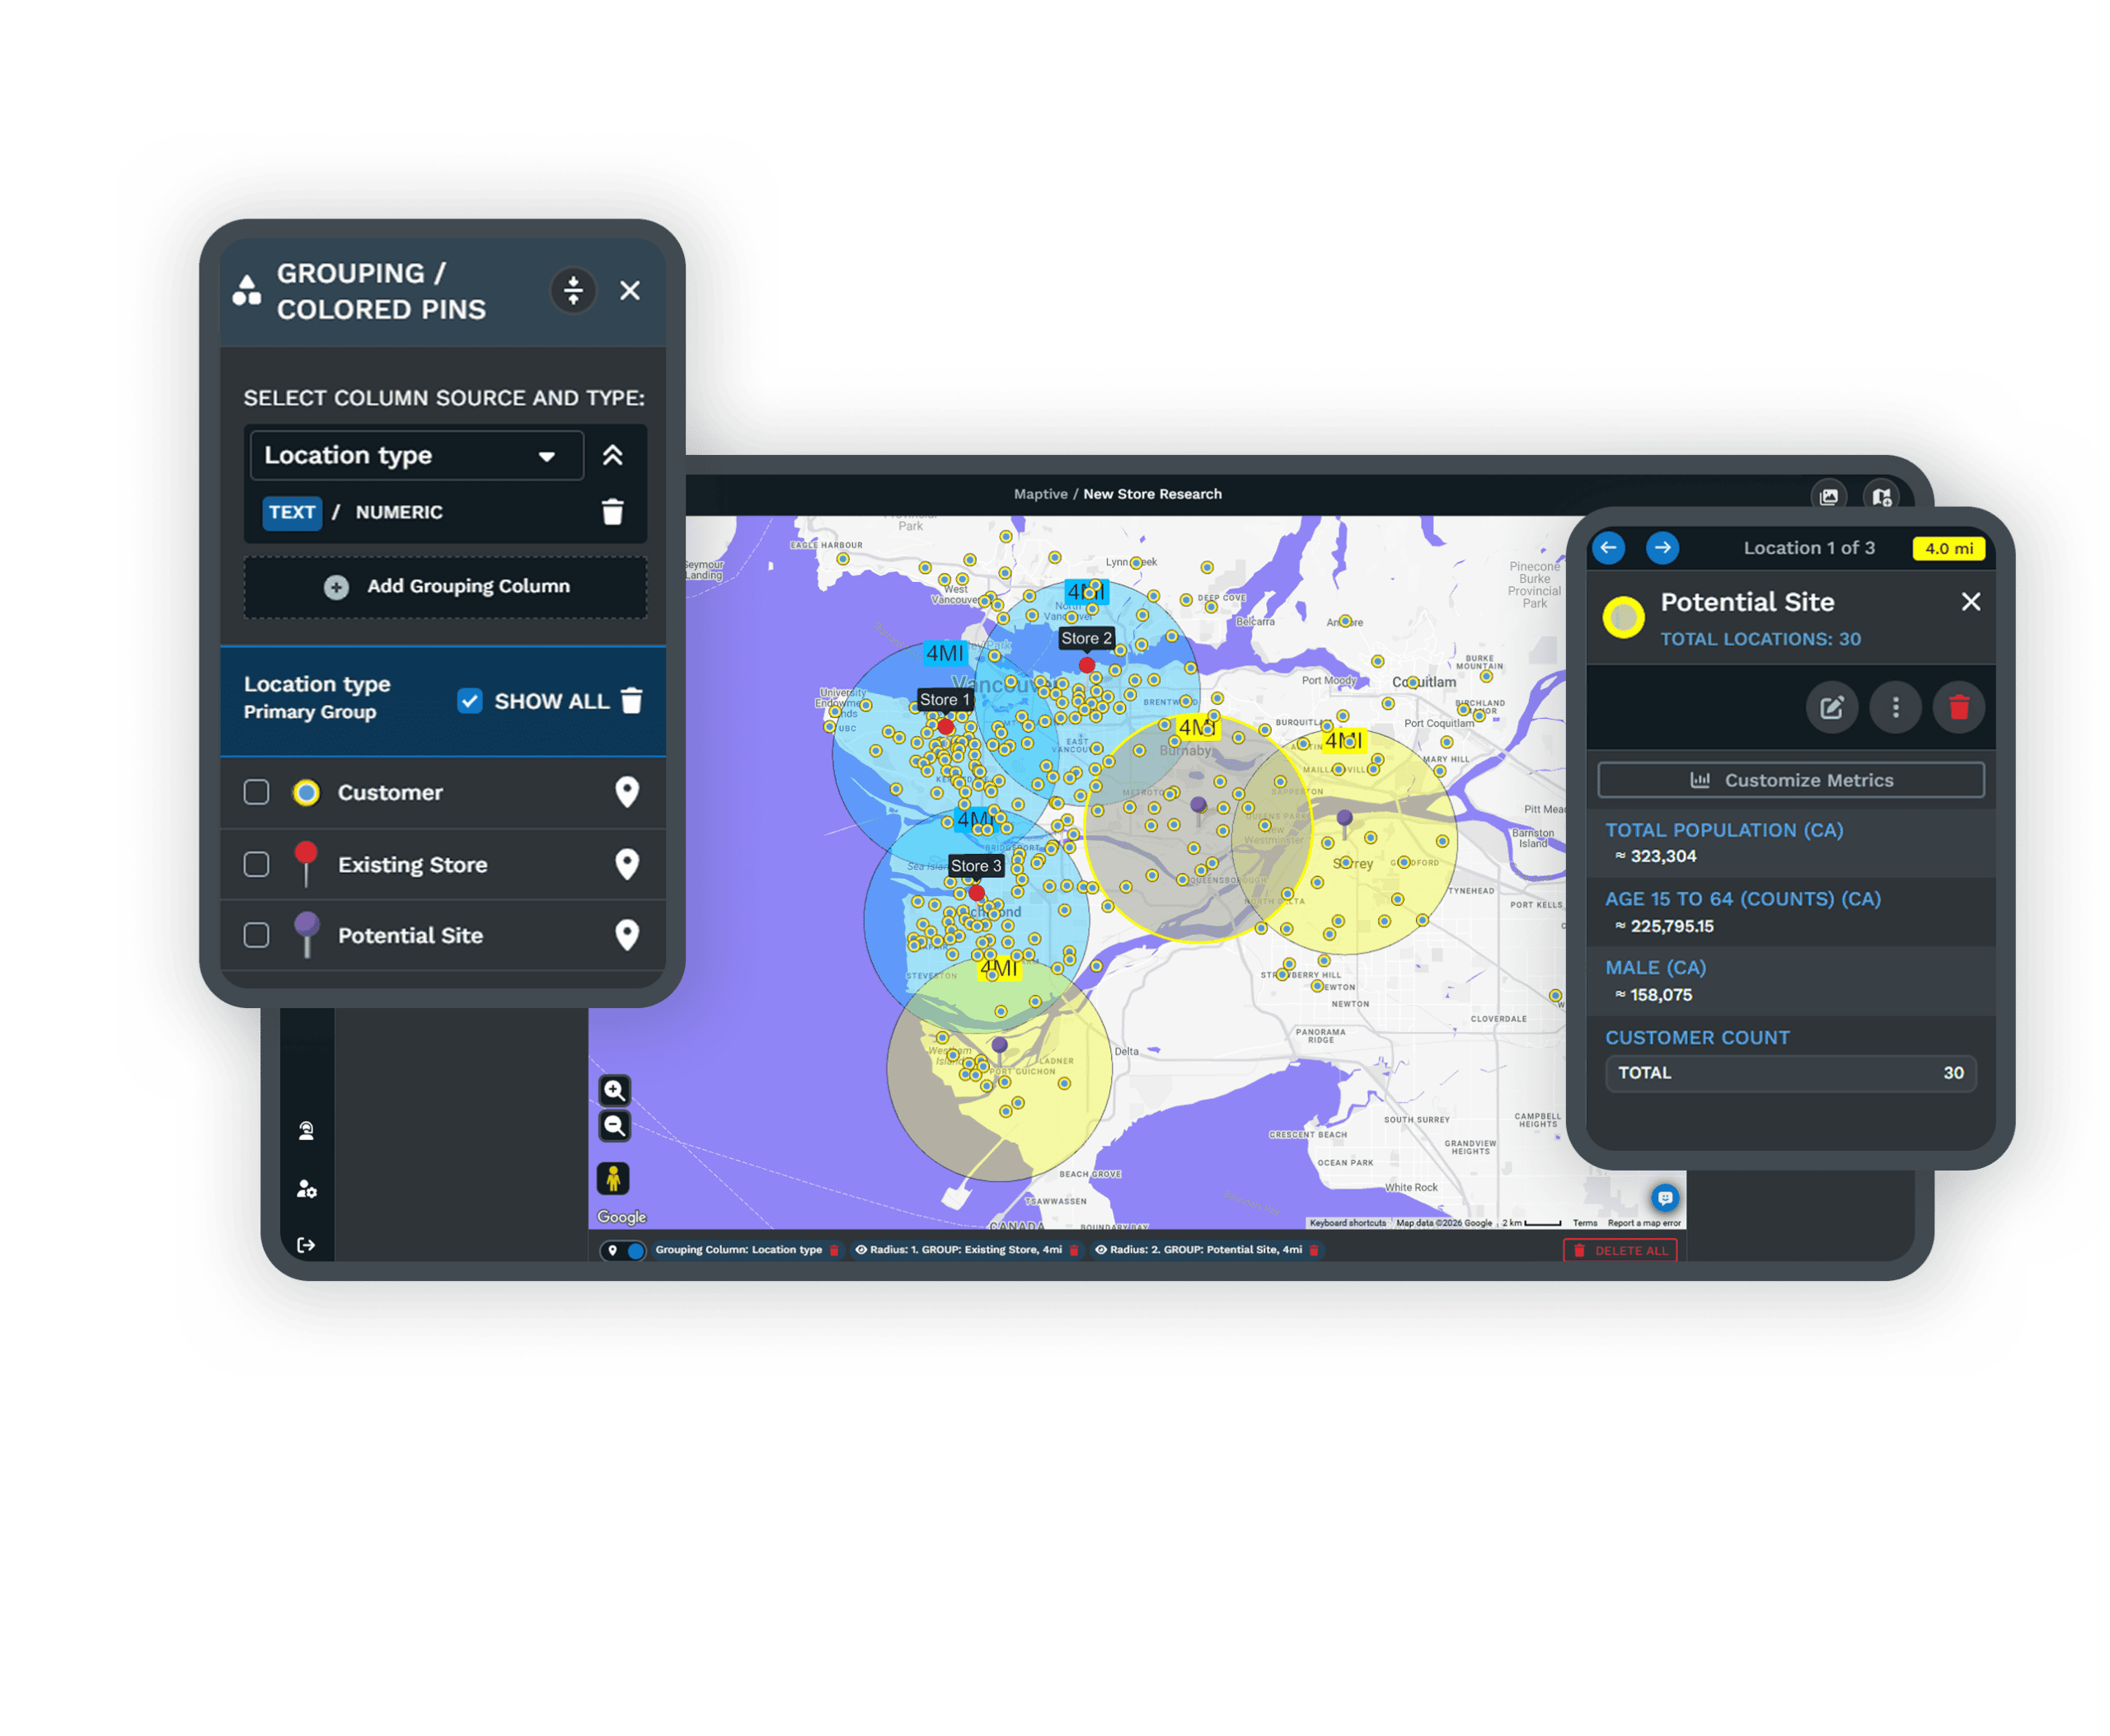
Open Map Tools and pick Distance Radius Circles. Center the ring by typing an address, clicking the map, or picking a marker, then set Proximity Within in miles or kilometers. Click Add Proximity Radius. To ring every site at once, set Apply To Group and choose the group-column value.
-
2
Or Set a Drive-Time Polygon
For a reachable area rather than a straight-line ring, open Drive Time Polygon, enter an address or click a marker, and set the hours and minutes. Click Add Drive Time Polygon. The shape is based on perfect driving conditions, not live or historical traffic, so it maps a steady reach around each point.
-
3
Pull the Demographics Inside
Click the radius or polygon and open Customize Metrics in the pop-out. Under Demographic Data, set the region to the US or Canada, pick the demographic group, choose the metric like population or median household income, and select Add to Proximity Details. Add as many fields as you want.
-
4
Add Your Own Numbers and Export
In the same pop-out, Spreadsheet Data sums or counts your columns inside the area, from account value to store count. To pull the list itself, export the locations inside the radius or drive-time to xlsx, csv, or the clipboard, with a straight-line or driving-distance option.
Size a Market in Your First Session
Begin the 10-day free trial with no credit card and run it on your own address list. Open the Distance Radius Tool, ring a location, and read the population and income inside within a minute. Want a hand? A Maptive specialist will size your first trade radius alongside you.
No credit card required
Frequently Asked Questions
How much population is within 5 miles of an address?
Drop a radius on the address through Distance Radius Circles and set Proximity Within to 5 miles. Click the ring, open Customize Metrics, and under Demographic Data pick population, then Add to Proximity Details. The total for everyone inside the 5-mile ring appears in the pop-out and updates if you resize the circle. You can add income, age, or household counts to the same read, so one ring answers how many people are near the site and what they look like.
Can I pull income inside a drive-time area?
Yes. Draw a Drive Time Polygon around the address, click it, and open Customize Metrics. Under Demographic Data, set the region, choose the income group, and pick median household income, then Add to Proximity Details. The income figure for the area someone can reach by road appears in the pop-out. Because the polygon maps reachable ground rather than a straight-line ring, the income read matches the catchment a store or branch actually draws from, not a circle that ignores roads and rivers.
How do I estimate US population coverage around each location?
Plot your locations, then ring them with the Distance Radius Tool and set Apply To Group so every marker in the group gets the same-size ring at once. Click any ring and read the population inside through Customize Metrics. Repeat across the group to compare coverage site by site, or export the locations inside each ring for a full count. This gives a fast read on how much of the US population your footprint reaches without pulling a separate census table for each address.
What is the difference between a radius and a drive-time polygon?
A radius is a straight-line circle of a set distance, so a 10-mile ring reaches 10 miles in every direction regardless of roads. A drive-time polygon maps the area a driver can reach in a set number of minutes, so it follows the road network and bends around rivers, highways, and dead ends. Rings suit quick, even market sizing. Drive-time shapes suit catchment questions where travel matters, like how far customers will drive to a store. Both read demographics the same way through Customize Metrics.
Does the drive-time area use live traffic?
No. The Drive Time Polygon is based on perfect driving conditions, not live or historical traffic. It maps a steady reach around each point, so the same address returns the same shape every time rather than moving with rush hour. That makes it a dependable base for market sizing and site comparison, where you want a consistent catchment rather than a snapshot of one moment. Set the time in hours and minutes, and adjust it to test a 10-minute against a 20-minute reach around the same location.
Can I add a radius around every location at once?
Yes. On the Distance Radius Tool, set Apply To Group and pick the group-column value, and Maptive draws the same-size ring around every marker in that group. One setting rings a whole store list, sales territory, or candidate-site set, so you size them on the same basis instead of drawing circles one by one. Each ring reads its own demographics through Customize Metrics, and you can export the locations inside every ring together for a combined count across the footprint.
Which demographics can I read inside a ring?
Customize Metrics reads from more than 50 US Census variables, covering population, median household income, age, and household composition, at levels down to the block group. Canadian census data works the same way through the region toggle. A growing library of market data adds spending and household detail alongside the census figures. Pick as many metrics as you want and Add to Proximity Details, and each one lists its total for the area inside the ring, so a single pop-out answers who is inside and what they earn.
Can I export the locations inside a radius or drive-time?
Yes. A radius and a drive-time polygon both export the rows that fall inside them to xlsx, tsv, csv, or the clipboard. For one circle, use the kebab menu and Export Locations. For every circle at once, use Export File. You choose straight-line or driving distance, markers inside or outside the shape, and a closest-circle option when rings overlap. A drive-time polygon can also export the ZIP codes or counties that fall fully or partly inside it, so you hand off a boundary list along with the point list.
Can I size a trade area in Canada too?
Yes. Rings and drive-time polygons work anywhere on the map, and the demographic read switches country through the region toggle in Customize Metrics. Set the region to Canada and the pop-out reads Statistics Canada figures for population and income inside the shape, the same way it reads US Census data south of the border. A team that sells on both sides works from one map instead of a separate file per country, and the ring or polygon steps do not change from one country to the next.
Do I need GIS skills to pull radius demographics?
No. Ringing a location and reading the people inside is a set of menu choices, not a GIS task. You pick Distance Radius Circles or Drive Time Polygon, set a size, and click the shape. Customize Metrics builds the demographic read from dropdowns, and Add to Proximity Details drops each total into the pop-out. Most people size their first market in their first session, and the US and Canada support team helps set up the first ring if you get stuck. Nothing installs and no code is needed.








