
Two branches of one retail chain can have identical square footage and an identical product mix. One location still outperforms the other by a wide margin every quarter, and a map usually already has the real explanation.
The manager watching that gap blames staffing or shelf layout first. What the map shows is a trade area the road network carved, holding a population that differs from the neighbor’s by income and by the hours of the day it is there.
Why Does a Customer Pass a Closer Store for a Farther One?
A customer’s likelihood of choosing a given store falls as travel time to it rises, and it climbs when the store is more attractive than its neighbors. Those two variables trade against each other. A farther competitor with a bigger footprint can beat a closer store on that exchange. A same-footprint comparison hides that trade-off. David Huff formalized the relationship in the 1960s. The geography around each store sets how many people are close enough to choose either one.
The Rings That Make Up a Store’s Real Trade Area
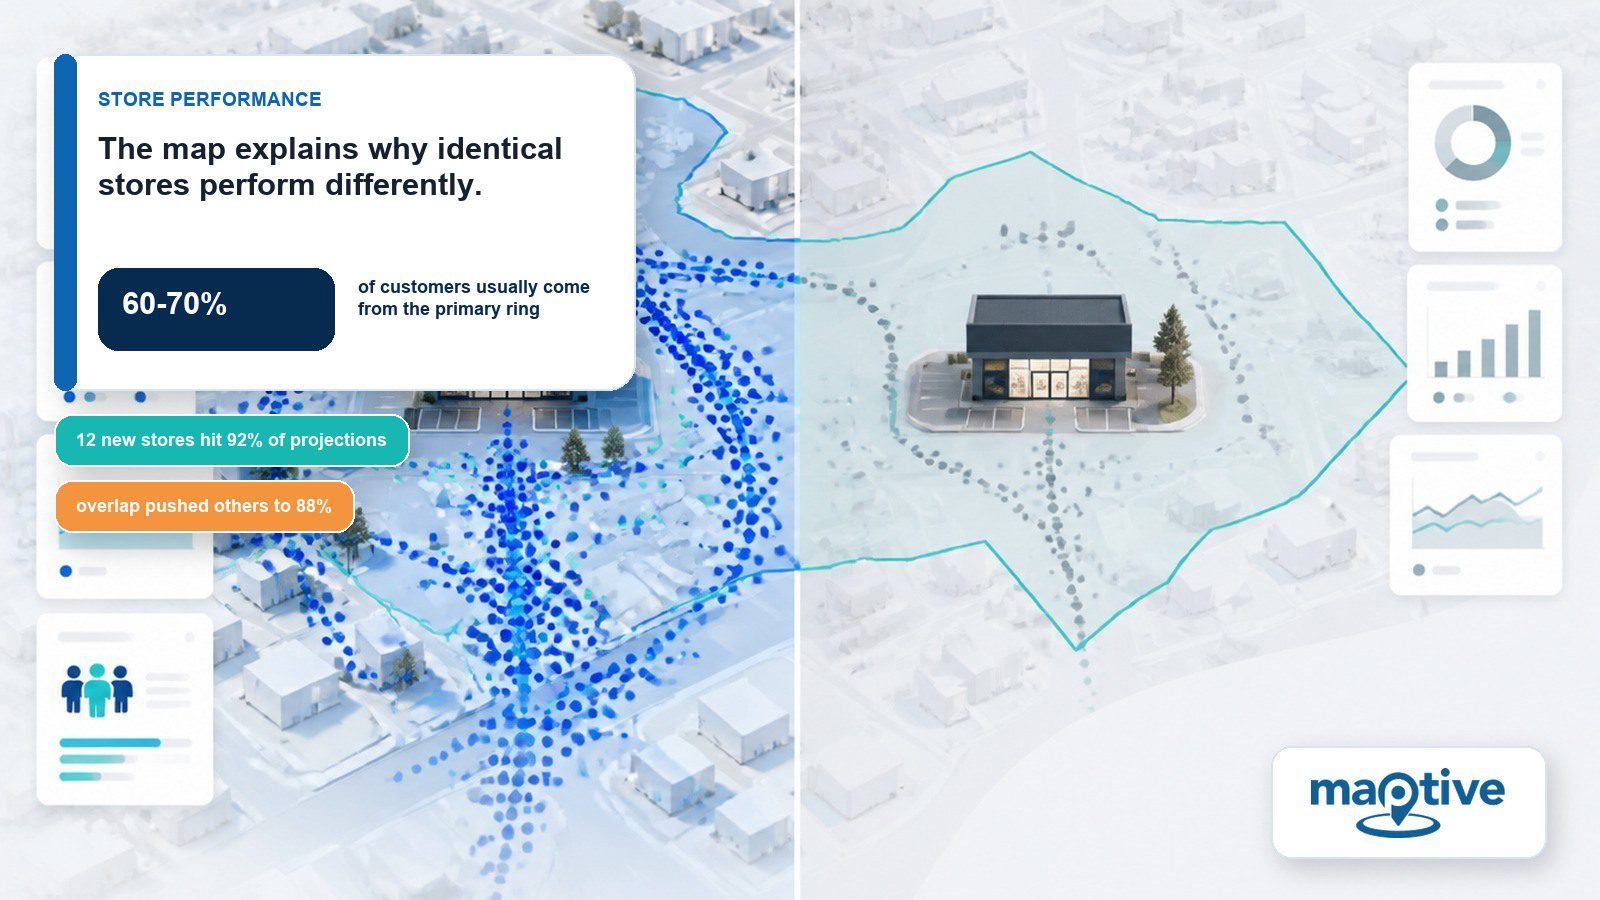
Analysts typically describe a store’s customer base as a set of concentric rings. The primary ring accounts for roughly 60 to 70 percent of a store’s customers, the ones who visit often because the store is genuinely close. The secondary ring covers the next 20 to 25 percent, people who visit less because a closer alternative usually exists for them. The tertiary ring covers everyone left over. Most are occasional visitors or people passing through, with a smaller share showing up for one specific reason and rarely returning.
When the primary ring holds less than 60 percent of the real customer base, the assumed trade area no longer matches reality.
One spatial analyst ran into this mismatch directly while building a trade area for a retail client. The client wanted a simple radius on the slide, since a circle is easy for a room full of executives to read, but the store’s real trade area was an irregular outline carved by the surrounding road network. The analyst ended up reverse-engineering a stand-in radius, the average distance out to that outline’s edges, to keep the presentation legible without pretending the underlying draw was round to begin with.
That kind of gap changes what a comparison between two branches is even measuring. A store scored against a radius that never matched its real trade area gets judged against demand that was never within reach of its door.
How Far Apart Do Sibling Stores Need to Be?
Cannibalization is the drop in sales or traffic at an existing store that follows when a brand opens a second location nearby and draws from customers the existing store already had. A new location can sit well outside a straight-line radius from its sibling and still take that sibling’s customers. Overlapping trade areas are the requirement, and drive time draws those areas along the road network.
Within roughly a 10-minute drive of a new opening, a sibling store shows a sales decline within three to six months. Comparable stores with no new neighbor stay flat across those months, which rules out a soft market.
Twelve new locations opened at 92 percent of their revenue projections. Fifteen existing stores inside the overlapping trade areas fell to 88 percent of the prior year’s sales once those openings arrived. Portfolio margin dropped while store count rose.
Market saturation is the same problem measured across a whole trade area, the point where opening another location pulls more revenue from existing stores than it adds in new sales. Competitive density climbing past a brand’s own historical benchmark signals it too.
How Much Does a Nearby Competitor Cost a Store?
Roughly 80 million transactions, about $2 billion in sales across 25 months at a major U.S. department store chain, give the strongest available reading on what a nearby competitor costs. Serkan Akturk and Michael Ketzenberg published the finding in 2022. Locations closest to a competitor store that later closed saw their own sales rise once it was gone.
Yet the effect is uneven across what is being sold. A 2025 supermarket study put the median impact of a nearby competitor between 0.4 and 0.9 percent depending on the product category, so a single flat figure for what a competitor down the street costs a store does not hold.
Clusters of similar stores turn an area into a destination and pull more total foot traffic into it. Every store in that cluster shares the bigger pool of shoppers it creates, which is why proximity to competitors can work in a store’s favor.
Standing too close to one dominant competitor inside that cluster produces a different outcome. The dominant store captures most of the new traffic. An individual store’s share can shrink while the cluster around it keeps growing. Share of the cluster catches that turn.
The Customers Only a ZIP Code Map Counts
Employees notice the customers who walk in, and the customers who walk in are disproportionately the ones the store was already built for. A merchandising profile can stay wrong for years while the floor keeps confirming it, one familiar customer at a time.
Transaction data mapped by customer ZIP code counts buyers by where they live. The exercise rarely happens until competitive pressure forces it. An apparel brand whose stores and marketing both assumed a young urban professional with no children can find a large part of its revenue coming from middle-aged parents in suburbs and small towns, many of them mothers who had scaled back work hours or left the workforce.
The correction shows up in the next site search. Smaller markets that match the real customer come into range. Other brands are not bidding there. That map also shows where competitors are expanding, so the next site can be chosen out of that path.
Stores Where Daytime Population Falls Below the Residential Count
Daytime population, the count of people present in an area during business hours, often looks nothing like the count of people living nearby overnight. A store can carry a strong residential count inside its radius and see few of those people during the hours it is open, because the two counts describe different crowds at the same address. A downtown location surrounded by office buildings sees heavy traffic on weekday afternoons and little of it in the evening. Behind a residential neighborhood, a suburban store of the same size fills up in the evening, once people are home from work.
Judged against the neighborhood’s headcount, a store can be called understaffed when it is sized correctly for the much smaller number of people present while it’s open for business. Daytime population counts settle which reading is right.
The Three Numbers That Set a Store’s Demand Ceiling
Three numbers set the ceiling on any given location. Population and income between them fix how much money is within reach of the door, and competitive density accounts for how much of that money is already spoken for.
Plenty of people and little disposable income in one neighborhood produce foot traffic that never converts into sales. The door count reads high all day for exactly that neighborhood.
Coresight Research counted 7,327 store closures across the United States in 2024, up 57.8 percent year over year. Some of the biggest names behind that figure were closing specific underperforming locations while the rest of the business kept operating. Macy’s is closing about 150 underproductive stores through 2026 while Bloomingdale’s, its own luxury arm, is reported as thriving over the same period. Those closures are location-specific inside companies that are otherwise healthy, and a map is usually the first place that shows which locations and why.
Checking the three numbers once produces an answer with a short shelf life, because none of the three stay fixed for long. A competitor opens or closes. New housing or a departing employer resets a neighborhood’s income, and the population that was there a year ago moves on with a new one behind it.
Running that check on two branches of matched footprint and product mix means pulling a radius band around each store, then layering income and competitor data for that band on top. What used to take three spreadsheets shows up on one map. Maptive’s radius bands and Heat Mapping Tool are built for that comparison. Often the branch that looked like a staffing problem turns out to have the lower demand ceiling. The staffing review booked for it can be canceled, and the site search for the next location takes its place.
Frequently Asked Questions
Why do some stores perform better than others?
Performance gaps between comparable stores usually trace to an imbalance across three forces. Customer density and income in the surrounding area explain part of it, and competitive pressure explains the rest, more often than any single visible factor like store size or staffing.
What is trade area analysis?
Trade area analysis defines the geographic zone a store draws most of its customers from. Analysts typically split it into a primary ring holding 60 to 70 percent of customers and a secondary ring for the next 20 to 25 percent. Everyone beyond that, the occasional visitors passing through, falls into a third, outer ring. The whole zone then gets studied for its demographics and competition, and what those two things mean for demand.
What is the difference between a trade area and a catchment area?
The two terms are used interchangeably in retail site selection. Both describe the geographic area a location draws its customers from. Analysts most often map that area by radius or by drive time. Some go a step further and build it directly from actual customer origin data instead, which gives a more accurate picture once a location is already open.
What is retail cannibalization?
Cannibalization differs from ordinary competitive pressure because the two stores pulling from one set of customers belong to the same company. A decline at one location moves the brand’s own numbers around internally, with no outside competitor capturing the difference. Some brands accept a degree of it on purpose when a new location is expected to grow the total market enough to offset what the older store gives up.
How do you tell if a new location is cannibalizing an existing one?
The same diagnostic works two ways. Analysts run it after a new store opens, tracking same-store sales at nearby locations for a decline within three to six months. They can also run it before signing a lease, checking if a candidate site already falls within a 10-minute drive of an existing location, which flags the risk before it becomes a real decline.
What is market saturation in retail?
Market saturation is the point at which a trade area has enough stores serving existing demand that another location mostly redistributes revenue away from existing stores, adding little real new demand of its own. Analysts often confirm it by comparing a brand’s store count per 10,000 residents in the category against its own historical benchmark or the category’s national average.
Does competition near a store hurt or help its sales?
It depends on degree and category. Moderate competition can validate demand and build a destination cluster that benefits every store in it. Proximity to one dominant competitor, or too much competition relative to demand, usually suppresses an individual store’s share. A 2025 supermarket study found competitor-proximity effects ranging from roughly 0.4 to 0.9 percent in sales, depending on the product category.
What is daytime population and why does it matter for store performance?
Daytime population measures how many people are present in an area during business hours, as opposed to who lives there overnight. A downtown site near offices and a suburban site near housing can report similar residential population counts while seeing sharply different traffic during the hours a store is open. Staffing built around the residential number alone often misses the real pattern.
What is a primary trade area?
The primary trade area is the zone closest to a store where 60 to 70 percent of its customers originate, the high-frequency visitors who generate most of a location’s revenue.
What causes one branch of the same company to underperform a comparable branch?
The most common causes are an imbalance between population and income relative to competitive density in the trade area, a gap between the store’s assumed and true trade area, cannibalization from a nearby sibling store, and a demographic profile that doesn’t match the brand’s real customer despite similar traffic counts.
Is market saturation the same as having too many stores?
No. A market can look full by total competitor count and yet have room for a different price point, or for hours of the day the current stores aren’t serving. Saturation compares competitive supply against estimated demand within a defined trade area, and that comparison is what a site decision runs on.