




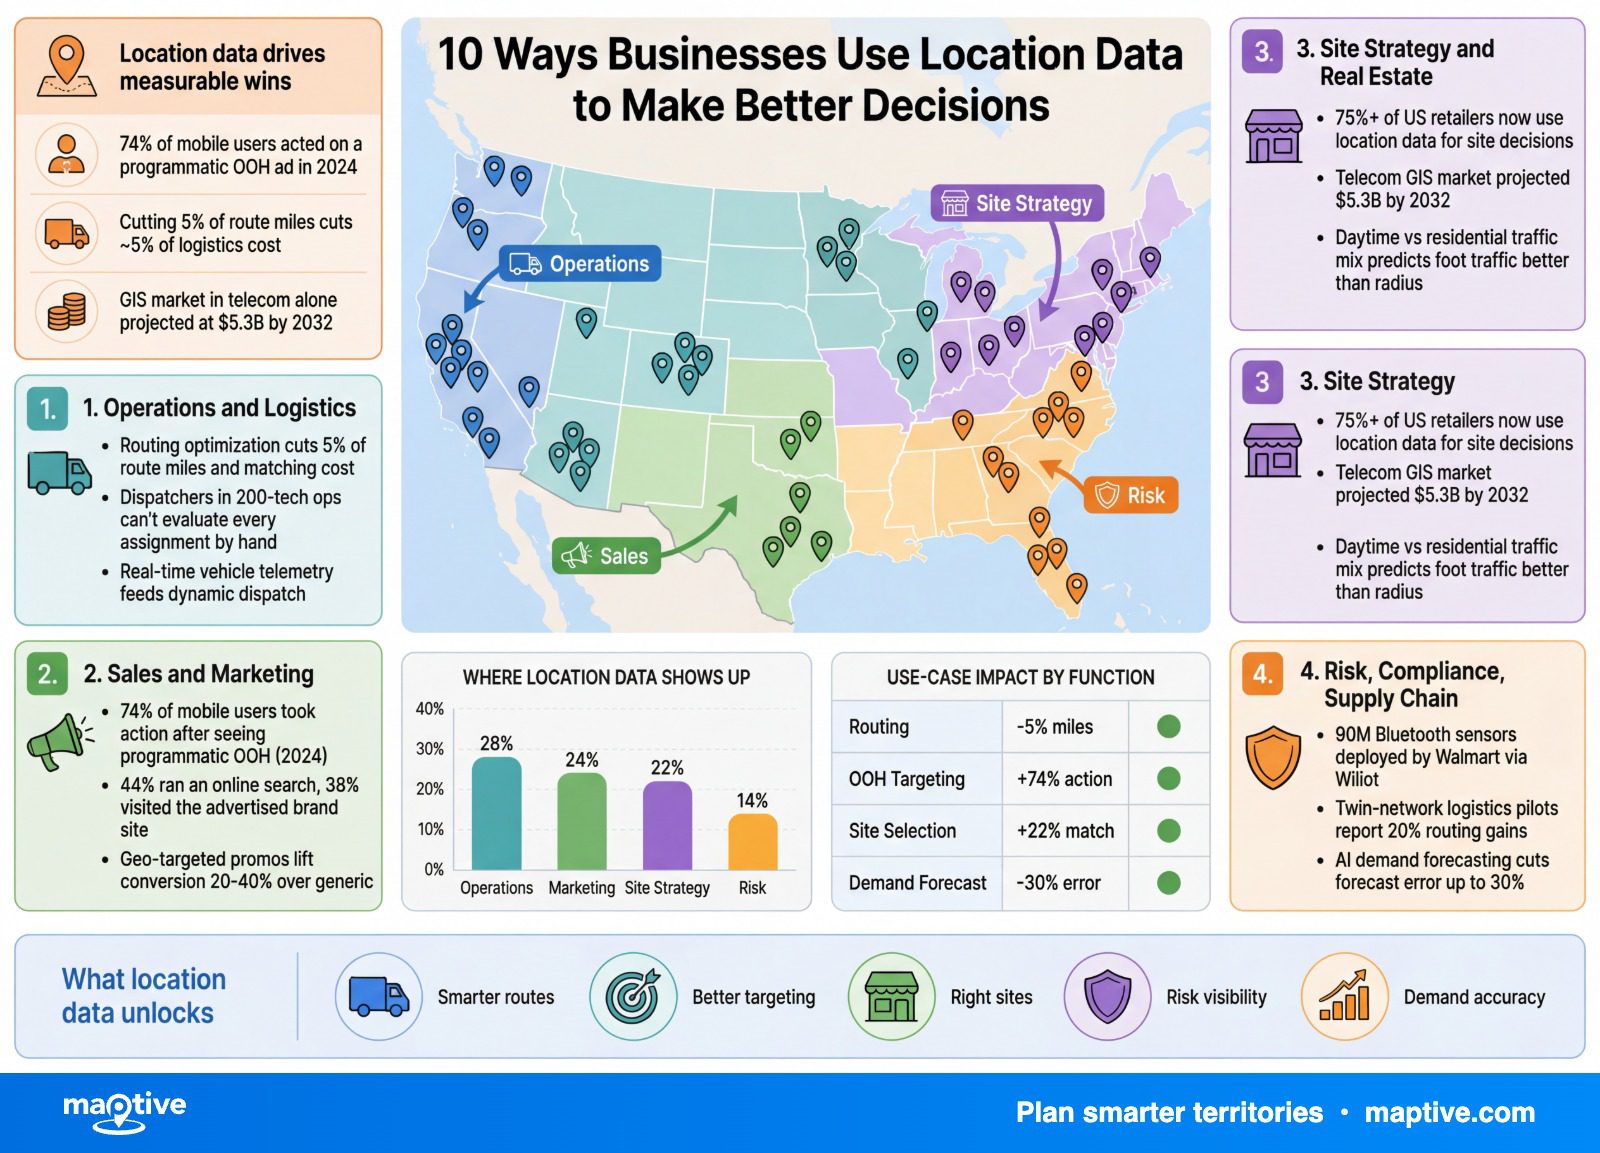
Location data is any piece of business information tied to a coordinate, address, or geographic boundary, and companies use it to plan where to sell, deliver, build, hire, and price.
The clearest illustration is UPS. The carrier’s ORION routing system evaluates more than 200,000 routing options per driver per day. The 2024 dynamic-ORION upgrade trimmed an additional 2 to 4 miles from each driver’s daily route, removing roughly 100 million miles a year from the network. Full ORION deployment saves an estimated $300 to $400 million annually, along with 10 million gallons of fuel and 100,000 metric tons of CO2.
What follows is a grouping of 10 high-value use cases across four areas of the business. Operations, sales and marketing, site strategy, and risk and supply chain each draw on the same underlying data in different ways.
Operations and Logistics
Operational use cases produce the most direct, measurable ROI from location data, since a small efficiency gain compounds across every route, technician, or shipment.
Route Optimization for Fleet Delivery
Fleet route optimization assigns stops to vehicles, sequences them, and adjusts in real time as orders, traffic, and time windows change. UPS ORION is the marquee case, but it is not unusual. DHL’s Greenplan dynamic routing reports a 20% reduction in delivery cost. Tesco’s AI-driven home-delivery routing saved 11.2 million miles in a year and cut fuel use by 8% per order. More than 70% of logistics firms have adopted software-based route optimization, with reported efficiency gains averaging around 22%.
The size of the opportunity is structural. Fuel, labor, and vehicle wear scale linearly with miles driven. Cutting 5% of route miles cuts close to 5% of those costs. For a national carrier with a fleet in the tens of thousands, that translates into hundreds of millions of dollars per year, which is why the route-optimization software market is forecast to grow from roughly $7.93 billion in 2024 to $25.75 billion by 2033.
Last-Mile and Pin-Drop Delivery
Last-mile delivery is the final leg from a depot or store to the customer. Different studies put its share of total logistics cost between 28% and 53%, depending on shipment size and density. That spread is why the segment attracts the most location-data investment.
Domino’s runs three location-driven systems at once. Its Pinpoint Delivery feature, launched in 2023 and expanded in 2024, uses Google Maps to deliver to a customer’s dropped pin rather than a street address, which extends coverage to parks, beaches, and apartment complexes without numbered units. An AI Cook Zone geofence around each store delays pizza preparation until the customer crosses a defined ring, so food does not sit cooling. A separate franchise-territory model, built with Precisely’s location-intelligence tooling, governs which store handles which household and reduces legal disputes between franchisees.
Field Service Dispatch
Field service dispatch matches technicians to jobs across a region. Modern platforms run thousands of assignment scenarios per work order and score each technician on skill match, conversion or upsell history, current location, traffic, and time-window risk. The output is a job board the dispatcher can override but rarely needs to.
Operators using machine-learning dispatch report higher completed-jobs-per-technician, lower fuel cost per route, and tighter customer ETA accuracy than those running rule-based or manual dispatch. The gains apply equally to HVAC, plumbing, telecom installation, and medical device service, since the underlying constraints are the same. A dispatcher in a 200-technician operation cannot evaluate every possible assignment in real time. The software can, and it re-scores the board every few minutes as new jobs come in and trucks move.
Sales and Marketing Applications
Location data reshapes how revenue teams design coverage, segment customers, and place media. The same dataset that informs an ops manager about routes informs a CMO about catchments.
Sales Territory Design
A sales territory is the geographic and account boundary one rep or franchisee owns. Designed poorly, territories produce overlap, gaps, drive-time waste, and quota miss. The Sales Management Association’s 2024 survey reported 58% of B2B companies rate their current territory design as ineffective.
Modern territory tools visualize candidate boundaries at the block-group level, overlay population and movement data, model competitor proximity, and balance for reachable households or accounts per rep. Domino’s franchise model is a good public example, with territory areas drawn around reachable households then refined by socioeconomic data, producing boundaries franchisees accept because the math is auditable. Maptive supports the same workflow for sales teams that need to draw, balance, and assign territories on top of customer and prospect data.
Customer Segmentation by Geography
Geographic segmentation groups customers by where they live or work. Layered with demographics, income, age, and lifestyle, it becomes geodemographic segmentation, which drives regional pricing, store assortment, and creative variation. Roughly 22.6% of companies using customer segmentation say geography is their primary segmentation type.
Real-time mobile, GPS, Wi-Fi, and IP signals now feed segmentation models continuously rather than once a quarter. A national chain can spot a sudden lift in visits from a specific suburb and route an offer to that ZIP code within hours, then retire the offer when the lift cools.
Geo-Targeted Marketing and OOH
Geo-targeted advertising delivers different creative to different people based on where their device is, where they have been, or where they are heading. Out-of-home advertising revenue passed $9 billion in 2024 for the first time, driven largely by location-enabled programmatic screens. Adding location-based targeting to a campaign raises OOH ROI by 15% to 40% in published case studies.
The behavioral evidence is consistent. In 2024, 74% of mobile device users reported taking an action on their phone after seeing a programmatic OOH ad. Of those, 44% ran an online search and 38% visited the advertised brand’s website. Nearly 4 in 5 retailers that use location data report running at least one geotargeted campaign, with the financial sector posting an even higher 63% adoption rate for geomarketing as a core strategy element.
Site Strategy and Real Estate
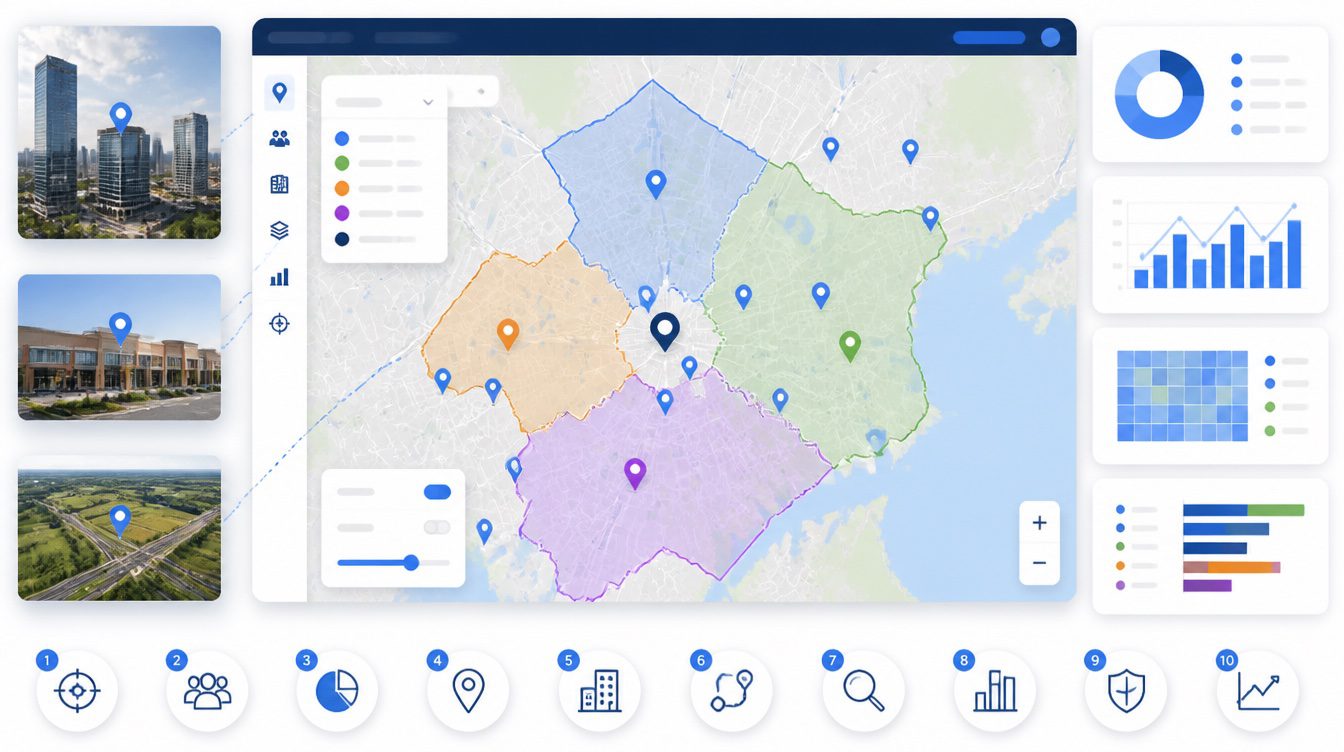
Site decisions are long-term and expensive, so they reward heavier upfront analysis. Location data is the central input.
Retail Site Selection
Retail site selection layers demographics, foot traffic, competitor distance, household income, and mobile-derived visit data over candidate sites to score lease and build-to-suit options. Chipotle, Dick’s Sporting Goods, and similar national chains use mobile foot-traffic platforms such as Placer.ai for void analysis, which identifies shopping centers whose tenant mix and visitor base fit a brand but lack a relevant operator.
Catchment, also called the trade area, is the geographic zone a store actually draws from. Standard practice splits it into primary, secondary, and tertiary rings. Mobile foot-traffic data from a typical mid-market chain often shows two-thirds of visits originating within 6 miles, with the remaining third coming from farther out. That split governs how far a marketing budget should reach and where a second store could open without cannibalizing the first. Starbucks has reported cutting site-selection risk by roughly 20% through location-intelligence-led screening, and Dick’s Sporting Goods builds its store-network expansion on GIS overlays of demographic and online-spending trends. A 2024 Deloitte commercial real estate survey found that 60% of CRE professionals still rely on legacy systems for site analytics, which means the firms that have adopted modern tooling are operating with a meaningful information advantage over their direct competitors.
Banking Branch and Telecom Rollout
Branch and tower networks rely on the same logic at larger scale. JPMorgan Chase announced a plan to add more than 500 new branches and renovate 1,700 existing ones, with the explicit goal of placing 75% of U.S. customers within an hour’s drive of a Chase branch. Roughly 100 of the new branches target what the bank calls “banking deserts” in low- and moderate-income neighborhoods. The siting model uses client migration data, branch-deposit history, and locally hired input.
Telecom rollouts follow the same playbook. By the start of 2024, more than 75% of U.S. subscribers had access to 5G from Verizon, AT&T, or T-Mobile, the result of multi-year cell-site plans that scored each candidate location against population density, terrain, backhaul availability, and competitor coverage. The global GIS market in telecom alone is projected to reach $5.3 billion by 2032.
Risk, Compliance, and Supply Chain
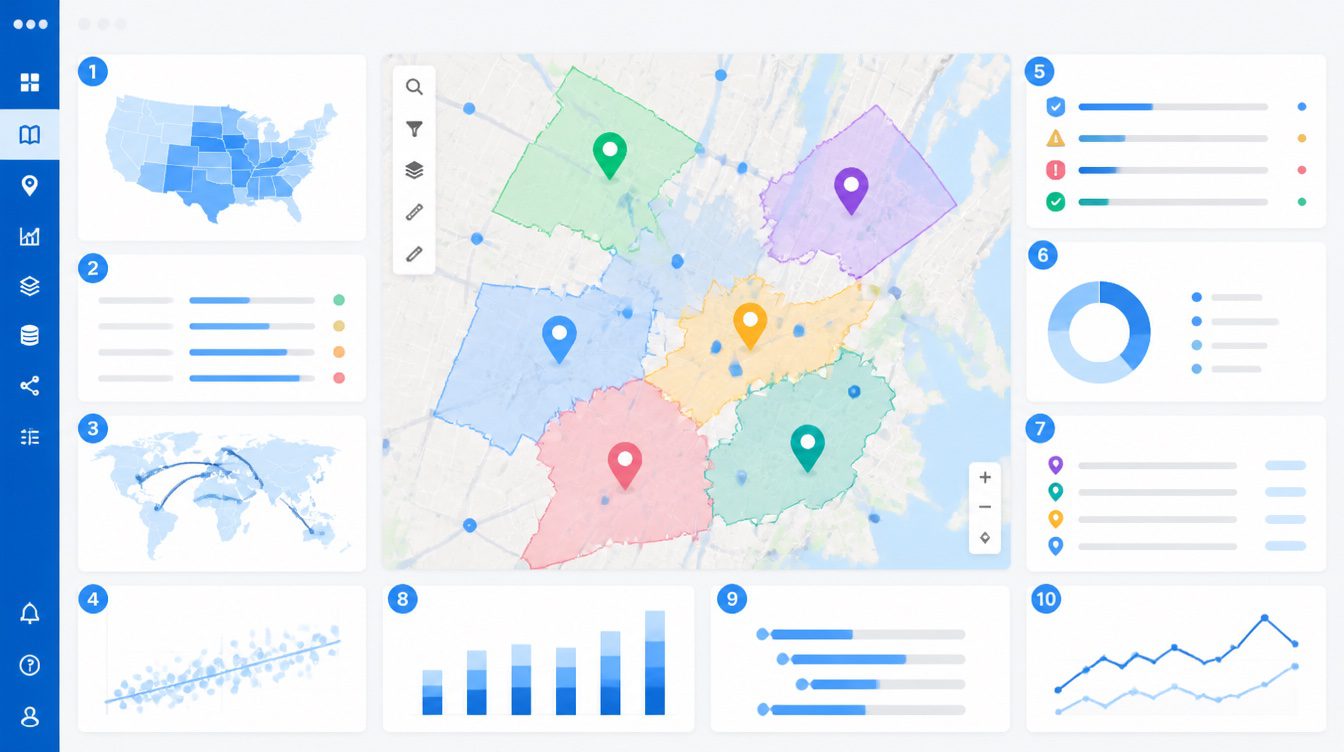
The remaining cluster covers location data as a control against loss, both physical and financial. The dollar amounts at stake are larger than in most other use cases, and the data inputs are more specialized, drawing on parcel-level peril scores, mobility signals, and supplier maps that other functions rarely touch.
Insurance Underwriting and Fraud Detection
Property insurers price policies at the parcel level using peril scores for wind, wildfire, flood, hail, and earthquake. Verisk has put modeled annual insured losses from natural catastrophes at more than $152 billion industry-wide, with severe thunderstorms, winter storms, wildfires, and inland floods now accounting for roughly two-thirds of that figure. Properties in coastal flood zones carry premiums about 40% higher than otherwise comparable properties outside those zones. The same data feeds reinsurance pricing, capital allocation, and underwriting appetite by ZIP code.
Banks and card issuers use a different flavor of location data for fraud. Geofencing compares a cardholder’s phone position against a transaction’s merchant position and flags impossible-travel patterns, spoofed devices, and transactions originating from high-risk regions. US Bank deploys geofencing for transaction verification, and mobile banking applications using device geofencing report up to 10x higher accuracy at detecting account takeovers than the default iOS or Android location services. Revolut and other neobanks use the same approach to flag unexpected-country activity within seconds of the swipe, which materially shrinks the window in which a stolen card can be drained.
Supply Chain and Distribution Network Design
Distribution network design picks where to put warehouses, hubs, and dark stores, then governs how product flows through them. The decision rests on mapped customer demand, supplier locations, transport corridors, and labor cost.
Walmart is the largest live example. The retailer is deploying 90 million Bluetooth sensors via Wiliot across its supply chain, with 4,600 sensorized locations targeted by the end of 2026. Its AI-powered demand forecasting cuts forecast error by up to 30%, roughly 60% of U.S. stores receive freight from automated distribution centers, and about half of e-commerce fulfillment center volume runs through automation. Industry pilots of simulated twin-network models in logistics report 20% gains in on-time delivery, 10% lower labor expense, and 5% revenue lift.
Frequently Asked Questions
How big is the location intelligence market?
The global location intelligence market was estimated at roughly $21.21 billion in 2024 and is projected to reach about $24.70 billion in 2025. Longer-range forecasts put the market in the $74 billion to $109 billion range by 2035, with compound annual growth rates between 13% and 16% depending on the source.
What percentage of business data has a location component?
Roughly 80% of business data contains a location component, a figure widely cited from IDC and Boston Consulting Group research. The practical implication is that geography is a relevant analytical dimension for nearly every operational, financial, or customer question a business asks.
How does UPS save money with route optimization?
UPS’s ORION system evaluates more than 200,000 routing options per driver per day. The 2024 dynamic-ORION upgrade removed an additional 2 to 4 miles from each driver’s daily route, cutting about 100 million miles a year. Full deployment saves an estimated $300 to $400 million annually plus 10 million gallons of fuel and 100,000 metric tons of CO2.
How does Domino’s use location data?
Domino’s runs three location-driven systems. Pinpoint Delivery uses Google Maps to deliver to a dropped pin rather than a street address. An AI Cook Zone geofence times pizza preparation against the customer’s distance from the store. A franchise-territory model built with Precisely sets boundaries based on reachable households and socioeconomic data.
What is a trade area or catchment area in retail?
A trade area, also called a catchment, is the geographic zone a store draws customers from. Analysts split it into primary, secondary, and tertiary rings based on share of visits and willingness to travel. Mobile foot-traffic data commonly shows about two-thirds of visits originating within 6 miles of a store and the remaining third coming from farther out.
How is location data used in healthcare?
Health plans use geo-mapping to measure member-to-provider travel time and distance for network-adequacy compliance. State and federal rules require a set share of members to fall within distance limits, for example 95% per county in North Carolina and 90% in Georgia. Federal Qualified Health Plan rules effective in 2026 add independent validation and continuous monitoring, with telehealth now counted in adequacy calculations.
How is location data used in agriculture?
Precision agriculture uses GPS and GNSS for auto-steering, variable-rate fertilizer and pesticide application, and yield monitoring at the row level. As of 2023, about 52% of midsize and 70% of large U.S. crop farms use auto-steering systems. John Deere’s ExactShot variable-rate planter reports up to 66% reductions in fertilizer use.
How does geofencing work for fraud detection?
Geofencing creates virtual perimeters around physical locations. Banks compare a cardholder’s phone location against the location of a card transaction and flag impossible-travel patterns, spoofed devices, or transactions from high-risk regions. Mobile banking apps using purpose-built geofencing report up to 10x higher accuracy than default mobile-OS location services at detecting account takeovers.
How do banks use location data?
Banks use location data for branch-network planning, customer segmentation, fraud detection, and community-reinvestment compliance. JPMorgan Chase reviews client migration data when siting branches and aims to keep 75% of U.S. customers within an hour’s drive of one. US Bank and other issuers use geofencing to verify that a card transaction’s location matches the cardholder’s known position, which is part of the broader discipline of location analytics.
What is geographic segmentation in marketing?
Geographic segmentation groups customers by location, typically country, region, city, ZIP code, or neighborhood. Combined with demographics it becomes geodemographic segmentation and supports regional pricing, product mix, and creative variation. About 22.6% of companies that use customer segmentation report geography as their primary segmentation dimension.








