


The call gets made four times over the life of a business, at the first site, at a second one near it, across the territory drawn between them, and every month the ad budget renews. Each time the reasoning goes unwritten. Territory drawn badly cuts a team’s selling capacity by as much as a quarter, and an ad budget aimed at the wrong neighborhoods buys clicks from outside the service area. A map of where existing customers already cluster, weighed against block-group income, turns the call into a claim someone can check.
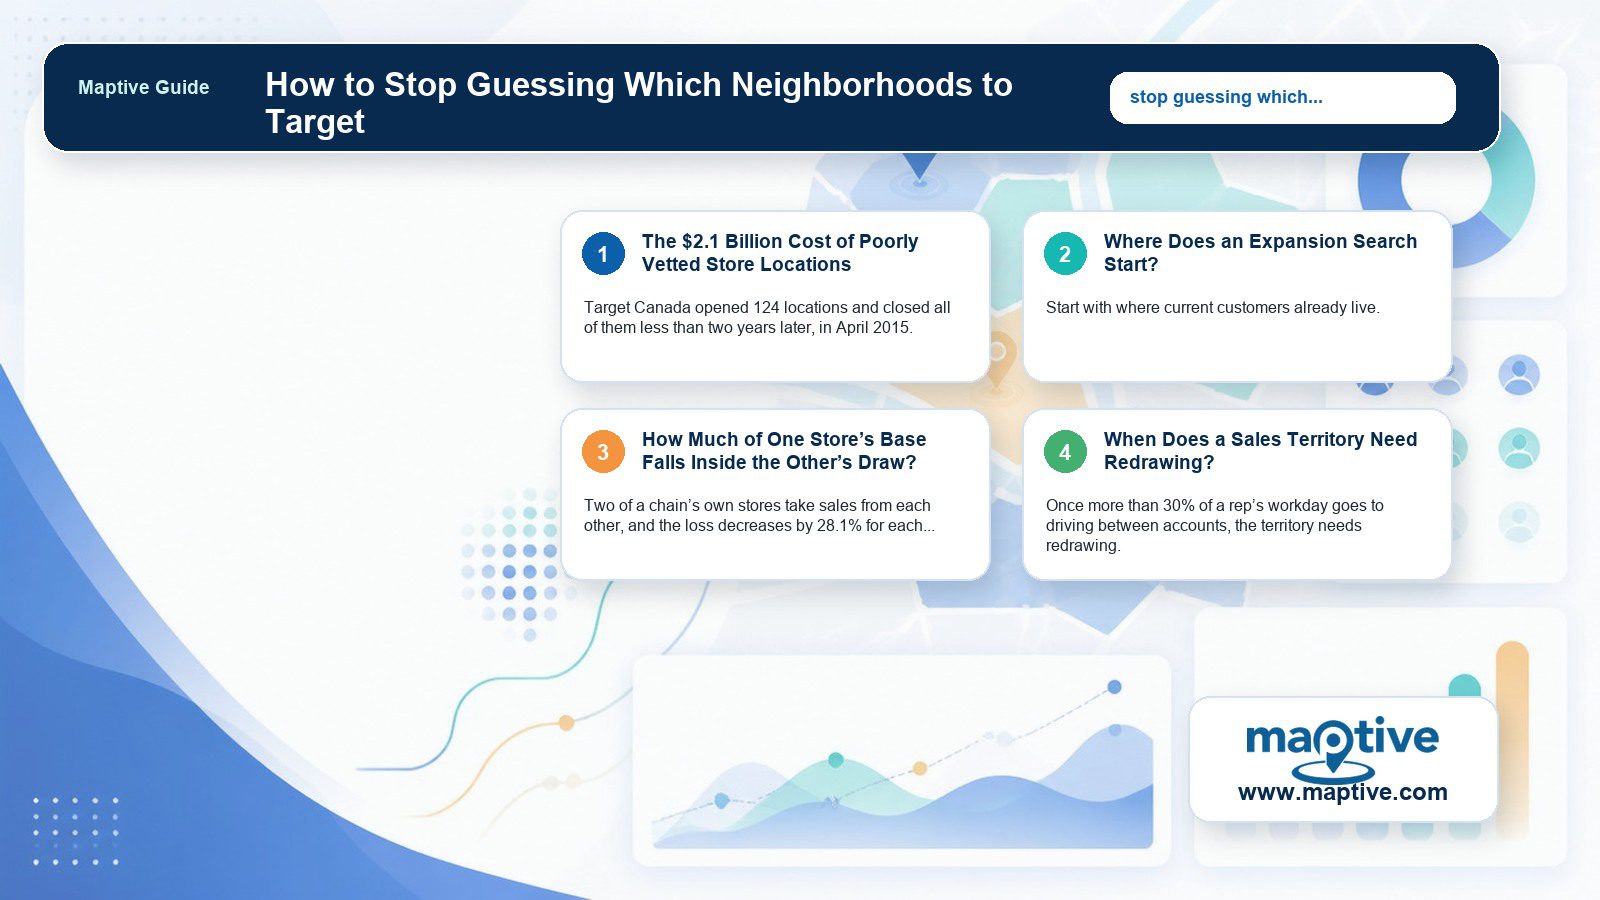
The $2.1 Billion Cost of Poorly Vetted Store Locations
Target Canada opened 124 locations and closed all of them less than two years later, in April 2015. Accumulated operating losses came to roughly $2.1 billion. Outdated, poorly vetted store locations acquired during the rush to open were one contributing cause. Supply-chain failures and mispriced merchandise made the damage worse.
Most of those signals were in the data before the rollout was approved, the kind a demographic overlay or a competitor count flags directly. US store closures climbed sharply in 2024 against the year before. Site-selection problems recur across those postmortems from a single storefront lease up to a 124-store expansion.
Months after the boundaries are set, a badly drawn sales territory starts costing a team in churn. Sales rep turnover is well above the average across other industries, and unfair or overextended territory is a named driver of it. Teams working balanced, data-checked territory report higher quota attainment.
Where Does an Expansion Search Start?
Customer Clusters First, Income Second, Competitors Last
Start with where current customers already live. A cluster of existing customers in one part of a metro area is the strongest early signal for where an expansion location or a new campaign will work, stronger than proximity to headquarters or to a competitor’s storefront.
Layering age and household income at the zip code or block-group level over that cluster narrows the search from a whole metro area down to a handful of qualifying neighborhoods. More than 50 census variables are available in Maptive at block-group resolution, so an income overlay can go directly under the customer points already on the map.
Income measures what a neighborhood can afford, leaving the question of whether it buys to the customer cluster. A zip code can score at the top of the income overlay and still be a poor bet when no existing customer lives within reach of it. The cluster comes first for that reason, and the demographics come second.
Competitor density is checked last. Count how many competitors already serve the neighborhood and weigh that against the demographic case the first two checks built.
Underserved Neighborhoods That Appear as Empty Space on a Map
An underserved market is a neighborhood with the right demographic profile and no real presence from a business or its competitors. Finding one means laying the demographic layer over a map of current coverage and looking for the empty space between them. A zip code with qualifying household income and no nearby location stops being a hunch once it is colored in on a boundary map.
How Much of One Store’s Base Falls Inside the Other’s Draw?
Two of a chain’s own stores take sales from each other, and the loss decreases by 28.1% for each additional mile of separation. A radius check is built to catch that decay while the two sites are still only a proposal on a map.
A candidate address is enough to start. Maptive’s Distance Radius Tool takes it and draws the circle. Multiple radii can appear at once, which is how two candidate sites get compared side by side.
Each radius can be exported on its own. The export is what answers how much of one location’s existing customer base falls inside the other’s draw, since eyeballing how much two circles cross is where guessing creeps back in. Matching each exported boundary against the existing customer list inside it turns a visual overlap into a specific count of accounts that would fall inside both draws.
A small overlap at the edges is normal and rarely worth acting on. But once the overlap covers a meaningful share of either location’s existing base, the lease decision changes, since past that point the customers inside the new circle were already the first store’s.
When Does a Sales Territory Need Redrawing?
The Churn Cost of a Territory Never Rechecked
Once more than 30% of a rep’s workday goes to driving between accounts, the territory needs redrawing. Territory left in that state cuts selling capacity by 15% to 25%. Both readings come back to one cause, a territory drawn once and never rechecked while account density or rep headcount changed underneath it, and the churn it produces has a price of its own. Replacing a departed rep costs recruiting spend and the pipeline that stalls while the seat is empty.
Which Automated Territory Tool Option Fits an Uneven Split?
Maptive’s Automated Territory Tool builds the redraw from sales and demographic data, through three named options. Which one a team picks depends on what broke.
Respect Sales Rep Locations factors existing rep locations into where the boundary lines fall, so a rebalance does not scramble a team’s whole footprint overnight.
Respect Previous Territories keeps continuity with the current map and avoids a start from a blank one. It is the wrong pick when the uneven split is the problem, because continuity is what preserved the split.
Optimize with Constraints applies limits to whichever variables were already selected as territory-creation inputs. A cap on maximum account count or a floor on revenue per rep gets enforced on the redraw itself.
All three work from the account list a team already has, returning a new legend and a new set of boundary lines built from that data.
Ad Clicks Arriving From Outside the Service Area
A local service business paying $12 a click can lose hundreds of dollars a month to clicks arriving from well outside its real service area. Across the category, poor or misdirected targeting wastes roughly two-thirds of location-based ad spend, split between impressions delivered outside the intended area and weak location-signal quality underneath the targeting itself. The campaign reporting shows clicks and cost per click inside their normal range, and the waste stays inside those numbers until the click locations are plotted against the service area.
Location-tagged records go into Maptive’s Heat Mapping Tool and come back as a color-coded map by intensity, keyed either to marker density or to a numeric column like sales or revenue. Laid under a map of where campaign budget currently goes, that heat map of service calls rarely lines up with it on the first pass, and the gap between the two is where the wasted spend is going.
Should the Boundary Be Drawn in Miles or in Drive Time?
Miles are the right unit for a first pass across a metro area. A destination retailer that people will cross town for can be screened that way without much distortion. For a neighborhood plumber, or anywhere a mile in one direction means five minutes and a mile in another twenty, drive time has to draw the boundary before the shortlist narrows to one site.
The Customer Records a Business Already Holds
A map narrows the guess to a judgment call on staffing and lease terms, and it does not make that call.
What it changes is the use a business gets from records it already holds. The customer list and the sales column were on hand before any map existed, ready to be plotted again the next time the question comes up. None of it requires new data, only the records the business has been filing all along.
Frequently Asked Questions
How do you choose which neighborhoods to target?
Customer clusters and demographic data narrow the list first. Competitor density is checked last, once the demographic case is already in place.
What data should I use to pick a target market location?
Demographic data such as income and household size, plus real travel-distance data on how far current customers already come from, are the two inputs that narrow the list first. Competitor location data is the third check, run after those two.
How do you know if a neighborhood is a good fit for a business?
Check the demographic match to the target customer profile, and look at nearby complementary or competing businesses already operating there.
What is an underserved market and how do you find one?
A geographic area with qualifying demographics and no real presence from a business or its competitors. A repeated look is the practical test, because one day’s foot-traffic reading can be a temporary dip.
What’s the cost of poor sales territory design?
Estimates put the reduction in sales capacity from poorly designed territory at 15% to 25%. The 10% to 20% productivity gain quoted for optimized plans comes from the vendors selling them. Quota attainment runs higher on balanced territory as well.
What percentage of a sales rep’s time is spent driving instead of selling?
A workday where more than 30% of the hours go to driving is treated as a signal the territory needs redrawing. What is left after the driving is the selling time a rebalance is trying to recover.
How do you use zip code data to target a neighborhood?
Layer zip-code-level income and population density onto a map, color-coded by intensity, so the space between where qualifying customers live and where a business currently spends or operates becomes visible directly on the map.
How far should a customer be willing to travel for a local business?
The distance depends mostly on why the trip is happening in the first place. A business people already travel to for a specific reason supports a wider draw, while a business serving daily errands needs a boundary closer to actual walking or short-drive distance.
What went wrong with Target’s expansion into Canada?
Target Canada closed in April 2015 after roughly $2.1 billion in operating losses, less than two years after a 124-store rollout. Outdated and poorly vetted store locations are cited as a contributing cause, layered on top of supply-chain failures and mispriced merchandise.
How many retail stores closed in the US recently?
7,327 US stores closed in 2024, a 57.8% jump over 2023, an average of roughly 20 closures a day.
What’s the difference between a radius map and a drive-time map?
A radius is measured in miles and a drive-time polygon in minutes. Here the radius does the first pass across a metro area, and drive time draws the boundary once the shortlist narrows toward a single site.
How does sales territory mapping help a business grow?
It divides a service area into regions sized to match where demand and coverage gaps are. The measurable results are less windshield time and a more balanced workload per rep.