
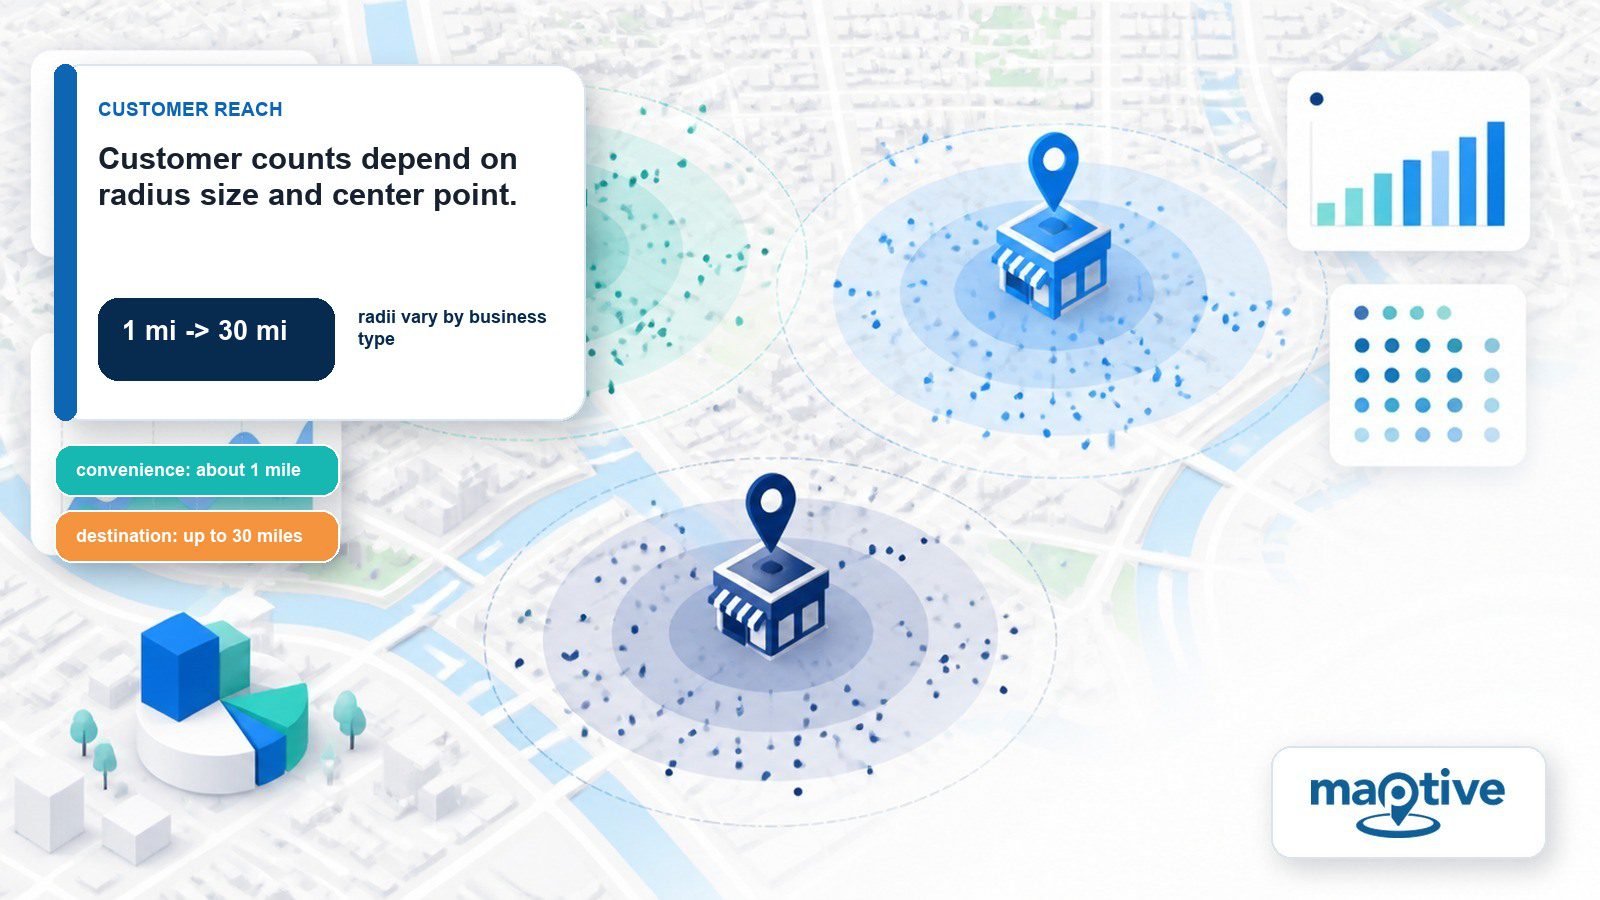
The count a radius returns is decided before anyone reads it, by where the center point is placed and how wide the circle is drawn. A wrong number almost never traces back to the customer data. Trade-area distances vary by what the branch sells. A convenience store draws from about a mile and a destination restaurant from 30, so one default radius across a branch network returns a correct count against the wrong question. The mechanics in Maptive are a circle around the branch and a Group Count on the records inside it.
Which Records Fall Inside a Distance Radius?
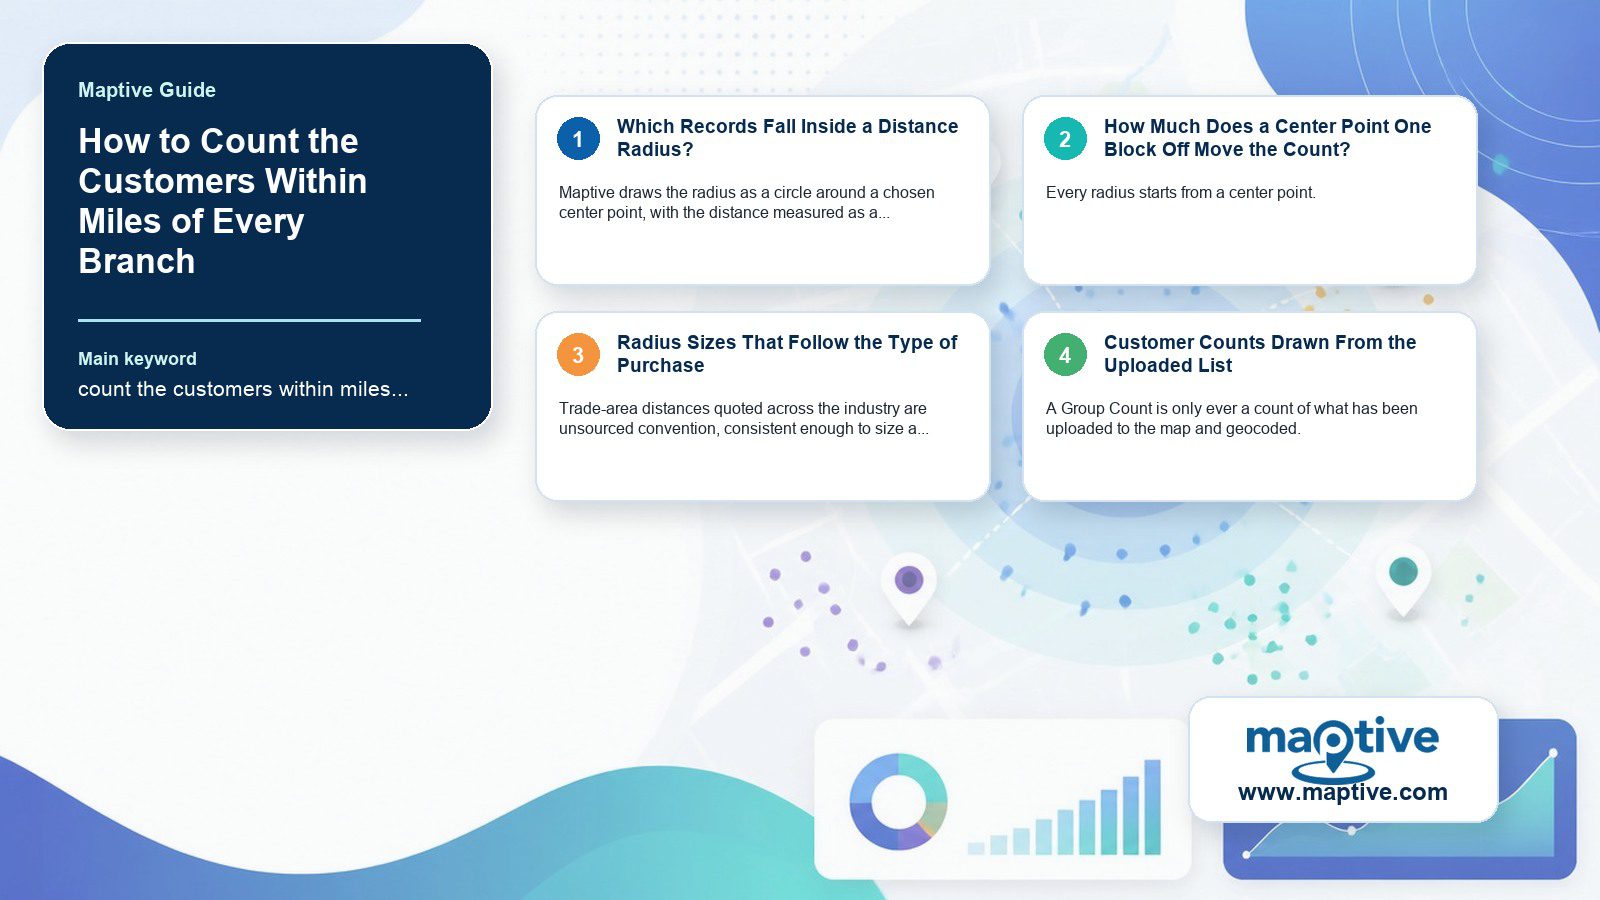
Maptive draws the radius as a circle around a chosen center point, with the distance measured as a straight line across the map. Distance is set in miles or kilometers. Which records fall inside follows from those two settings alone, independent of the columns in the uploaded customer file.
How Much Does a Center Point One Block Off Move the Count?
Every radius starts from a center point. Its placement sets everything the circle counts afterward. Move it a mile in either direction and the circle captures an entirely different set of addresses at an identical radius size. A branch address entered with a typo, or a marker placed one block off, moves the whole count onto a different set of households, and the mailer list exported from that circle goes out to them.
Center Points Set by Address, Map Click, or Device Location
The Starting Location field takes a typed address, which is the direct route when the branch’s address is already known. Clicking a point on the map places the center there instead, with no address typed, for a location that is obvious on the map but hard to pin to an address. The device’s current location can also serve as the center, which answers a coverage question from inside the branch.
Branch Pins With Coordinates Already Plotted
A branch pin already plotted from an uploaded location list has its own tools menu. Add Radius on that menu sets the center to the plotted coordinates. Across a network of branch pins, that command applies to one marker at a time, or to every pin at once through the Apply To setting.
Radius Sizes That Follow the Type of Purchase
Trade Area Distances That Vary by Product Category
Trade-area distances quoted across the industry are unsourced convention, consistent enough to size a first circle. A convenience store draws from as little as a 1-mile radius, since the purchase is impulsive. Furniture is at the far end of the range, where a planned and infrequent purchase justifies a 20-mile trip. A destination restaurant can draw customers from 30 miles because the trip itself is part of the reason for going.
Price explains more of that variation than product category does. Dstillery measured the average distance between a home and a gym at 4 miles. Inside that average, a higher-priced specialty gym drew from 5.5 miles and a lower-priced one from 3.2.
Coverage for a Specialist Branch vs. a Routine One
Multi-branch businesses size a service radius by what happens at the branch. In a hub-and-spoke banking model, the hub branch is where specialists such as wealth managers and mortgage officers work. Coverage for that role is 6 to 10 miles.
Figures from 2017 put the average distance between a commercial banking client and their lender at 4 miles in denser markets and 6 miles in less dense ones. A specialist branch draws from farther out than a routine deposit-and-withdrawal branch, because customers travel farther for a service they cannot get closer to home.
Scored against a routine-branch number, a specialist location counts as an underperformer on coverage, and the questions that follow go to its staffing and hours. Correcting the radius comes first.
Customer Counts Drawn From the Uploaded List
A Group Count is only ever a count of what has been uploaded to the map and geocoded. An address that failed to geocode is absent from the circle at any radius.
Does Customize Metrics Return a Group Count?
Clicking inside a drawn circle opens that circle’s popup. Customize Metrics from the popup opens a panel of calculation options. Group Count returns a count of every row from the uploaded customer list that falls inside the circle, which is the number a branch network is usually after.
Sum, Average, and Census Data on the Same Circle
That panel also answers adjacent questions about the same circle. Sum and Average run against any numeric column in the uploaded data, turning a customer count into a total sales figure or an average order value. High Value and Low Value each return one specific record for a chosen column. US and Canada census demographics can be added as well, putting population or median household income beside the customer count.
Can One Radius Setting Draw a Circle Around Every Branch?
For one branch, a single radius answers the question. Drawing each circle by hand does not scale past a handful of them. Switching the Apply To setting from Individual Location to Group takes a category column already in the uploaded data, such as state or branch ID, plus the specific value inside that column to circle. Maptive then draws a matching radius around every marker holding that value, all at one distance.
Filtering the underlying data before the run also filters which circles appear. A re-run scoped that way touches only the branches that need a fresh count, and every other circle in the system stays as it was.
Export Options for the Records Inside Each Circle
The count appears on the circle. The list behind it comes out of the export menu. Which button produces it depends on how many circles are in play.
What Separates Export Locations From Export File?
Export Locations on a single circle’s three-dot menu pulls that circle’s matching records, and Export File in the tool panel does that for every circle in a group-applied run at once. A marketing team building one branch’s mailer list uses Export Locations, while Export File covers a network-wide refresh.
Both write .xlsx, .tsv, or .csv. The records can also go straight to the clipboard with no file written. Format follows what happens to the file next, since a .csv or .tsv opens cleanly in almost any spreadsheet or database tool downstream and .xlsx keeps native Excel formatting intact for a file headed straight into a report. Either export can also include a distance column, set to straight-line or driving distance independently of which button produced it.
Customers Who Sit Inside the Overlap Between Two Circles
Two branch radii can overlap, and a customer living in that overlap technically belongs inside both circles at once. The export settings address that directly. One option deduplicates the record down to its nearest circle, so it is not counted twice across two branches. The export can also be reversed to return only the markers that fall outside every circle, which is how a network finds the customers no branch currently reaches. Capping the export to the N closest markers inside a circle gives a branch manager a fixed-size list.
What Does a Straight-Line Radius Miss on a Real Map?
Because a straight-line radius assumes travel in every direction at one speed, rivers and one-way streets make its boundary untrue on most real maps. A customer two miles away by straight line can face a longer drive than one five miles away with a direct highway route between them.
Yet the count is correct for what it was built to measure, customers inside a set straight-line distance of a branch. Screening a whole branch network is the job it does cheaply. The shortlist that survives goes to Maptive’s drive-time tool for the slower confirmation.
Frequently Asked Questions
How do I find out how many customers I have near a store or branch?
Plot customer addresses on a map and draw a circle around the location at the distance that matters. Maptive’s Distance Radius Tool then counts the addresses that fall inside it with a Group Count metric on the circle itself. The same tool exports the list once the count looks right, returning both the number and the customers behind it from one circle. No spreadsheet formula or manual tally is required at any step.
What is a customer radius map?
A radius map places a circle around one or more locations to show which customer or prospect records fall inside it. Distance is set in miles or kilometers, measured as a straight line from the center point.
How far will customers typically travel to visit a store or branch?
It varies by category. Industry commentary describes a convenience store drawing from as little as a mile while a furniture store or destination restaurant can draw from 20 to 30 miles, since a bigger, less frequent purchase justifies a longer trip.
How many customers does a business need within a given radius to justify a location?
There’s no universal number. It depends on the category’s typical trade-area size and the average spend per customer, so the count gets run location by location for each branch.
What percentage of a business’s customers usually come from close by?
Local-store-marketing sources commonly cite roughly 80 percent of revenue for a typical small business coming from customers within about 5 kilometers, a number repeated widely enough to use as a rule of thumb.
How do you count customers within a certain distance of a location using software?
In Maptive, draw a Distance Radius circle around the branch. The center point can be typed as an address or clicked directly on the map, and it can also come from the device’s current location or from an existing marker already plotted. Open the circle’s popup and use Customize Metrics to add a Group Count of the uploaded customer records that fall inside it.
What does “as the crow flies” mean in mapping?
It means straight-line distance between two points, the method a basic radius circle uses, ignoring the actual roads a trip would follow. This is different from actual driving distance or drive time.
What radius should a small business use to define its local customer base?
It depends on the category. Convenience or errand-type purchases call for a tighter radius, while destination or big-ticket purchases can justify a wider one. Testing a couple of radius sizes against where existing customers already live usually gives a more reliable answer than picking one default number.
How do multi-branch businesses decide how big a service radius each branch should cover?
Coverage radii differ by role and market density. A hub branch handling specialist services might cover a 6-to-10-mile radius, while an average commercial client is located about 4 to 6 miles from their branch depending on how dense the market is. Branch networks typically size radii per branch, matching the distance to what happens at that specific branch. A routine deposit-and-withdrawal branch usually needs a much tighter radius than a specialist hub.
Can a radius map show which customers are shared between two nearby branches?
Yes, when circles around two branches overlap, the customers inside that overlap are effectively contested between them, though export settings that attribute a customer to only their nearest circle are built specifically to handle that overlap. A customer deduplicated to one branch’s export won’t appear in the other branch’s export at all, which keeps a company-wide customer total accurate when the two branch counts get added together.
How do you export a list of customers who fall within a radius?
In Maptive, use the radius’s three-dot menu to Export Locations for a single circle, or Export File to export every circle’s matching customers at once, choosing the file format and whether the export should dedupe customers who fall inside more than one circle.
Does a radius count include customers outside the circle at all?
No. A Group Count metric on a circle counts only the uploaded records that fall inside it, so anything beyond the radius is absent from the number. The inverse is in the export options instead, where a setting returns every marker outside the drawn circles. That reversed list is useful for scouting where a new branch might be needed, since it shows exactly which customers no existing branch currently reaches.