

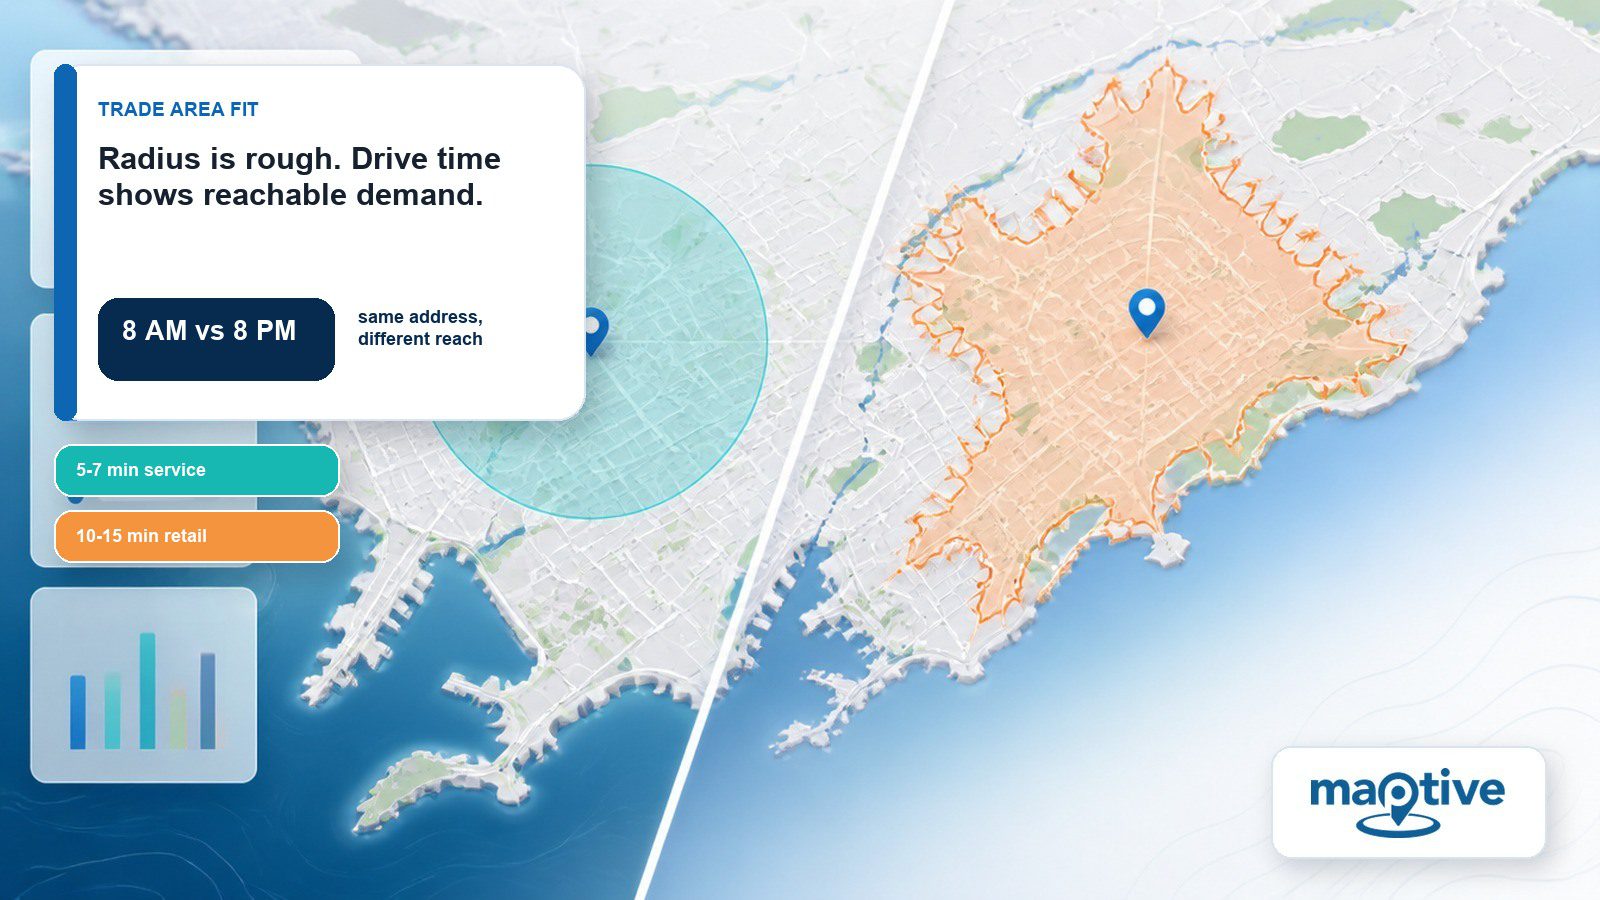
A circle drawn around a coastal site counts open water as trade area. The circle is still the right first pass when a shortlist starts at 200 locations. It costs seconds and screening is all it has to do.
Committing to one of those locations is a different job, and a drive-time polygon does it by building its boundary out of the road network itself. Geography and business format decide how far the two answers diverge for a given site. On a coast or across a river the difference is large enough to change the decision.
The Second Input That Splits a Circle From a Polygon
Each tool starts from a center point. The Distance Radius Tool takes a distance in miles or kilometers along with it and draws a circle. Handed a number of minutes instead, the Drive Time Polygon Tool builds its boundary out of the road network at posted or average speeds. Everything else about the two tools follows from that second input, including whether the boundary notices a coastline.
Maptive’s documentation for the polygon tool states that travel time is calculated from perfect driving conditions, with no historical or current traffic taken into account, which leaves the road network and posted or average speeds as the only inputs.
What comes back out of each tool decides which questions it can answer. Clicking a finished polygon opens a panel with the center address and a count of the uploaded locations inside it, along with aggregated columns a user chooses. The sales or headcount figure a decision depends on is then on screen beside the boundary. Its export covers the spreadsheet rows inside the polygon and the administrative boundaries, such as zip codes or counties, that fall fully or partially inside. Beyond straight-line distance from the center to each row, a radius export can also return driving time and driving distance for those same rows.
Maptive repeats one radius across every marker in a chosen column through an Apply To Group setting. A map can hold several polygons, each built from its own center. Both tools are under one menu group inside Map Tools, labeled Distance Radius / Drive Time Polygon Tool.
Why Does a Radius Count Open Water as Reachable?
A straight-line radius set on a coastal storefront in Tampa extends the circle well into the Gulf, counting open water as reachable territory at the same rate as the streets behind the store. Inland the same circle puts a coverage zone in the middle of a forest or a lake.
A river, or a highway with no pedestrian crossing, splits one continuous market into two disconnected ones, and a circle drawn across either barrier still claims the far side as covered. A customer standing on that far side reaches the store by way of the nearest bridge, a longer trip than the circle credited. A drive-time polygon avoids the problem by construction, drawing only the area a driver can reach by road.
Conditions a Polygon Cannot Account For
Can One Polygon Answer for Both Morning and Night?
Under normal conditions, a polygon answers what a driver can reach. Those are the only conditions available to it. The same address run at 8 in the morning and again at 8 at night returns one outline both times, since the calculation works from posted or average speeds with no live traffic input.
For a lease signed months ahead, normal conditions are what a planner needs. Near a known closure or a long construction project, nothing in the polygon flags what has changed. The number on screen has to be checked by hand.
Assumed at 16 minutes on the strength of typical format travel, one specialty retail trade area came back at 23 when it was checked against real customer loyalty and location data. The usual caution is against overstating a service area, and this assumption understated it by 7 minutes. The tool draws whatever minute figure it is given, with customer data as the only check on that figure.
Marketing Claims That the Documentation Contradicts
Although Maptive’s marketing pages for this tool claim live traffic feeds and real-time adjustment for closed roads and construction, the product documentation for the same feature describes a calculation that takes no account of traffic. Both pages come from one company about one product, and only one of them describes the tool a user operates. The minutes on a polygon are theoretical minutes, whatever the marketing page says.
Business Formats That Set Their Own Travel Pattern
Quick-service business formats are planned around 5 to 7 minutes of drive time and general retail around 10 to 15, both stated in minutes because format sets the travel pattern more tightly than raw distance does. One radius applied across every format produces a poor answer for most of them.
The Huff gravity model, formalized in the 1960s, remains the basis of trade-area analysis. It treats a customer’s probability of visiting a location as a function of two quantities, the travel time to reach it and the location’s relative appeal. Probability decays as travel time grows. A circle measured in miles substitutes an approximation the theory never called for.
An $18,000 Income Difference on One Piece of Ground
The comparison below uses an invented site, sized to show how far the two boundaries can diverge. On that site, a 10-minute drive-time polygon returns a median household income of $112,000 while a 3-mile radius returns $94,000. The radius population is younger and more apartment-heavy.
Both numbers describe one site. Which number reaches a format decision depends on the choice of tool that drew the boundary, and an $18,000 income difference with a different age and housing profile attached to it supports two different store formats on one piece of ground.
Which Tool Sets the Boundary for a Given Site?
On a coastline, or on the far side of a river crossed by two bridges, a site needs a drive-time polygon, since the circle will hand back the water and the far bank as covered ground. Across dense, walkable ground the two distances rarely diverge enough to justify the extra step.
Foot traffic from a few blocks away is described by a circle without much loss. Once those customers are arriving by car across suburban or mixed terrain, the unit has to be minutes, since that is what their trip is measured in.
None of that makes the radius disposable. It remains the faster tool for early screening and for bulk territory estimates across many locations at once. The Apply To Group setting circles 200 candidate locations in one action, long before any of them justifies a full site-selection study. When the question genuinely is how many things fall inside a set number of miles, the circle answers it directly.
Most trade-area calculations in practice use both. A drive-time polygon sets the outer boundary a business can realistically serve, and customer origin data layered inside that boundary shows how visit frequency varies from the center outward, refining an estimate a single boundary alone would leave too wide.
The circle does the screening, and the polygon confirms the finalists before a decision is committed to a site.
Frequently Asked Questions
What is a drive time polygon?
A drive time polygon shows every location reachable within a set travel time along the actual road network.
What is the difference between a radius map and a drive time map?
Because a radius map is drawn to a fixed distance in miles, it takes no account of roads or barriers. A drive time map is drawn to a number of minutes and follows the road network’s actual layout.
Is a 10-minute drive time the same as a 10-mile radius?
No. A drive-time polygon stretches further along highways and pulls in tighter where roads are slow or blocked by a barrier. A radius treats every direction as equally reachable.
Does a drive time polygon account for traffic?
No. The minutes come from posted or average speeds, which leaves a known closure or an ongoing construction project as a manual check on the polygon.
What is an isochrone?
An isochrone connects points of equal travel time from one origin, drawn by tracing which roads are reachable within a set time threshold.
What information shows up when you click a drive time polygon?
Clicking a completed drive time polygon opens a panel with the center address and a count of the uploaded locations inside it. Customizable metrics about those locations appear in the same panel.
Can a radius map still export driving distance?
Yes. A Distance Radius Tool export can include straight-line distance or driving time and distance from the center point to each row.
What is a catchment area?
A catchment area is the geographic zone a location draws most of its customers from, approximated with a radius or, more precisely, a drive-time polygon.
What is distance decay?
Distance decay is the fall in a customer’s odds of visiting a location as travel time rises, offset by that location’s relative appeal. It is the reason trade-area work is measured in travel time.
Can a radius map be wrong?
Yes, whenever a one-way system or a barrier such as a river means the straight-line distance and the real travel distance diverge, since the circle still counts that area as within range.
When should a business still use a simple radius instead of a drive-time polygon?
A simple radius works best for fast early-stage screening across many locations at once, particularly with the Apply To Group setting. It also works for compact walkable catchments, where the road route and the straight line rarely differ by much.