

Sales operations analysts spend weeks tracing a missed regional number back to one territory boundary drawn months earlier. Buyers usually arrive at territory mapping software after a trace like that, or after a customer calls in about an account sitting outside every drawn territory.
The category is narrower than a typical shortlist assumes. It draws boundaries from account locations and balances them against a rule a manager sets, and it stops short of the dispatch and work-order software researched alongside it.
How Does Territory Mapping Software Turn Customer Records Into Boundaries?
Addresses and customer records both have a place attached to them. Territory mapping software plots that data as points on a map, then draws boundaries around groups of the points. A manager sets the rule those boundaries have to satisfy, usually revenue potential or account size. Balancing decides where each line falls. A spreadsheet sorting the same records by ZIP code returns them in the order of the digits.
One rep’s spreadsheet can show full quotas and no duplicate entries and still send that rep down a block another rep worked on Monday. Each spreadsheet describes one rep’s accounts in isolation from the other’s. A drawn boundary makes that overlap visible on sight. It also exposes the reverse, a stretch of ZIP codes that belongs to no one’s list because it fell between two definitions during the last redesign.
Territory mapping software replaces the list with live geographic boundaries and layers demographic or sales data onto them, so a manager sees coverage the way it falls on the ground.
Once boundaries exist, the software adds context on top of them. Demographic layers show population and income inside a territory. Drive-time layers replace a simple radius. The choice between the two decides how large an area a rep is expected to cover and how many households a candidate site is credited with reaching.
The Dispatch and Work-Order Jobs Territory Mapping Software Leaves Out
Territory mapping software solves geographic assignment and boundary balance. Some products add route sequencing inside an assigned area on top of that, but dispatch and field-service management software is a different purchase, the category that handles work orders and real-time technician tracking. A business shopping for territory mapping software to solve a dispatch problem is shopping in the wrong category.
A franchise development team evaluating Maptive for both territory design and technician dispatch in one purchase runs into that boundary directly. Maptive builds the territories and optimizes routes inside them. Real-time mobile alerts to a crew in the field do not originate inside the platform. A technician’s live position is not tracked there. Job scheduling and open work orders sit outside the product entirely. Both categories advertise mapping on a feature list. That team still needs a second tool for the dispatch half of the job.
The category line is unsettled enough that analysts disagree about how big the market is. One estimate puts the sales-territory-mapping market at $0.8 billion in 2025, growing to $1.9 billion by 2034. A wider estimate that folds in adjacent sales-mapping and routing tools puts that grouping at $2.5 billion, headed toward $7 billion by 2033. The two vendor lists differ. So a buyer comparing the numbers is comparing two definitions of the category.
Why Do Some Field Sales Reps End Up Swamped With Accounts?
A rep enters 7097 in place of 07097 for a Jersey City lead. The missing leading zero passes as a generic five-digit number even though 7097 is not a valid ZIP code anywhere. The lead misroutes to the wrong territory. Regional numbers stay wrong until an analyst traces the error weeks later.
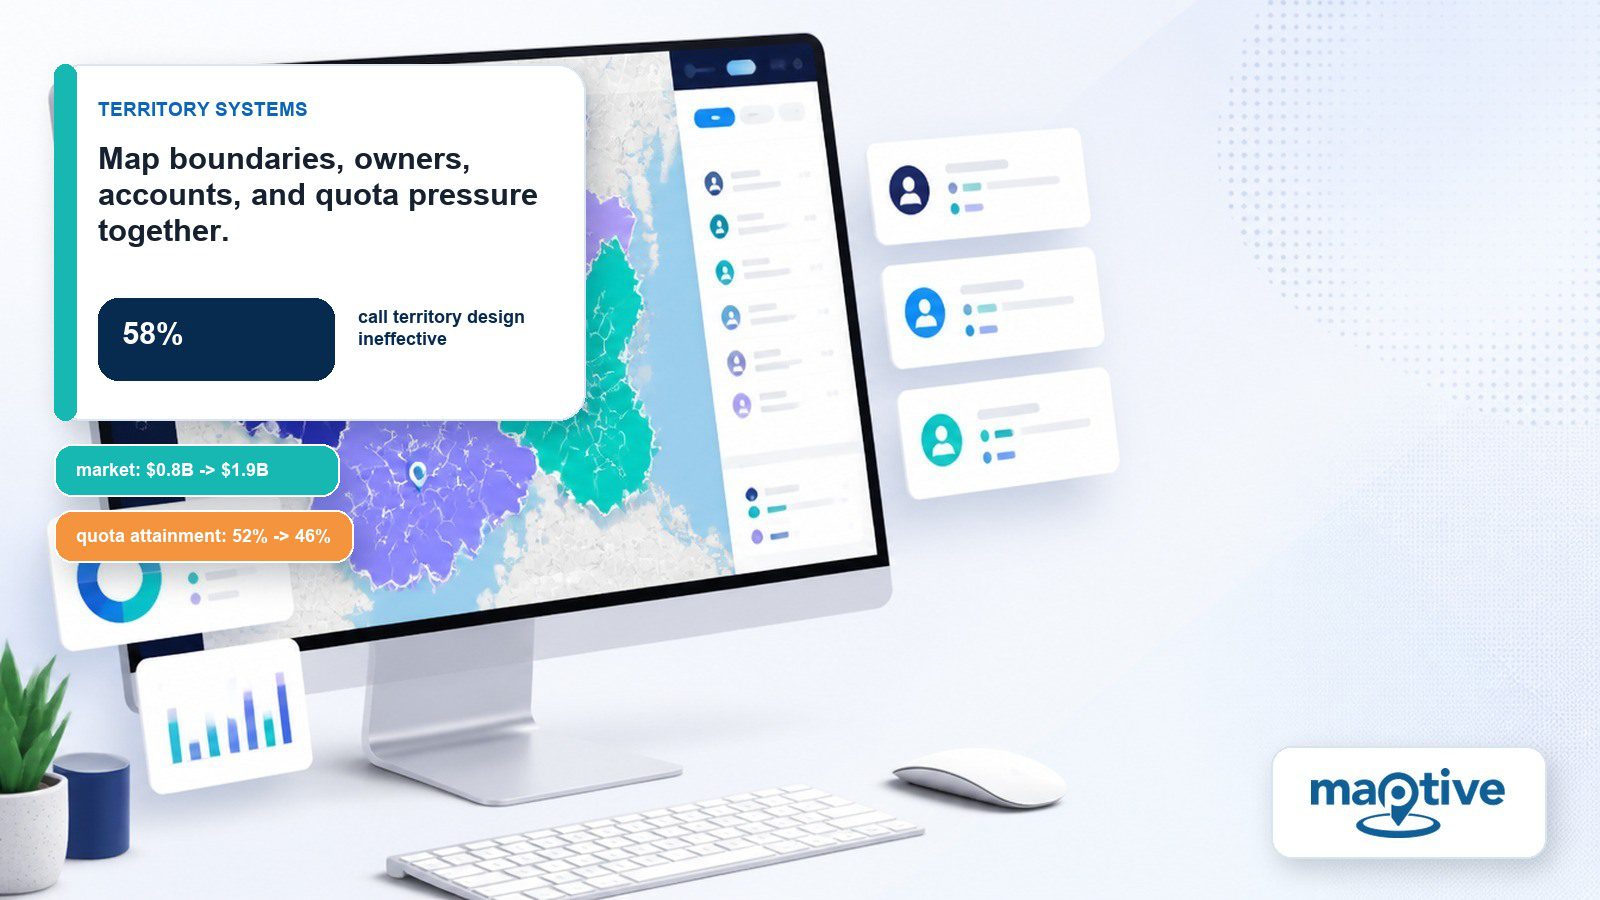
Field sales and sales operations managers build and rebalance rep territories from account data. Geography or revenue potential sets the assignment. Sales-operations material through 2026 keeps repeating a 58% figure for the share of B2B companies that describe their own territory design as ineffective, and the trail stops at the material itself. Set against B2B quota attainment falling from 52% in 2024 to 46% in 2025, territory design is at least a variable a manager controls directly.
Teams without a mapping tool split a long spreadsheet of ZIP codes by eye. Some reps come out of it swamped with accounts, and the manager who drew the line has only that spreadsheet to defend it with. The 58% who call their own design ineffective are describing that split.
What Does a Franchise Developer Plot Before Granting a Territory?
Franchise territory boundaries go into the signed franchise agreement, which gives a boundary mistake legal consequences on top of the operational ones. The developer plots the whole multi-location network on one map alongside competing and proposed sites, then defines protected territories at the ZIP-code or census-tract level so two units under one brand are not splitting one customer pool between them.
Siting also layers in labor-market data around a proposed site, where population and workforce availability matter most. A location with strong customer demand and a thin nearby labor pool becomes a staffing problem at hiring, months after the lease is signed, and the trade-area data already used to site the location contains that warning.
Getting a protected territory wrong costs money on both sides of the boundary. An existing franchisee loses sales to a new unit sited too close. The new unit underperforms because the protected boundary it was granted never matched the area it could serve. Redrawing that line afterward means reopening the franchise agreement it was written into.
How Do You Compare Candidate Sites for a Retail Store?
Drive-time boundaries define who can realistically reach a store. Data layered on top of them shows whether enough of those people are the right customers. Retail site selection combines drive-time service areas with demographic and competitor-location data to compare candidates against each other. Because a radius map counts households no driver can reach inside 15 minutes, the candidate site that scores best on a circle is the one most likely to disappoint.
A competing store changes the math again. A site next to an established, loyal competitor draws a smaller effective trade area than a radius map suggests, whatever the circle counts.
Market-saturation data answers a related question. A company opening its fifth location inside an existing radius may be moving sales off its own fourth location without growing the market. That chain ends up with five stores and four stores’ worth of sales.
The Insurance Territory That Outgrows a Single Agent
As an insurance book of business grows, two problems develop inside it, a policyholder left with no local agent and a territory that has outgrown the single agent servicing it.
Automated territory optimizers build agent and producer territories from policy density and drive-time limits, then rebalance a territory once a region outgrows its assigned agent. The optimizer previews a proposed split before publishing it. Until a manager publishes, no agent’s book changes.
What Happens to Delivery Routes When a Zone Is Redrawn?
Distribution and logistics teams build delivery zones out from each warehouse, then optimize routes against stop density and drive-time limits. The industry calls this territory routing. Zone design and route plan are one problem solved in a single pass. Redrawing a zone invalidates every route inside it.
A block on the far edge of a zone can drop out of every route after a redesign. The first sign of it is a customer calling to ask where a delivery went.
Stop density inside a zone sets how tightly a route can be packed. A driver working 60 stops along one arterial corridor finishes hours ahead of a driver working 60 stops scattered through a rural county, and the zone file records 60 for both.
The Real Estate Farm Area That Holds Only 60 Prospects
A real estate agent’s farm area of 2,000 households with a 3% likely-to-list rate holds about 60 real prospects. The postage covers all 2,000. Filtering that area by likely-to-list or absentee-owner status narrows the outreach to the households worth the postage.
Agents draw a custom boundary or target a radius around a specific listing to define the area in the first place. An agent working by hand can mail a block a colleague mailed the same month, and a shared map shows the collision on the first pass. Managing more than one farm area means redrawing each boundary by hand every time the target list changes.
How Much Does a Territory Build Cost per User per Month?
Pricing across the market generally spans $30 to $150 per user per month, depending on feature depth and analytics. Some products start near $39. Cost scales with data volume and the number of users, so a five-person sales team pricing out a basic territory build pays close to the entry tier, while an enterprise team layering in drive-time analysis and route optimization pays toward the top of the range.
Territory redesign alone is worth about 7% in yearly sales against the average business, on Xactly’s SMA numbers. Reps in those redesigned territories also come measurably closer to their sales objectives. Most buyers weigh that figure against the per-user price before signing.
Which tier fits comes down to how many of the layers a team will use. A five-person team that never draws a drive-time boundary is paying for boundary drawing and balance checks, which is what the entry tier covers. An enterprise team running drive-time analysis and route optimization across a national book is paying for the whole stack. The 7% redesign lift is available at both ends of that range.
Frequently Asked Questions
What is territory mapping software?
The term covers a specific category of business software, distinct from general GIS platforms and from a company’s CRM, built to convert a list of account or customer locations into drawn territories a manager can inspect for duplicate and unassigned coverage.
How do you divide sales territories?
Geographic boundary and revenue potential set the first cut. Account size and demographics adjust it, and a business with more than one product line often splits coverage by product as well.
How many sales territories should a company have?
A common approach divides the total addressable market by a target territory size and rebalances every year or two as accounts and headcount change, though no single count fits every sales organization.
Is territory mapping software the same as GIS software?
Territory mapping software is not GIS software. General-purpose GIS software is built for broad geographic analysis and typically requires specialized training, while territory mapping software is a narrower, business-focused category built around assigning and balancing coverage areas.
Does territory mapping software require GIS or mapping training?
Vendor and review-site material consistently positions the category as usable without GIS training, aimed at business users who need coverage answers quickly, without a cartography background.
Can small businesses use territory mapping software?
Several vendors price and design products specifically for small and mid-sized teams that want territory visualization without full GIS complexity or a dedicated in-house analyst.
Why do sales territories need to be redesigned periodically?
Account bases and headcount change, and so do market conditions. A territory drawn a year ago can leave some reps overloaded and others under-assigned, and that imbalance shows up in the data as overlap on one side and unowned accounts on the other.
What’s the difference between territory mapping and route optimization?
Territory mapping defines who is responsible for which geographic area. Route optimization sequences the stops inside that area for a given day or week. Distribution and logistics teams typically run both together, a combination the industry calls territory routing.
What’s the ROI of investing in territory mapping software?
Published ROI figures measure the sales-performance lift a redesign produces. Most buyers work with roughly 7% in yearly sales against a subscription costing $30 to $150 per user per month. Rebuilding the boundaries and reassigning the reps has to happen before any of that lift arrives.
How does territory mapping software help a sales team day to day?
Day to day, it helps a manager decide who covers which account and how a route gets planned inside the territory. It also shows which prospects to work first, based on density on the map.
Does territory mapping software help with franchise expansion?
It helps because franchise expansion decisions turn on where a protected boundary falls. Plotting proposed sites against the existing unit network and every competing location shows a developer where a new unit would crowd an existing franchisee and where the network leaves a stretch of territory unserved.