

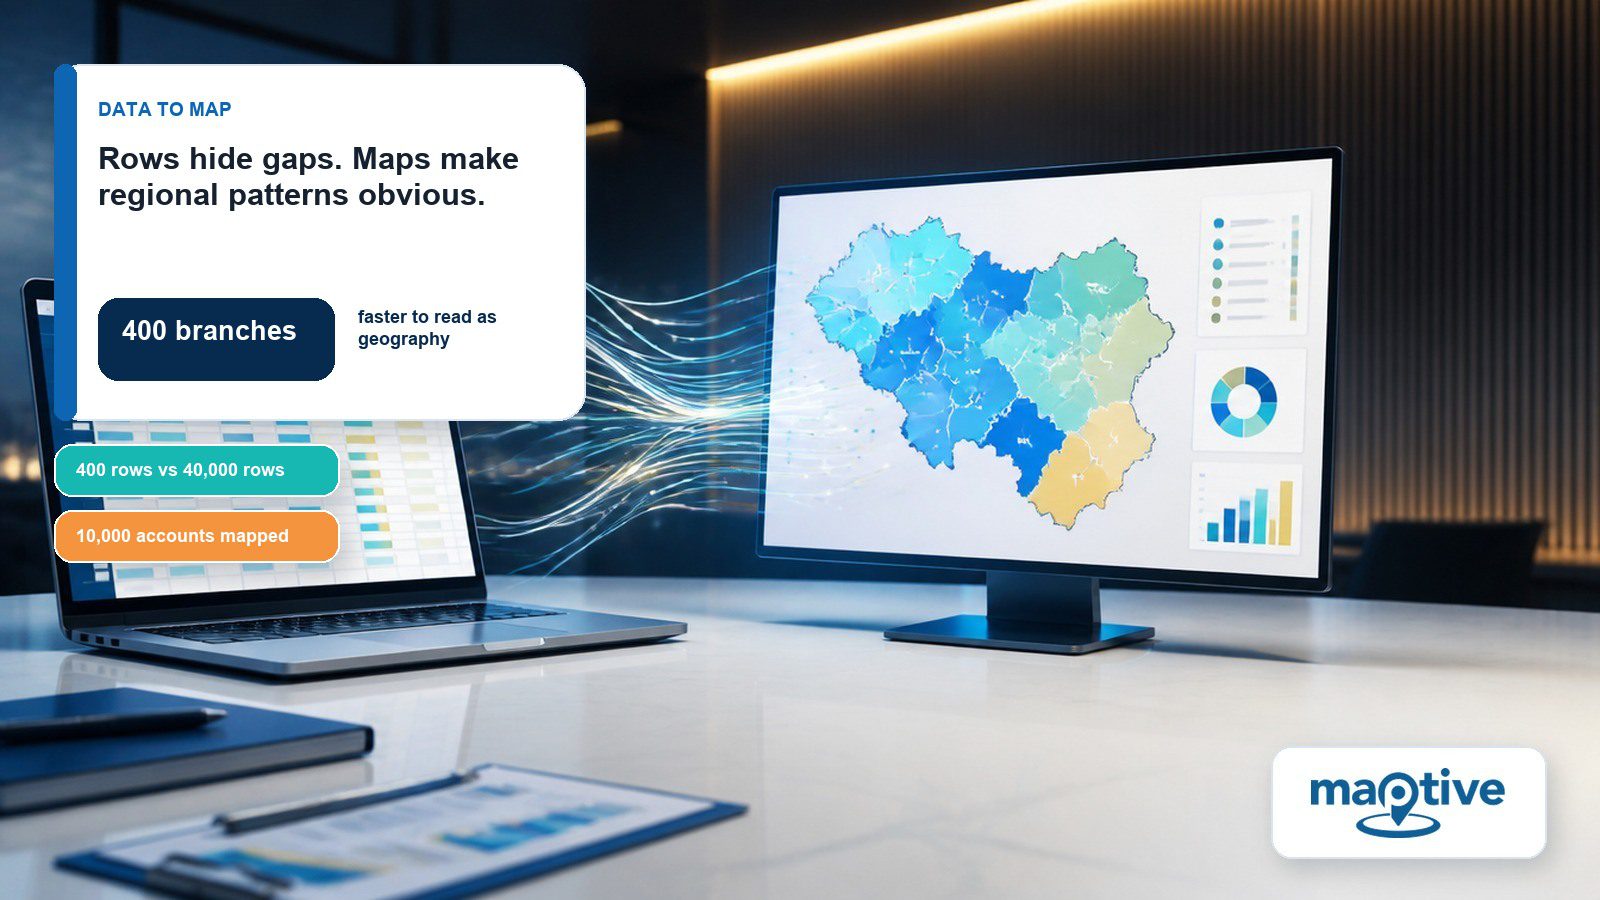
Sorted by zip code, a 400-branch regional list takes real effort to read for a coverage gap, and reading it out loud in a leadership review is worse. The file usually comes from another team. The person presenting it inherits every formatting decision inside it.
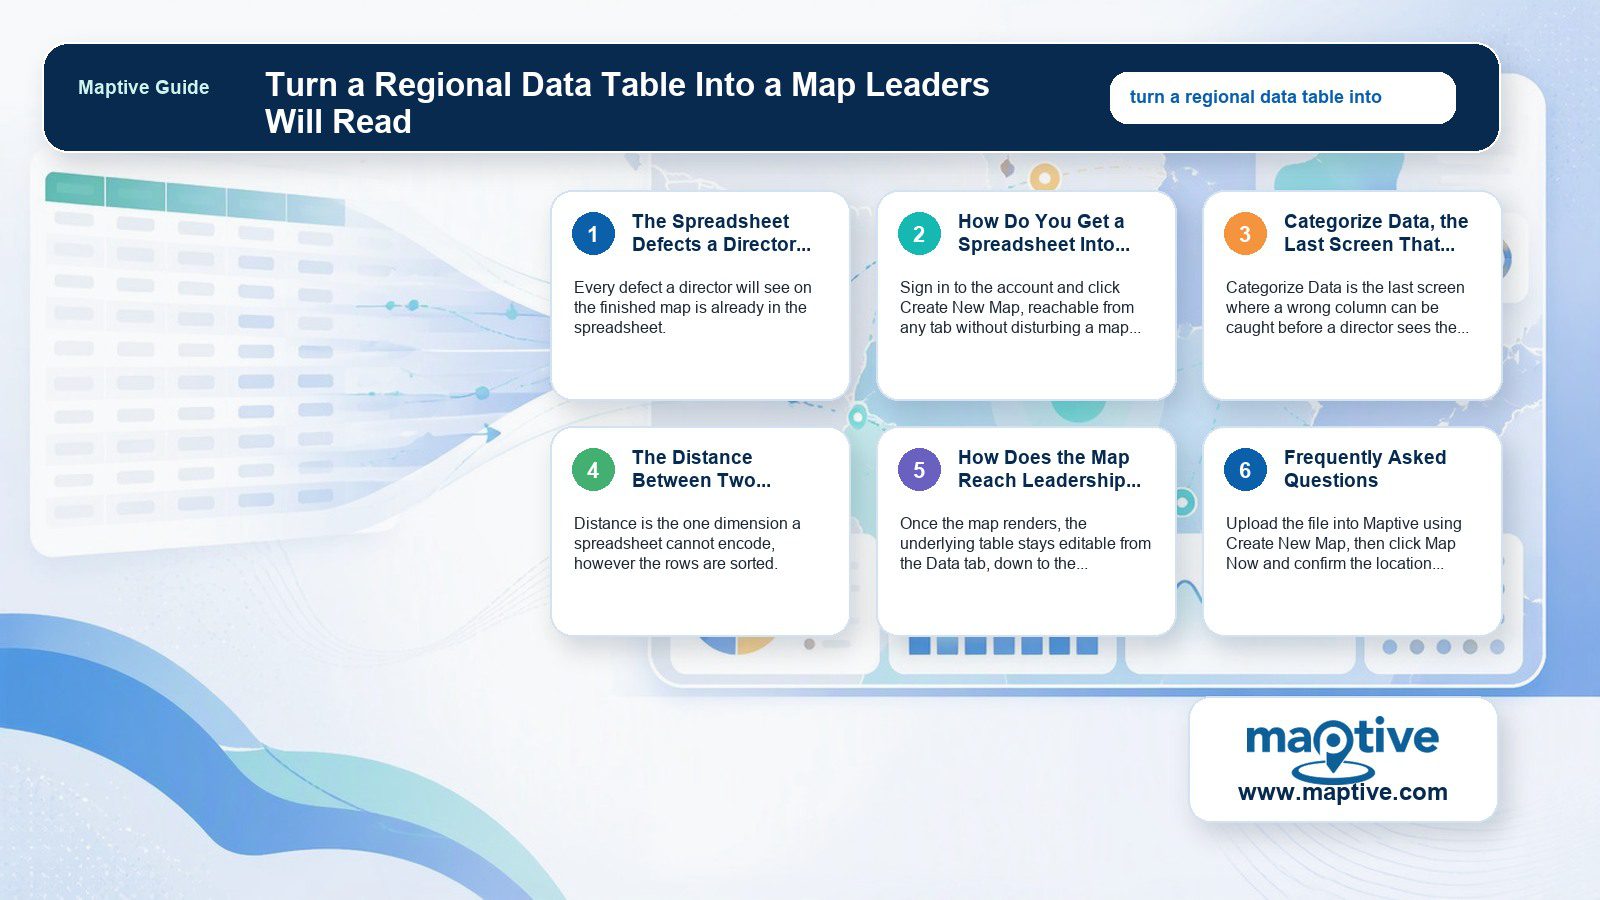
Maptive asks for one column out of that file. Inconsistent formatting anywhere else in the header row turns into manual repair after the upload, and that formatting is visible in the spreadsheet beforehand.
The Spreadsheet Defects a Director Sees on the Finished Map
Every defect a director will see on the finished map is already in the spreadsheet.
The One Column Maptive Needs to Plot a Point
Maptive needs exactly one column that identifies a place, something as simple as an address or a zip code. A name or a phone number can be in another column and appear in the marker pop-up once the map loads, though neither one is required to plot the point.
Why Does Header Formatting Break Column Matching After the Upload?
Formatting details cause most of the manual fixing that follows an upload. The defects repeat from file to file:
A location fact split across two cells, city in one column and state in another when the tool expects them joined, produces a row the column-matching step after the upload cannot confidently match.
A state written as “NY” in row 40 and “New York” in row 4,000 gives that step two values for one place, and each spelling becomes its own category in the dialog.
A column labeled “Location” in one file and “location” in another forces a manual fix later.
A trailing space or an extra blank row is invisible on screen and still breaks the pattern the step looks for.
The spelling mismatches concentrate in files organized by zip code across a wide metro area, which is how a regional roll-up usually arrives. A file with consistent, single-format columns passes that step with no manual reassignment. One pass down the header row against the data beneath it catches all four before the upload screen loads.
How Do You Get a Spreadsheet Into Maptive?
Four Paths From a Spreadsheet to the Upload Screen
Sign in to the account and click Create New Map, reachable from any tab without disturbing a map already built. A pop-up asks for a name and an optional description, then moves to the upload screen.
Drag the spreadsheet onto the screen or click to browse for it. Excel and CSV files are accepted. TSV works too.
Paste the data directly into the program, headers included.
Connect a Google Sheet.
Start from a blank map and add locations one at a time.
All four paths reach one upload screen, with no template formatting required first.
What Does Maptive Do After You Click Map Now?
Map Now is the next click. It opens the Categorize Data dialog and matches what the platform sees against the categories it recognizes, with no formula or manual coordinate lookup anywhere in the process. Load time grows with the row count. Nothing else changes between a 400-row file and a 40,000-row one.
Row count rarely limits a regional file. Maptive plots tens of thousands of records on a single map, and Kravet, a customer of a decade, maps 10,000 accounts with instant recalculation across groups of 5,000 and larger. A 400-row branch list is nowhere near that ceiling, and a map that arrives at a review looking wrong got that way from its contents.
Row order in the original spreadsheet has no bearing on the finished map, since every matched row becomes an independent marker. The Data tab records which rows matched which category, and opening it as soon as the map renders confirms the finished map against the spreadsheet that went in.
Categorize Data, the Last Screen That Catches a Wrong Column
Categorize Data is the last screen where a wrong column can be caught before a director sees the result.
Which Columns Does the Categorize Data Dialog Auto-Match?
After Map Now, a Categorize Data dialog appears and attempts to auto-match address-type columns, Address, City, State, Zip, to the right field. Beyond the address fields, five more categories can each match to one column apiece:
Location Name
Website URL
Image URL
Phone
Not every column has to match. An unmatched column still displays in the marker pop-up, though it does not feed the geocoding.
The Dropdown That Reassigns a Mismatched Column
When a column matches the wrong category, or nothing at all, a dropdown reassigns it by hand before geocoding starts. The reassignment takes seconds. The dialog flags the mismatch and leaves the diagnosis to the person who prepared the file.
Ten reassigned fields usually trace back to one column. A duplicate row causes most of them, one account entered twice under slightly different spellings that render as two markers stacked on one point. Removing it before the next upload keeps the marker count honest and stops the reassignment work from repeating. Mixed-format columns from the prep step account for most of the rest.
Clicking Done commits the assignments and starts the geocoding. Maptive works through the file from the first row to the last, turning each matched row into a marker as the map fills in.
The Distance Between Two Accounts That No Sorted Table Records
Distance is the one dimension a spreadsheet cannot encode, however the rows are sorted. Two accounts on adjacent lines might be a mile apart or five hundred, and the column order puts them side by side either way. On a map, an unusually large or small account renders as a visibly different marker, positioned apart from its neighbors. A pivot table sums or averages the region into one figure, and that account disappears into the total.
Color the accounts by value and a territory drawn on zip codes stops looking evenly sized. The spreadsheet ranks them by row count. But the territory with the most rows can have the least revenue potential and the longest drives between accounts.
One mistyped or mis-assigned zip code can misroute hundreds of accounts into the wrong territory. On the map it shows up as a cluster of markers positioned inside another territory’s boundary.
How Does the Map Reach Leadership Without a Walkthrough?
Can You Edit the Table After the Map Renders?
Once the map renders, the underlying table stays editable from the Data tab, down to the individual cell. Rows and columns can be added or removed there as well.
A row added after the map is live becomes a new marker. A branch that closes comes off the table and off the map in one motion. Neither edit needs a fresh upload.
An export pulled after a working session includes the edits made since the original upload, and the data also copies straight to the clipboard. Clicking a marker’s pop-up and opening its settings edits that single record from the map itself.
The Territory Call a Director Checks Without a Spreadsheet
Leadership receives the map as a link with controlled viewer permissions, or as an export a director can open unaided. Colored by account value or territory, it needs no walkthrough, since a director checks a territory call on the screen with no reformatted spreadsheet in between and no request routed back to the person who prepared the file. Territories that took months to build row by row in Excel are laid out on one screen and recalculated the moment an account moves.
Frequently Asked Questions
How do I turn a spreadsheet into a map?
Upload the file into Maptive using Create New Map, then click Map Now and confirm the location column during Categorize Data. A later re-upload refreshes the existing map without creating a new one.
What format does my data need to be in to plot it on a map?
One location column, an address or a zip code, is all Maptive requires. Pasting data straight into the program still needs the header row included for the columns to match.
Can I make a map from Excel data without knowing GIS or coding?
Maptive needs no GIS background to operate, and a Google Sheet connects directly without exporting a file first.
Is there a row limit for mapping spreadsheet data?
There is no hard row cap. A larger file costs load time, since more rows take longer to geocode.
What happens if my spreadsheet’s address column doesn’t match automatically?
The Categorize Data dialog flags anything it couldn’t confidently match, and the row still uploads while it waits for a fix. A column labeled “HQ” commonly triggers this, since the auto-matcher relies on recognizable header words like “Address” or “Zip.”
How long does it take to turn a spreadsheet into a map?
Load time grows with dataset size once geocoding starts, and most files finish inside a few minutes.
Do I need to clean my spreadsheet before mapping it?
Duplicate rows and mixed formatting inside one column are the two most common causes of a dropped or mismatched row during Categorize Data. Neither needs a rebuild, only a pass through the file before the next upload. A duplicate often comes from combining two export files into one spreadsheet without checking for overlap first. Catching it before the upload is faster than untangling two overlapping markers on a finished map.
Why can’t leaders spot patterns in a spreadsheet the way they can on a map?
A pivot table or a filtered view can summarize a region, but neither one plots a single address next to its neighbors on a page. A map does that by default, which is why a coverage gap that takes a formula to compute in a spreadsheet is visible in a map without any calculation at all.
Can a map show sales territory workload imbalance that a spreadsheet doesn’t?
Workload factors like account dispersion and travel distance are spatial, and revenue totals never capture them. A rep whose accounts sit inside one neighborhood can work the list in a morning, while a colleague holding the same number across three counties spends most of the week driving between them. A map makes that difference visible the moment the territories are drawn, well before a rep’s schedule reveals the same imbalance the hard way.
Do I need GIS software to build a territory map from a spreadsheet?
No. Current business mapping platforms, including Maptive, are built so sales and operations staff can go from a spreadsheet to a territory map without specialized geospatial training.